The wavelength division multiplexing-passive optical network (WDM-PON) has been attracted as a next generation access network, since it can provide unlimited bandwidth, high security, and protocol transparency [1]. However, it is not easy to provide broadcasting services efficiently in the WDM-PON because of its virtual point-to-point connectivity based on dedicated wavelength. To solve this drawback, many broadcasting methods have been proposed.
For the in-band case, the broadcasting signal can be overlaid by multiplexing techniques in RF domain [2-4]. This method is well known for a sub-carrier multiplexing (SCM) of downstream WDM-PON signal and broadcasting signal. However, this method has some technical issues. It requires linear transmitters and receivers with a high electrical bandwidth. In addition, there exist dispersion penalty, inter RF channel crosstalk, and at least 3-dB power loss in the optical power budget induced by the SCM. By using the orthogonal modulation, the guard band between different RF channels can be minimized [4]. Instead of the multiplexing method in the RF domain, the optical side mode generated from a single wavelength can be used to transmit the broadcasting signal [5]. A high speed external modulator driven by an RF signal generates an optical side mode from a single wavelength light input. The broadcasting signal is then imposed on one of the generated side bands. However, this proposed method needs an expensive high speed Mach-Zehnder type external modulator (MZM) and additional architecture to receive an upstream signal.
On the other hand, the out-of-band multiplexing method can minimize the penalty in downstream link budget with the cost of the extra wavelength or wavelength band. A single channel broadcasting signal was overlaid into the WDM-PON with parallel connection of an optical power splitter and an arrayed waveguide grating (AWG) at the remote node (RN) [6]. However, a bank of optical filters is needed at the RN. An additional wavelength band can be used to transmit the broadcasting signal without the modification of the RN. In other words, the RN is an AWG that has periodic transmission characteristics with a free spectral range (FSR). The broadcasting band is distinguished from the WDM-PON signal band by an FSR or multiple FSRs. For cost effective implementation, a directly modulated light emitting diode (LED) was used as a multiwavelength source (MWS) for the broadcasting signal [7]. However, transmission capacity was limited by the high relative intensity noise (RIN) originated from an amplified spontaneous emission (ASE)-ASE beat noise. Besides, a transmission distance was limited by available power from the LED. The LED can be replaced by an ASE injected Fabry-Perot laser diode (F-P LD) to increase the light output power, while maintaining a direct modulation feature [8]. The transmission data rate is also limited to 622-Mb/ s/channel by ASE-ASE beat noise, though. Recently, the 1.25-Gb/s/channel broadcast signal transmission based on a high-power superluminescent diode (SLED) is successfully demonstrated over 32 channels [9]. However, this demonstration needs a forward error correction (FEC). As the alternative cost effective optical source with a low noise characteristic, a mutually injected F-P LDs (MI F-P LDs) was proposed [10]. It has a low RIN which is similar to a distributed feedback (DFB) LD. By using this low noise optical source and an external modulator, the 1.25-Gb/s/ channel broadcasting signal transmission was demonstrated without employing the FEC.
In this paper, we experimentally demonstrated the cost effective broadcast signal transmission based on the MI F-P LDs with external and direct modulation. For both cases, we investigate details of the RIN and spectral characteristics of the MI F-P LDs. We believe that this proposed method can be useful for providing the high-speed broadcasting service in a cost effective manner.
II. PROPOSED ARCHITECTURE OF WDM-PON FOR BROADCASTING
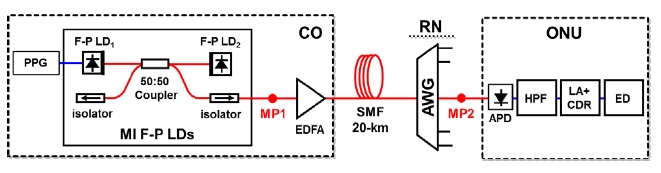
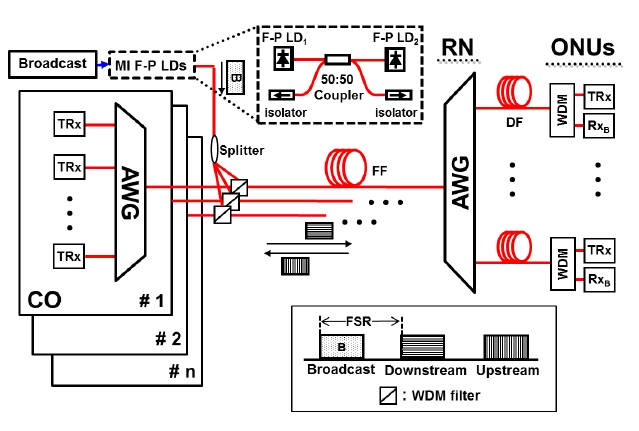
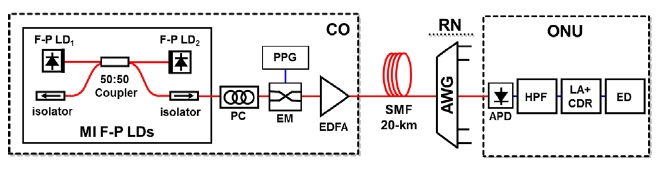
The proposed scheme for transmitting the broadcast signal in WDM-PON is shown in Figure 1. The MI F-P LDs in the dashed box of Figure 1 are composed of two antireflection coated F-P LDs, a 50:50 optical coupler, and two isolators. It generates multimode light with low noise [10]. The broadcast signal can be imposed on the MI F-P LDs by external or direct modulation. For the external modulation, we need an external modulator after the MI
F-P LDs. However, we modulated one of the F-P LDs directly. The modulated multi-wavelength broadcasting signal was coupled to a transmission fiber via a WDM filter. It propagated through the feeder fiber (FF) and the AWG at the RN. It was then received by the optical receiver (RxB) at the optical network unit (ONU) after passing through drop fiber (DF) and the WDM filter. It may be noted again that the broadcasting signal band (B-band) is separated by integer multiples of the AWG’s FSR from those of the up/downstream WDM-PON signal as shown in Figure 1, thanks to a cyclic property of the AWG.
III. EXPERIMENTAL RESULTS AND ANALYSIS
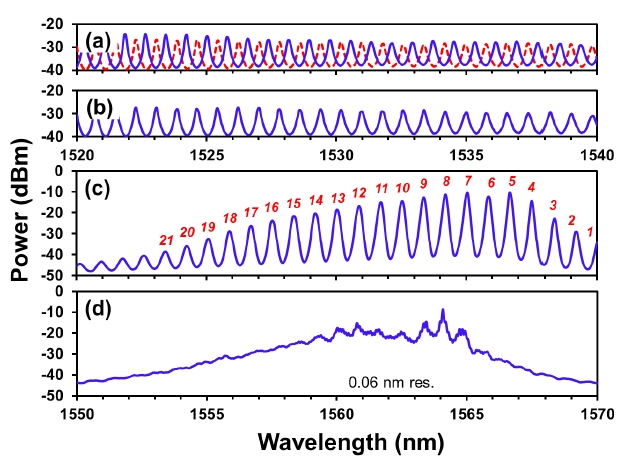
We measured the optical spectra before and after mutual injection to investigate spectral characteristics of the MI F-P LDs. Figure 2(a) and (b) show optical spectra of solitary F-P LD1 and F-P LD2 at bias current of 2.3 Ith, respectively, where Ith is the lasing threshold current. Since internal cavity length of both F-P LDs was 400 μm, the mode spacing was 0.8 nm (100 GHz). The light output from F-P LD was mutually injected through the optical coupler. The polarization of the light outputs was matched by tilting the optical fiber. After mutual injection, we achieved multiwavelength light output as shown in Figure 2(c) and (d) with wavelength detuning of 0.0 nm and -0.4 nm, respectively. It should be noted that the wavelength detuning is defined by wavelength difference between the lasing modes of the F-P LD1 and F-P LD2 (i.e., λF-P LD1-λF-P LD2). Thus, the wavelength detuning of 0.0 nm (-0.4 nm) is wavelength difference between dotted-red (solid- blue) line of Figure 2(a) and solid-blue line of Figure 2(b). The lasing wavelength of the F-P LD1 could be shifted by controlling its temperature, whereas the F-P LD2 was fixed to the room temperature. As the wavelength detuning was
set at 0.0 nm, we could observe not only clear mode features at interval of mode spacing (0.8 nm) but a broad optical envelope compared with those of -0.4 nm wavelength detuning case.
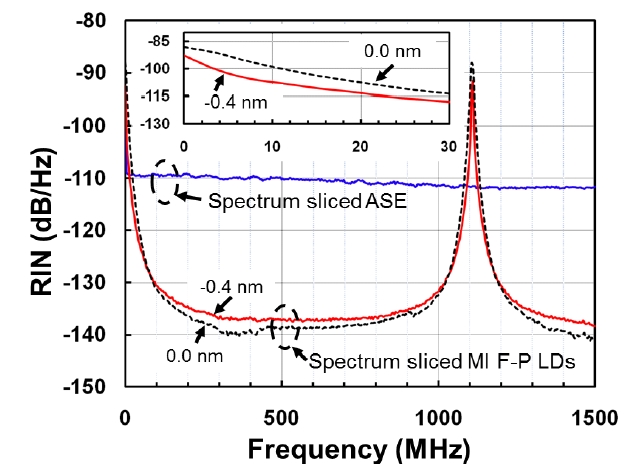
To investigate the noise characteristics of the MI F-P LDs, we measured the RIN spectrum after spectrum slicing by a flattop type AWG with 3-dB bandwidth of 0.64 nm (80 GHz). The RIN measurements were performed by using an electrical spectrum analyzer (ESA) and an avalanche photo detector (APD). As shown in Figure 3, a 1/f noise was observed. In addition, a periodic noise peak was also observed at intervals of 1.1 GHz, which is determined by the length of the external passive cavity (~9 cm) of the MI F-P LDs. It may be noted that it matches with calculated value regarding the refractive index of the fiber (1.5). The RIN between noise peaks was below -138 dB/ Hz compared with the RIN of the spectrum-sliced ASE (-110 dB/Hz). It may be noted that the RIN value of -138 dB/Hz can be close to the RIN value of a DFB LD.
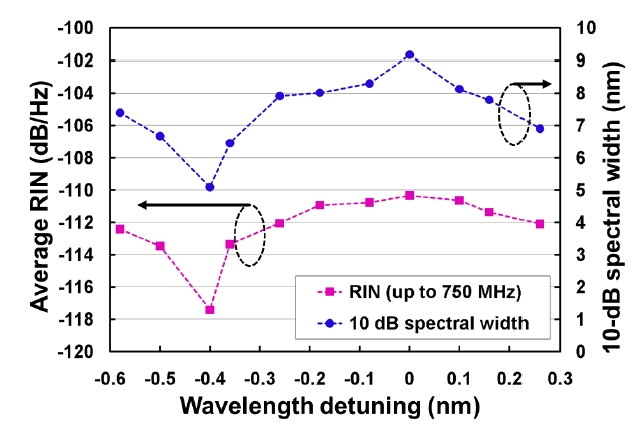
We also measured the average RIN from 50 kHz to 750
MHz and a 10-dB spectral width of the MI F-P LDs output spectrum according to the wavelength detuning as shown in Figure 4. There is a strong correlation between the RIN and 10-dB spectral width. It may be noted that these quantities have periodic features with the mode spacing of the MI F-P LDs. The measured minimum and maximum average RIN were -117.4 and -110.3 dB/Hz at the wavelength detuning of -0.4 nm and 0.0 nm, respectively. As shown in the inset of Figure 3, the difference of the average RIN mainly comes from change of the 1/f noise as a function of the wavelength detuning. Since the 10-dB spectral width has a minimum at -0.4 nm wavelength detuning, the 1/f noise induced by mode partition noise has also a minimum at this wavelength detuning (solid-red line). It may be noted that the RIN of -110 dB/Hz is good enough to transmit 1.25-Gb/s nonreturn -to-zero (NRZ) data [11].
For demonstration of the broadcasting signal transmission by using the MI F-P LDs, we have the experimental set up as shown in Figure 5. The bias current of the F-P LD1 and F-P LD2 was set at 2.3 Ith, respectively. The wavelength detuning was set at 0.0 nm to maximize the usable bandwidth. As mentioned before, at this wavelength detuning case, the measured RIN satisfies the RIN requirement for transmitting the 1.25-Gb/s NRZ data as seen in Figure 4. An output port from the MI F-P LDs passed a polarization controller (PC) to adjust polarization of the MZM. It was then modulated at 1.25-Gb/s NRZ data by the MZM. The pseudorandom bit sequence (PRBS) pattern length was 27-1 which is a simulation of 8B/10B 1.25-Gb/s Ethernet signal [12]. The modulated optical output was amplified by an Erbium-doped fiber amplifier (EDFA) and transmitted through a 20 km single mode fiber (SMF). After spectrum slicing by the AWG, it was received at the optical receiver based on the APD. For the better RIN performance, especially for direct modulation case, we selected the flattop type AWG which has the larger bandwidth compared with that of the Gaussian one. The channel spacing and the 3-dB bandwidth of the flattop type AWG were 0.8 nm (100 GHz) and 0.64 nm (80 GHz), respectively.
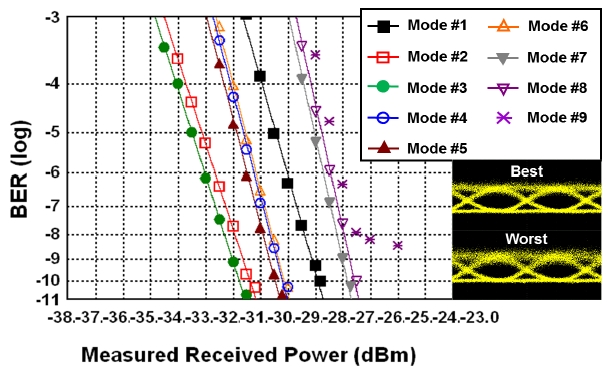
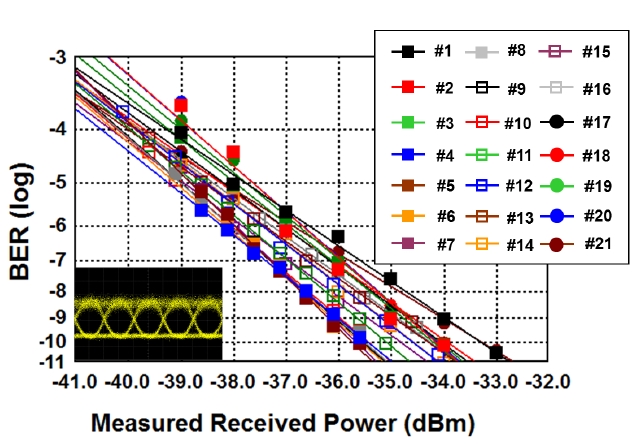
Figure 6 shows the measured BER results according to the various modes which are numbered in Figure 2(c). We
could achieve the error-free BER after 20 km transmission of 21 modes over 18 nm. The inset of Figure 6 also shows the clearly open eye diagram of the best performance (mode #7). The ‘1’ level noise is broader than the ‘0’ level noise because of the 1/f noise. Since there is no signal component between DC and 10 MHz, we can decrease the 1/f noise by using a high pass filter (HPF). For this propose, we utilized the HPF with a cut-off frequency of 3 MHz at the optical receiver.
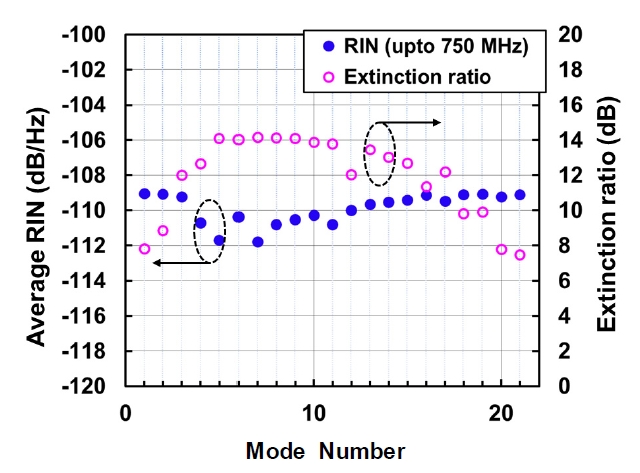
As seen in Figure 6, the maximum sensitivity difference between modes at the BER of 10-10 was about 2.3 dB. To investigate this, we measured the average RIN (50 kHz- 750 MHz) and extinction ratio (ER) according to the different lasing modes as shown in Figure 7. The measured ER was higher than 7.5 dB and the average RIN was less than -109 dB/Hz. The sensitivity difference can be explained by difference of the RIN and the ER. The best sensitivity at mode #7 attributes a high ER and a low RIN (14 dB and -112 dB/Hz, respectively), while the worst sensitivity at mode #21 a low ER and a high RIN (7.5 dB and -109 dB/Hz, respectively). It may be noted that the main source of the sensitivity difference is the difference
of the ER.
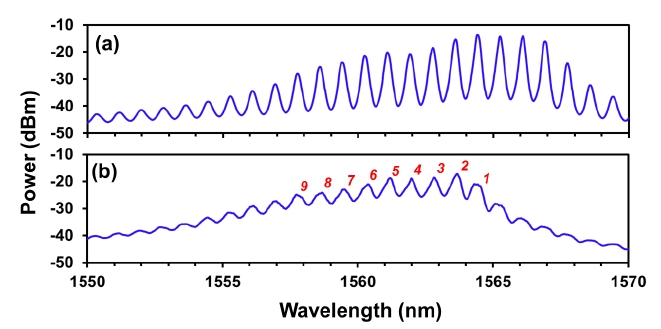
For the cost-effective implementation, we removed the external modulator and modulated the F-P LD1 directly at 1.25-Gb/s NRZ with 27-1 PRBS pattern length as shown in Figure 8. The ‘1’ level current and ‘0’ level current of the F-P LD1 were set at 2.0 Ith and 0.5 Ith, respectively. The bias current of the F-P LD2 was fixed at 2.3 Ith. The measured optical spectra at the measurement point 1 (MP1) are shown in Figure 9(a) and (b) when the wavelength detuning was 0.0 nm and -0.4 nm, respectively. It may be noted that the dependency of the 10-dB envelope width on the detuning is similar to the un-modulated case. However, the spectral width of the individual mode was broadened due to the direct modulation. At the wavelength detuning of -0.4 nm, the observed spectrum shows the smallest undulation due to the mode feature of the F-P LDs.
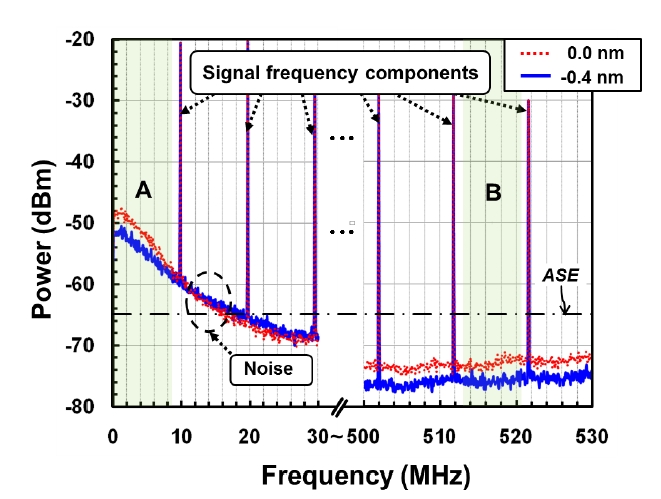
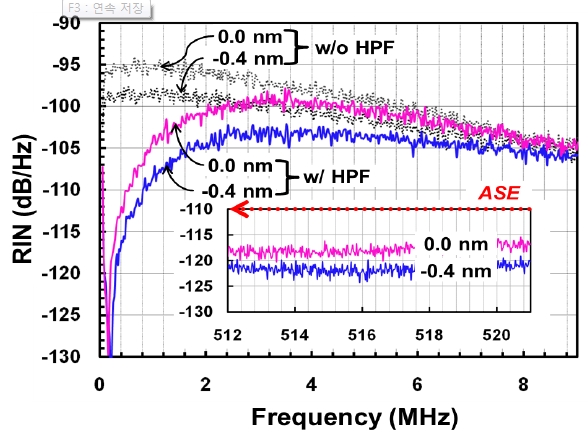
Figure 10 shows the RF power spectra measured at the MP2 in Figure 8. The 1.25-Gb/s NRZ signal components were observed at intervals of 10 MHz. By measuring the intensity noise between signal components, we could analyze the noise characteristics of the MI F-P LDs after the direct modulation. The 1/f noise was observed from 50 kHz to 30 MHz, and the noise in flat-band region was also measured from 500 MHz to 530 MHz. It may be noted that this measured frequency region is only a small portion of the whole flat-band region. As the wavelength detuning was changed from 0.0 nm (dotted-red) to -0.4 nm (solidblue), both 1/f noise and flat-band noise were decreased. This noise feature was very similar to un-modulation case. More detailed view of the RIN for both cases is shown in Figure 11. The average RIN in ‘A’ region in Figure 10 was -98 dB/Hz (detuning of 0.0 nm) and -101 dB/Hz (detuning of -0.4 nm). The average RIN in ‘B’ region in Figure 10 was -117 dB/Hz (detuning of 0.0 nm) and -121 dB/Hz (detuning of -0.4 nm).
By comparing the Figure 11 with Figure 3 that is for the un-modulated case, we could find a change of the RIN after direct modulation. In the ‘A’ region, RIN was improved by 2 dB for -0.4 nm detuning case compared with that of un-modulation case (-99 dB/Hz). However, there
exists very large RIN degradation of 16 dB in the ‘B’ region compared with that of un-modulation case (-137.2 dB/Hz). As we introduced the electrical HPF, the reduced minimum average RIN reduced from -101 dB/Hz to -104.8 dB/Hz at the wavelength detuning of -0.4 nm.
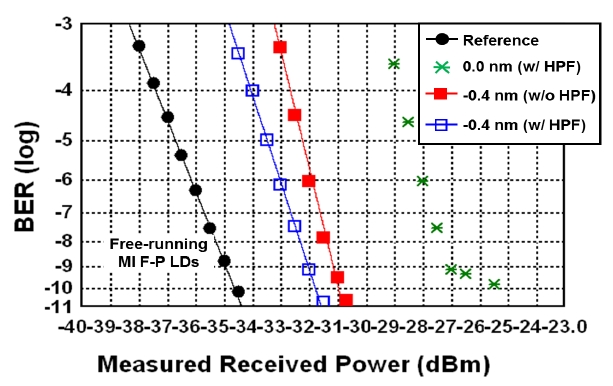
To investigate transmission performance, we also measured BER curves at the ONU as shown in Figure 12. Even though the HPF was introduced, we could observe an error floor at the BER of 10-10 when the wavelength detuning was set at 0.0 nm. However, the error free transmission was achieved at -0.4 nm wavelength detuning. By using the HPF, the sensitivity was improved by 1 dB at the 10-10 BER. We also measured BER curves for different modes numbered in Figure 9(b) at the detuning of -0.4 nm. As shown in Figure 13, we could achieve the error-free transmission over the 20 km SMF for 8 modes. As the mode is departed from the envelope peak, the BER performance is degraded. The sensitivity difference between the mode #3 (best case) and mode #8 (worst case) was about 4 dB. As seen in insets of Figure 13, the measured eye diagrams also show that the ‘1’ level noise of mode #8 is broader than that of the mode #3.
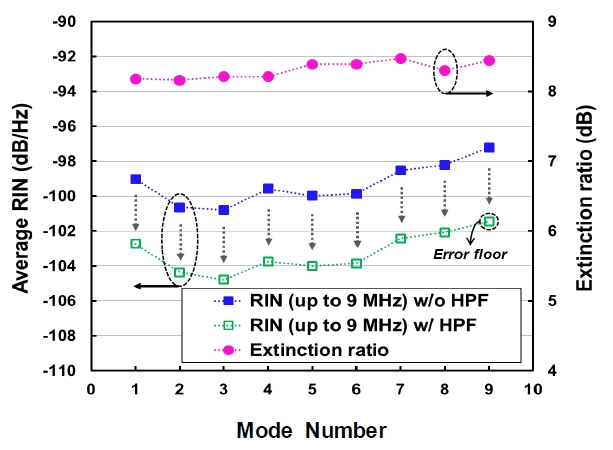
To investigate the origin of the sensitivity difference, we measured the average RIN and the ER as shown in
Figure 14. The ER of each mode was almost constant of 8.3 dB whereas the average RIN is increased as the mode is departed from the peak. The difference of the average RIN between mode #3 (best case) and mode #8 (worst case) was 2.7 dB. Thus the origin of the sensitivity difference is the increase of the RIN. This feature can be compared with the external modulation case.
In conclusion, we demonstrated 1.25-Gb/s broadcast signal transmission over 20 km of SMF by using a single MI F-P LDs at channel spacing of 100 GHz. The error free transmission was achieved over 16.8 nm (# of channel: 21) and 6.4 nm (# of channel: 8) with external modulation and direct modulation, respectively. Since the electrical power spectrum of 8B/10B in Ethernet signal is similar with the NRZ signal of 27-1 PRBS, it is possible to accommodate 1.25-Gb/s Ethernet data as a broadcast signal. It is clear that, the number of usable modes can be increased by employing an FEC.
The usable bandwidth without an EDFA can be increased to support 32 users by optimizing the MI F-P LDs and/or by using an F-P LD with quantum dot active region that provides a very broad lasing spectrum with an inhomogeneous broadening feature [13]. Further works on the high-speed broadcast signal (over 10-Gb/s) transmission by using the MI F-P LDs is underway. If we reduce the length of the external passive cavity, it may be possible to transmit 10-Gb/s/channel broadcast data to support the full bandwidth of high definition (HD) or ultra HD videos, since the periodic noise peak of the MI F-P LDs is originated from its external passive cavity length. Furthermore, by using the different modulation format such as Manchester data format which has a negligible amount of signal components in low frequency region, we could mitigate low frequency noise from the MI F-P LDs.