검색 전체 메뉴
PDF
맨 위로
OA 학술지
Statistical Analysis of 3D Volume of Red Blood Cells with Different Shapes via Digital Holographic Microscopy
  • 비영리 CC BY-NC
  • 비영리 CC BY-NC
ABSTRACT
Statistical Analysis of 3D Volume of Red Blood Cells with Different Shapes via Digital Holographic Microscopy
KEYWORD
Three-dimensional image processing , Digital holographic microscopy , Red blood cell
  • I. INTRODUCTION

    Three-dimensional (3D) holographic imaging systems [1-10] have been investigated for achieving reliable and non-invasive recognition and for identifying biological micro /nano organisms [11-14]. The 3D holographic imaging system for biological microorganism analysis has a large number of biological applications such as medical diagnosis, medical therapeutics, bio-medical imaging, defense, and security.

    Red blood cells (RBCs) have been extensively studied for bio-medical applications. Recent studies on RBCs have suggested that transfusions of blood having long storage periods or abnormal shapes increase risk after transfusion [15,16] since long storage and abnormal shapes progressively change the RBCs’ structure and function, which may reduce RBC function and viability [15]. Consequently, the development of free labelling techniques that allow rapid classification of older versus newer red blood cells is very useful. In general, most traditional methods of studying biological cells such as RBC require biochemical processing, which may be time-consuming and labor- intensive. Furthermore, the recognition techniques based on two-dimensional imaging may not be effective because RBCs are usually semitransparent. Thus, the automatic 3D classification of RBCs can be very useful. Otherwise, the RBCs would be investigated in very low contrast or invisible under conventional microscopy.

    Recently developed techniques in 3D holographic microscopy have provided a high resolution and noninvasive examination to identify biological cells [11-14]. In this paper, we propose an automated algorithm to quantitatively measure a 3D volume of RBC using digital holographic microscopy for the purpose of identifying various types of RBCs. The proposed technique for quantitative analysis of a 3D volume of RBCs includes 3D sensing, visualization, segmentation, and statistical methods. Off-axis digital holographic microscopy [17-20] is applied to three-dimensionally sense the RBCs [14]. Their original phase images are restored by using special numerical algorithms. As part of pre-processing RBCs 3D volume analysis, it is important to remove the background parts and select regions of interest in the restored RBCs’ phase image [14]. Here, the watershed segmentation algorithm [21] is applied to the reconstructed phase image to obtain clear targets in the phase image with many single RBCs. After segmenting the reconstructed RBC’ s phase image, all single RBCs are extracted and the 3D volume of each single RBC is then measured via the surface area and the phase values of the corresponding RBC. In order to show the feasibility of the proposed method, two typical shapes of RBCs, i.e., stomatocyte/discocyte, are tested via experiments. The statistical distributions of 3D volume for each class of RBC [stomatocyte or discocyte] are generated by using our algorithm. Statistical hypothesis testing [22,23] is conducted to investigate the differences between the statistical distributions of 3D volume for the two typical shapes of RBCs. The experiment results illustrate that the proposed method based on digital holographic microscopy can quantitatively analyze the 3D volumes of various types of RBCs.

    II. AUTOMATIC PROCEDURES FOR RBCs 3D VOLUME MEASUREMENT

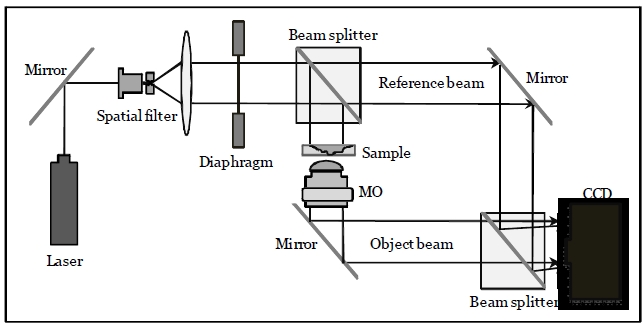
    The off-axis digital holographic imaging system [24,25] is employed for 3D sensing of RBCs, which has been described in [20]. As shown in Fig. 1, the off-axis digital holograms of RBCs are acquired via a CCD camera. In this configuration, a laser beam with a wavelength of 682 nm is divided into reference and object beams. The object beam is diffracted by the RBC specimens. A 40× / 0.75NA microscope objective (MO) magnifies the diffracted object beam. The interference patterns between the diffracted object

    and reference beams in the off-axis geometry are recorded by the CCD camera. The numerical algorithms described in [17,18] reconstruct the RBCs’ wavefront or phase image from the off-axis digital hologram.

    In order to measure the RBC’ s 3D volume in the reconstructed phase image, the watershed segmentation algorithm [21] is applied to the phase image in order to remove background parts and obtain clear targets in the phase image with many single RBCs [14]. Every single RBC in the phase image is extracted individually. Then, the projected surface area and phase values are automatically calculated for every single RBC, which are utilized to calculate the 3D volumes of the corresponding RBCs. The 3D volume measurement for a single RBC, which is related with its 3D shape, can be given by:
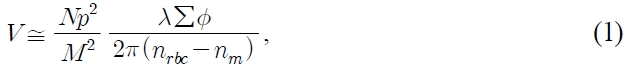
    image

    where N is the total number of pixels within a single RBC, p denotes the pixel size, φ is the phase value of each pixel within single RBC, and M is the magnification of digital holographic microscopy. In our experiments, the RBC refractive index, nrbc, is 1.396 and the index of refraction of the HEPA medium, nm, is 1.3334, respectively. In order to investigate whether or not there is a statistically significant distinction between 3D volumes of different shapes of RBCs, the statistical distribution for the 3D volume of RBCs is generated by calculating Eq. (1) with every single RBC in the segmented phase image. Finally, parametric statistical hypothesis testing is conducted for a statistical decision.

    III. EXPERIMENTAL RESULTS

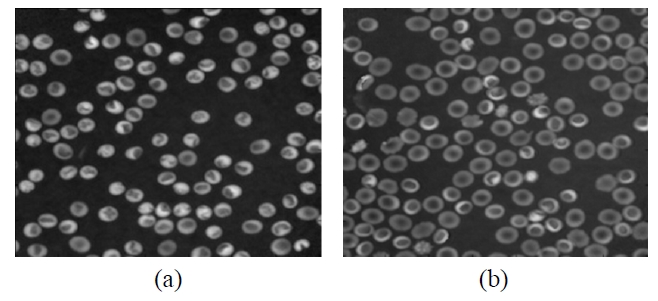
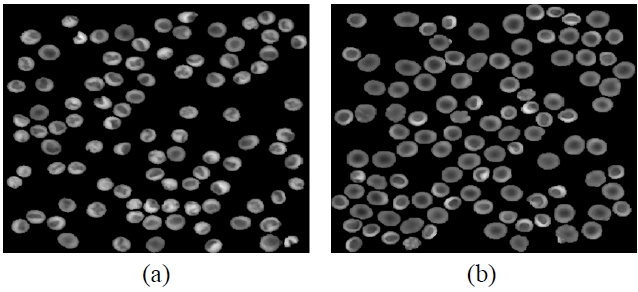
    In our experiments, the off-axis digital holograms of two different shapes of RBCs [class 1: RBCs with a stomatocyte shape and class 2: RBCs with a discocyte shape] were recorded via a CCD camera as shown in Fig. 1 [26]. The resolution of the CCD is 1024× 1024 and the pixel size is 10 μ m. The phase images of RBCs with different shapes were reconstructed from their own off-axis digital holograms using numerical algorithms. Figure 2 shows the phase images of two typical shapes of RBCs obtained via off-axis digital holographic microscopy. These phase images of the two typical shapes of RBCs [stomatocyte/ discocyte] were used to exhibit the difference between the RBCs 3D volume and their shapes. For the purpose of RBCs 3D volume analysis, a watershed segmentation algorithm was applied to the RBCs phase images. All single RBCs in the phase image were obtained via the segmentation algorithm. Figure 3 shows the segmented phase images of class 1 and class 2 RBCs, respectively.

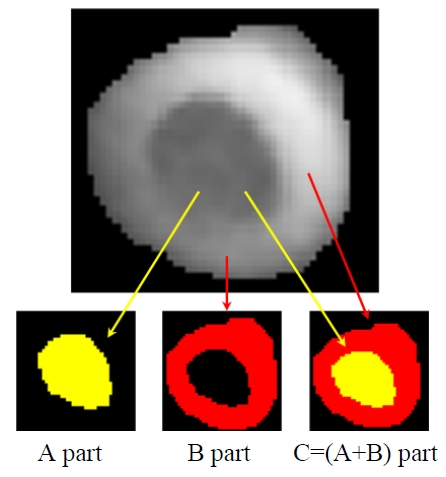
    Since most single RBCs appear to have two kinds of

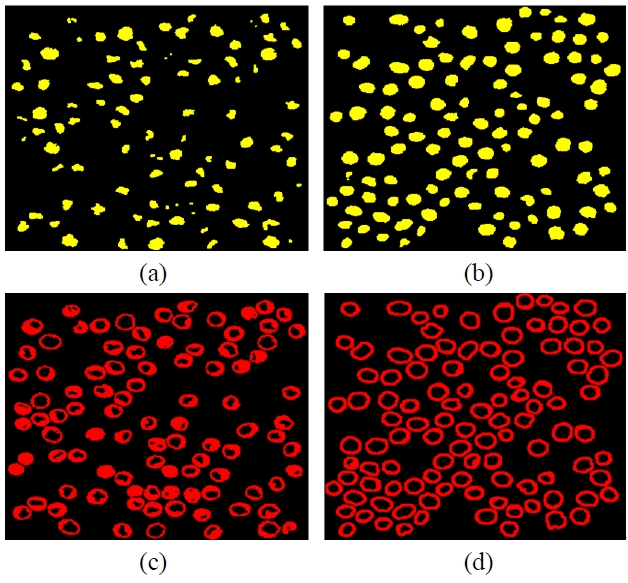
    regions as shown in Fig. 4, it is better to respectively separate the different parts to achieve a comprehensive and detailed analysis of the RBCs 3D structure. Here, different regions of RBCs are defined in Fig. 4. The C region includes A and B parts, where the A part apparently has relative lower phase values than those of B part. Most of the A part is on the interior of the RBC, while the B part forms the boundary of the RBC.

    In order to obtain the different regions in the RBCs, we first use the marker-controlled watershed algorithm to obtain the C part. Then, the C part is taken as a source

    image, and we can obtain the A part by applying the markercontrolled watershed. Finally, the B part can be obtained by subtracting the A part from the C part. Figure 5 shows the segmented phase images of the A and the B parts in the reference and input RBCs, respectively.

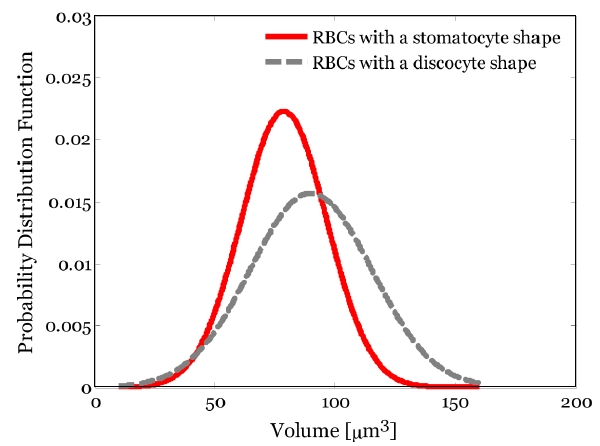
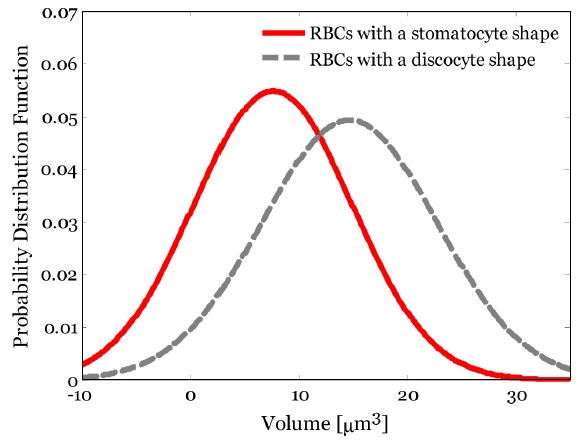
    To conduct a quantitative investigation of the 3D volumes of RBCs with two different shapes, the 3D volumes in the A, B, and C parts [see Fig. 4] of single RBC are calculated using Eq. (1), respectively. To conduct a statistical analysis of RBCs volume, the mean and standard deviation of the volume of the A part in RBCs with a stomatocyte shape are computed to be 7.6 μ m3 and 7.2 μ m3, while these values in RBCs with discocyte shape are 14.6 μ m3 and 8.0 μ m3, respectively. Figure 6 shows the statistical distributions of RBC volume of the A part in the two different shapes of RBCs.

    Figure 7 shows the statistical distributions of 3D volume of the B part in the two different shapes of RBCs. The mean and standard deviation of the volume of the B part in RBCs with a stomatocyte shape are computed to be 41.5 μ m3 and 14.7 μ m3, while these values in RBCs with a discocyte shape are 32.7 μ m3 and 7.3 μ m3, respectively.

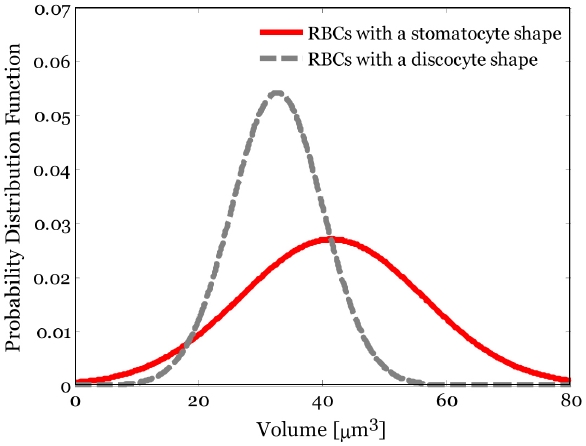
    Figure 8 shows the statistical distributions of 3D volume of the C part in the two different shapes of RBCs. The mean and standard deviation of the volume of the C part in RBCs with a stomatocyte shape are computed to be 78.7 μ m3 and 17.9 μ m3, respectively, while these values in RBCs with discocyte shape are 90.0 μ m3 and 25.3 μ m3, respectively. It is noted that the average volume in an RBC

    with discocyte shape is larger than that in stomatocyte shape. This may be due to the differences of projected surface area and 3D shape of RBC.

    In order to statistically evaluate there is a significant 3D volume distinction in RBC populations that differ in shape, we define the 3D volumes in the A, B, and C parts of each single RBC as random variables X1, X2, and X3. The statistical distribution of the difference between two location parameters from the two different classes [c1 and c2] of RBC populations [c1: RBCs with a stomatocyte shape, c2: RBCs with a discocyte shape] is calculated. It is assumed as shown in Fig 6, 7, and 8 that the two RBC populations of each random variable [A, B or C part] follow normal distributions Nc1 (μ c1 , σ 2 c1) and Nc2 (μ c2 , σ 2 c2), respectively.

    In order to compare the dispersion parameters between the two statistical normal distributions [c1: stomatocyte shape, c2: discocyte shape], it is assumed that all four statistical parameters are unknown and θ = (μ c1 , μ c2 , σ 2 c1 , σ 2 c2 ). The ratio of the dispersions of two independent normal populations can be represented with a null hypothesis [H0: σ 2 c1=σ 2 c2=σ 2] as follows [22]:

    image

    where the F distribution has nc1 - 1 and nc2 -1 degrees of freedom, nc1 and nc2 are the sample sizes of the c1 class and c2 one, respectively. V [?] is a sample variance of random variable Xi. The subscript i can be 1, 2, or 3.

    To answer and discuss this important question on whether or not there is a distinction in 3D volume of A, B, or C part between the two different shapes of RBCs [c1: stomatocyte shape, c2: discocyte shape], the F-test [null hypothesis: H0(σ 2 c1=σ 2 c2=σ 2)] for each random variable X1, X2, or X3 was first conducted on the basis of a two-tailed test with a specific level of significance. Statistical p-value was calculated by using the table of Fisher F distribution in [22] for the statistical decision. It is noted that the computed statistical p-values for the random variables X1, X2, and X3 are 0.0608, 2.66× 10⁻¹⁰, and 4.34× 10⁻⁴, respectively, which are the probability that the observed test statistic of Eq. (2) would occur in the same population [3D volume] in parts A, B, and C of RBC. From these experimental results, it would be concluded that the variability of the 3D volume in the A part of class 1 is not different from that of B since we can accept the null hypothesis, H0(σ 2 c1=σ 2 c2=σ 2), at the 0.05 level of significance [statistical p-value of the F-test over the random variables X1 is 0.0608]. On the other hand, we may conclude that there is a significant difference in the variability of the 3D volumes in the B and C parts since both p-values of the F-testover the random variables X2, X3 are much lower than 0.05.

    The difference of location parameters of the two independent normal populations for the null hypothesis [H0: μ c1=μ c2=μ )] can be represented as follows [22]:

    image

    where the variable T has student t distribution with nc1 + nc2 - 2 degrees of freedom. nc1 and nc2 are the sample sizes of the c1 class and c2 one, respectively. E [?] is a sample mean of random variable Xi. The subscript i can be 1, 2, or 3.

    image

    [Xi (c1)] and

    image

    [Xi (c2)] are the unbiased estimates of σ 2 c1 and σ 2 c2, respectively.

    The statistical decision analysis on the equality of the location parameter between the statistical distributions of the two different shapes of RBCs for each random variable X1, X2, or X3, was performed using the statistical hypothesis testing [t-test]. Finally, the statistical p-value was calculated for the statistical decision on whether or not there is significant difference between the location parameters of the two statistical distributions. The statistical p-value was obtained by using the table of Student’s t distribution in reference [22]. It is noted that the computed statistical p-values for the random variables X1, X2, and X3 are 3.36× 10⁻⁸, 2.22× 10⁻⁶, and 7.29× 10⁻⁵, respectively, which are the probability that the observed test statistic of Eq. (3) would occur in the same population [3D volume] in parts A, B, and C of RBC. Therefore, we may conclude from these experimental results that the distinction in the 3D volumes of the A, B, or C parts in RBC [see Fig. 4] is probably significant because we can reject the null hypothesis, H0: μ c1=μ c2=μ at the 0.05 level of significance.

    These statistical experiments demonstrate that there is a considerable distinction between the RBCs 3D volumes and their shapes. Accordingly, we believe that the proposed method has potential for achieving statistical quantifications of the 3D volume in various types of RBCs. In addition, it can be a promising tool for investigating any modifications or dynamics of 3D volume in RBC by monitoring RBCs.

    IV. CONCLUSION

    In this paper, we have proposed an automated method for 3D volume measurement of red blood cells (RBCs) using off-axis digital holographic microscopy. The off-axis digital holographic microscopy has recorded hologram patterns of RBCs. The RBCs phase images have been reconstructed from their holograms by using special numerical algorithms. Segmentation algorithms have been applied to the RBCs phase image in order to remove the unnecessary background and obtain clear targets in the reconstructed phase image. The 3D volumes of every single RBC in the segmented phase image have been calculated. Statistical hypothesis testing has been conducted in order to investigate whether or not there is a significant difference between the statistical distributions of the 3D volume of two different shapes of RBCs, i.e., stomatocyte and discocyte. The experimental results exhibit that there is a considerable distinction between the RBCs 3D volumes and their shapes. Therefore, we believe that the proposed method provides valuable insight into the 3D volume in RBCs that differ in shape and can be extended to the classification of various types of RBCs.

참고문헌
  • 1. Yamaguchi I., Zhang T. (1997) “Phase-shifting digital holography” [Opt. Lett.] Vol.22 P.1268-1270 google
  • 2. Nomura T., Murata S., Nitanai E., Numata T. (2006) “Phaseshifting digital holography with a phase difference between orthogonal polarizations” [Appl. Opt.] Vol.45 P.4873-4877 google
  • 3. Frauel Y., Naughton T., Matoba O., Tahajuerce E., Javidi B. (2006) “Three dimensional imaging and display using computational holographic imaging” [Proc. IEEE] Vol.94 P.636-654 google
  • 4. Zhang Y., Pedrini G., Osten W., Tiziani H. J. (2004) “Reconstruction of in-line digital holograms from two intensity measurements” [Opt. Lett.] Vol.29 P.1787-1789 google
  • 5. Ferraro P., De Nicola S., Coppola G., Finizio A., Alfieri D., Pierattini G. (2004) “Controlling image size as a function of distance and wavelength in Fresnel-transform reconstruction of digital holograms” [Opt. Lett.] Vol.29 P.854-856 google
  • 6. Lee J., Moon I., Liu H., Yi F. (2011) “3D holographic image recognition by using graphic processing unit” [J. Opt. Soc. Korea] Vol.15 P.264-271 google
  • 7. Tajahuerce E., Matoba O., Javidi B. (2001) “Shift-invariant three dimensional object recognition by means of digital holography” [Appl. Opt.] Vol.40 P.3877-3886 google
  • 8. Martinez L., Javidi B. (2008) “Synthetic aperture singleexposure on-axis digital holography” [Opt. Express] Vol.16 P.161-169 google
  • 9. Kim T., Kim Y. (2010) “Extraction of a distance parameter in optical scanning holography using axis transformation” [J. Opt. Soc. Korea] Vol.14 P.104-108 google
  • 10. Abdelsalam D., Baek B., Kim D. (2011) “Precise test sieves calibration method based on off-axis digital holography” [J. Opt. Soc. Korea] Vol.15 P.146-151 google
  • 11. Javidi B., Moon I., Yeom S., Carapezza E. (2005) “Threedimensional imaging and recognition of microorganism using single-exposure on-line (SEOL) digital holography” [Opt. Express] Vol.13 P.4492-4506 google
  • 12. Moon I., Javidi B. (2008) “3D visualization and identification of biological microorganisms using partially temporal incoherent light in-line computational holographic imaging” [IEEE Trans. Medical Imaging] Vol.27 P.1782-1790 google
  • 13. Moon I., Daneshpanah M., Javidi B., Stern A. (2009) “Automated three dimensional identification and tracking of micro/ nano biological organisms by computational holographic microscopy” [Proc. IEEE] Vol.97 P.990-1010 google
  • 14. Moon I., Javidi B., Yi F., Boss D., Marquet P. (2012) “Automated statistical quantification of three-dimensional morphology and mean corpuscular hemoglobin of multiple red blood cells” [Opt. Express] Vol.20 P.10295-10309 google
  • 15. Laurie J., Wyncoll D., Harrison C. (2010) “New versus old blood-the debate continues” [Critical Care] Vol.14 P.130 google
  • 16. Koch C., Li L., Sessler D., Figueroa P., Hoeltge G., Mihaljevic T., Blackstone E. (2008) “Duration of red-cell storage and complications after cardiac surgery” [New England Journal of Medicine] Vol.20 P.1229-1239 google
  • 17. Cuche E., Marquet P., Depeursinge C. (1999) “Simultaneous amplitude and quantitative phase contrast microscopy by numerical reconstruction of Fresnel off-axis holograms” [Appl. Opt.] Vol.38 P.6994-7001 google
  • 18. Colomb T., Cuche E., Charriere F, Kuhn J., Aspert N., Marquet P., Depeursinge C. (2006) “Automatic procedure for aberration compensation in digital holographic microscopy and application to specimen shape compensation” [Appl. Opt.] Vol.45 P.851-863 google
  • 19. Dubois F., Joannes L., Legros J.-C. (1999) “Improved threedimensional imaging with digital holography microscope using a partial spatial coherent source” [Appl. Opt.] Vol.38 P.7085-7094 google
  • 20. Marquet P., Rappaz B., Cuche E., Colomb T., Emery Y., Depeursinge C., Magistretti, P. (2005) “Digital holography microscopy: a non-invasive quantitative contrast imaging technique allowing visualization of living cells” [Opt. Lett.] Vol.30 P.468-470 google
  • 21. Gonzalez R., Woods R. 2002 Digital Imaging Processing google
  • 22. Mukhopadhyay N. 2000 Probability and Statistical Inference google
  • 23. Rencher C. 1998 Multivariate Statistical Inference and Application google
  • 24. Goodman J., Lawrence R. (1967) “Digital image formation from electronically detected holograms” [Appl. Phys. Lett.] Vol.11 P.77-79 google
  • 25. Cuche E., Marquet P., Depeursinge C. (2000) “Spatial filtering for zero-order and twin-image elimination in digital off-axis holography” [Appl. Opt.] Vol.39 P.4070-4075 google
  • 26. Liu R., Dey D., Boss D., Marquet, P., Javidi B. (2011) “Recognition and classification of red blood cells using digital holographic microscopy and data clustering with discriminant analysis” [J. Opt. Soc. Am. A] Vol.28 P.1204-1204 google
OAK XML 통계
이미지 / 테이블
  • [ FIG. 1. ]  Experimental setup for recording the off-axis digital hologram of red blood cells.
    Experimental setup for recording the off-axis digital hologram of red blood cells.
  • [ FIG. 2. ]  The reconstructed RBCs phase images. (a) Class 1: RBCs having a stomatocyte shape (b) Class 2: RBCs having a discocyte shape.
    The reconstructed RBCs phase images. (a) Class 1: RBCs having a stomatocyte shape (b) Class 2: RBCs having a discocyte shape.
  • [ FIG. 3. ]  The segmented RBCs phase images. (a) Class 1: RBCs having a stomatocyte shape (b) Class 2: RBCs having a discocyte shape.
    The segmented RBCs phase images. (a) Class 1: RBCs having a stomatocyte shape (b) Class 2: RBCs having a discocyte shape.
  • [ FIG. 4. ]  A schematic diagram for three different regions in red blood cells (RBCs).
    A schematic diagram for three different regions in red blood cells (RBCs).
  • [ FIG. 5. ]  The segmented phase images of the A and B regions [see Fig. 4] in the RBCs. (a) Segmented phase image of the A part in the class 1 RBCs having a a stomatocyte shape. (b) Segmented phase image of the A part in the class 2 RBCs having a discocyte shape. (c) Segmented phase image of the B part in the class 1 RBCs having a stomatocyte shape. (d) Segmented phase image of the B part in the class 2 RBCs having a discocyte shape.
    The segmented phase images of the A and B regions [see Fig. 4] in the RBCs. (a) Segmented phase image of the A part in the class 1 RBCs having a a stomatocyte shape. (b) Segmented phase image of the A part in the class 2 RBCs having a discocyte shape. (c) Segmented phase image of the B part in the class 1 RBCs having a stomatocyte shape. (d) Segmented phase image of the B part in the class 2 RBCs having a discocyte shape.
  • [ FIG. 6. ]  Statistical distributions of the 3D volume in A part for two typical shapes of RBCs. The solid line is RBCs having a stomatocyte shape. The dotted line is RBCs having a discocyte shape.
    Statistical distributions of the 3D volume in A part for two typical shapes of RBCs. The solid line is RBCs having a stomatocyte shape. The dotted line is RBCs having a discocyte shape.
  • [ FIG. 7. ]  Statistical distributions of the 3D volume in B part for two typical shapes of RBCs. The solid line is RBCs having a stomatocyte shape. The dotted line is RBCs having a discocyte shape.
    Statistical distributions of the 3D volume in B part for two typical shapes of RBCs. The solid line is RBCs having a stomatocyte shape. The dotted line is RBCs having a discocyte shape.
  • [ FIG. 8. ]  Statistical distributions of the 3D volume in C part for two typical shapes of RBCs. The solid line is RBCs having a stomatocyte shape. The dotted line is RBCs having a discocyte shape.
    Statistical distributions of the 3D volume in C part for two typical shapes of RBCs. The solid line is RBCs having a stomatocyte shape. The dotted line is RBCs having a discocyte shape.
(우)06579 서울시 서초구 반포대로 201(반포동)
Tel. 02-537-6389 | Fax. 02-590-0571 | 문의 : oak2014@korea.kr
Copyright(c) National Library of Korea. All rights reserved.