Developing accurate active remote sensors for global wind measurements has long been a high priority need for climate studies, improving current meteorological modeling and weather prediction and other dynamic processes [1-4]. A Mie Doppler wind LIDAR was already successfully developed at Anhui Institute of Optics and Fine Mechanics, CAS, in 2006. This aerosol-based wind LIDAR can be used only for wind measurement in the low troposphere where the aerosol density is thick and Mie backscatter is strong [5-7]. For the high altitude where the aerosol concentration is extremely thin [8], this kind of wind LIDAR is not valid. Fortunately, atmospheric molecules are a dependable and reasonably uniform source on a global basis. For the purpose of wind measurement at high altitude, such as the low stratosphere, a Doppler wind LIDAR based on Rayleigh backscatter by atmospheric molecules is being built in China.
II. WIND MEASUREMENT PRINCIPLE
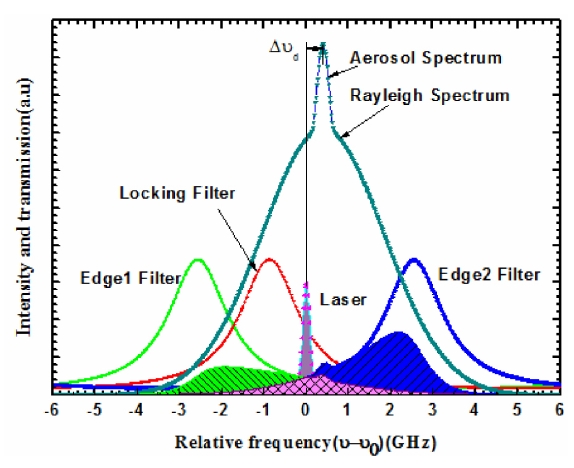
The frequency discriminator for Doppler shift detection in the LIDAR system is a triple channel Fabry-Perot etalon with two edge channels located in the wings of the broadened molecular backscattered spectrum to determine the Doppler shift, as shown in Fig. 1. The locking channel of the etalon is used to measure the outgoing laser frequency and locks the etalon cavity to the laser frequency for a high accuracy wind measurement. The frequency of transmitted laser will be located at the cross point of the two transmission curves corresponding to the two edge channels. The atmospheric molecular backscattered signal received carries a frequency shift from the outgoing laser. Therefore there will be a difference in the relative intensities from the outgoing laser after the backscattered signal passes the two edge channel etalon. The hatched areas in Fig. 1 stand for the received signal relative intensities that are the convolutions of the edge functions and the backscattered signal spectra. The blue area is greater than the green part, indicating a laser
Doppler frequency shift in the received signal, reducing one edge channel of the etalon received signal intensity and increasing the other. So the Doppler shift frequency
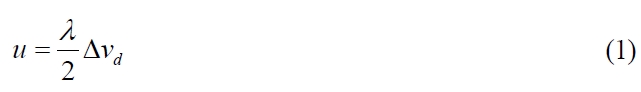
Where λ is the emitted laser frequency,
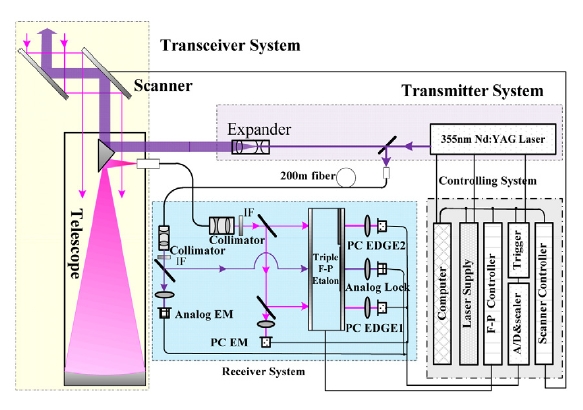
The development of the mobile Rayleigh Doppler wind LIDAR for wind measurement is based on the Rayleigh backscatter. By utilizing the molecular backscatter, it could obtain the wind profile up to the stratosphere. The details of the LIDAR system configuration have been described elsewhere [9-11] and will be briefly reviewed here. The system consists of four major modules, which are the laser transmitter, the scanning telescope (transceiver), the receivers and the controlling system, as shown in Fig. 2. All the modules are fixed on a truck. The laser is an injection seeded, flashlamp pumped Nd:YAG laser which produces an output laser beam at 354.7 nm with a repetition rate of 30 Hz. The maximum laser pulse energy is typically in the range of 300~400 mJ at 354.7 nm for the Rayleigh Doppler wind measurements. A 45 cm aperture scanner is mounted on the platform of the truck to allow access to the atmosphere. This matching azimuth-over-elevation scanner can provide full hemispherical pointing. Most of the light from the transmitter is expanded by a 10 X expander to compress the beam divergence, and then transmitted to the atmosphere by the two-dimensional scanner. Then the backscattered signal that carries Doppler-shift information is collected by
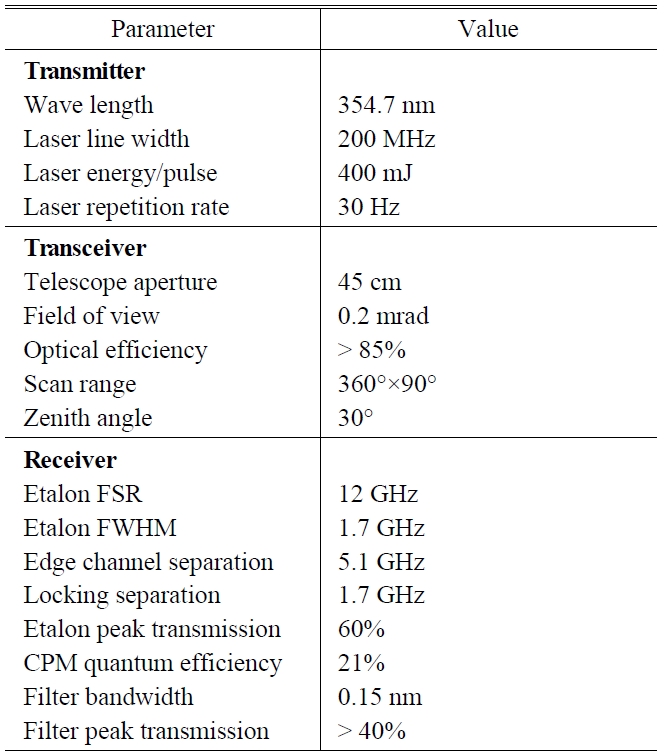
[TABLE 1.] Rayleigh Doppler LIDAR parameters

Rayleigh Doppler LIDAR parameters
telescope and then it is coupled into 200 μm diameter multimode fiber from the telescope to the receiver. Before that, a very small fraction of the outgoing laser is coupled directly into the receiver through a 100 μm diameter multimode fiber, and used as the reference signal to determine its frequency and to lock the etalon to the laser frequency.
In the receiver, the reference light and the backscattered light are collimated, and then pass through interference filters (IF) with the bandwidth of 0.15 nm @ 355 nm. Then, the backscattered light is split equally into two edge channels. 23% of the reference light and 6% of the backscattered light are used monitor the signal intensities. The 77% reference light illuminating the locking channel of the triple Fabry-Perot etalon is used to measure the outgoing laser frequency relative to the etalon. The Doppler shift information is retrieved from the transmission changes of the backscattered signal on the two edge channels. The two reference light channels are strong enough to be detected by PMT detectors in analog mode. While the backscattered light channels are detected in photon counting mode using photomultipliers. The laser operation, FPI spacing parallelism, data collection, and X-Y scanner orientation are controlled by an industrial computer. The system parameters are summarized in Table 1.
IV. INTERCOMPARSION EXPERIMENT AND WIND MEASUREMENT
The mobile Rayleigh Doppler wind LIDAR system began wind measurement in Dec. 2009. A validation experiment was carried out at Urumqi, Xin Jiang province by a field observation mission. The wind velocity and direction derived from the wind LIDAR are compared with the data obtained from the rawinsonde in Aug. 2010.
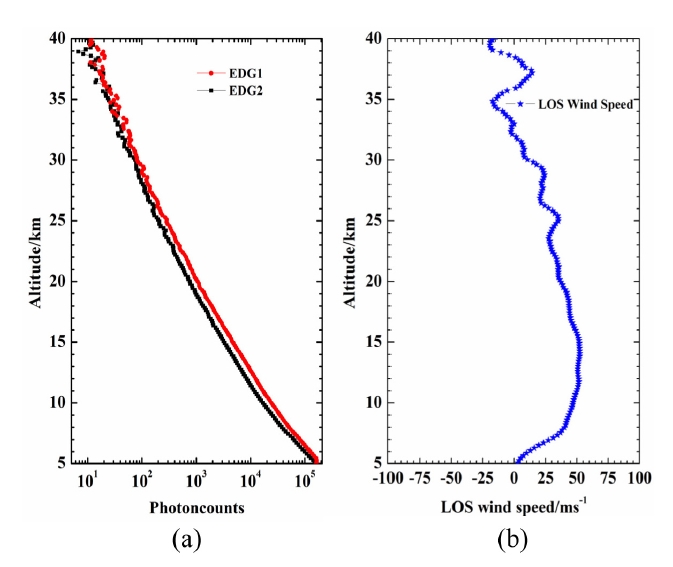
An example of signals from the two edge channels with photon counting mode are shown in Fig. 3. The integration time for these signals is 15 min (26400 shots) and the data are binned with range resolution of 210 m. This data was obtained during the night of Aug. 12, 2010. The laser pulse energy for the measurement was 300 mJ. The atmospheric back-scattering ratio is taken into the inversion algorithm of line of sight wind speed (LOS) to minimize the aerosol effect in the lower altitude [12]. In Fig. 3 (a) the intensities corresponding to the two edge channel signals are almost equal between 25 km and 35 km according to the weak LOS wind speed. However, there is an obvious difference between 7 km and 25 km, with a peak at 15
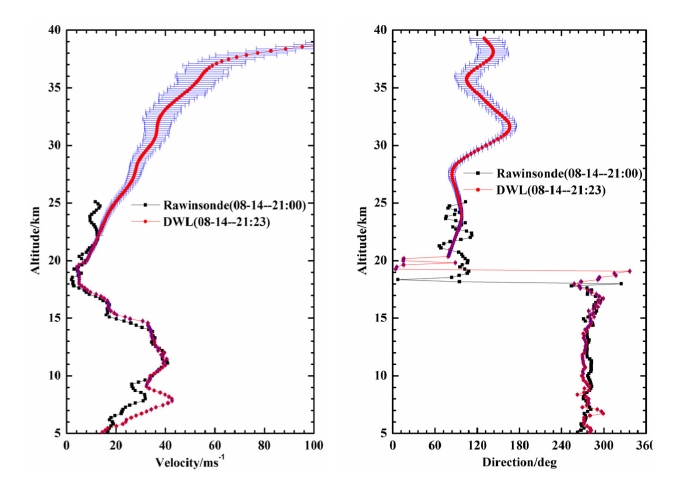
km due to a large line-of-sight speed as shown Fig. 3 (b), in which the LOS velocity increases along the altitude from 5 km to 14 km with a peaking velocity of 52 m/s at 14 km. The horizontal wind velocity and direction can be obtained through vector computing from four line-of-sight wind velocities with an orientation azimuth interval of 90 degrees. The intercomparision experiment with rawinsonde was carried out on Aug. 14, 2010, as shown in Fig. 4. The results show a good agreement. A strong jet with peak horizontal wind speed of around 45 m/s is clearly observed at 8km for both instruments.
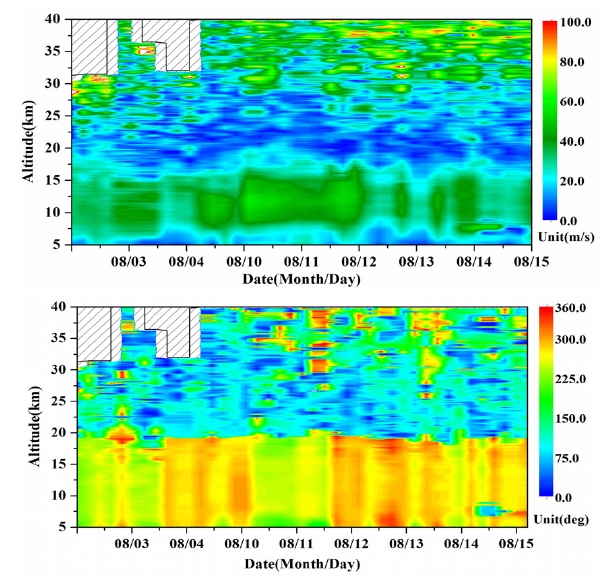
Following the testing and calibration experiment, we made continuous wind field observation in August 2010. Several valid wind data from August 2010 are drawn on one picture, as shown in the Fig. 5. Stratospheric quasi-zero wind layer can be found at around 20 km with a direction change from east to west evident. The low-level jet can be observed between the altitude 7 km and 15 km with the horizontal wind velocity around of 45 m/s from the Aug. 10 to Aug.
15. The wind velocities for the entire dataset almost increase along with the altitude, peaking at around 14 km, then they decrease to a minimum at around 20 km. They increase again from 20 km to 40 km. The wind velocities show slight fluctuation above 30 km because of low signal-tonoise ratio. The wind directions are shown to be quasiwesterly below 20 km and quasi-easterly above 20 km in Fig. 5.
The principle of wind measurement and the mobile Rayleigh Doppler wind LIDAR system were described. This instrument can measure the wind field at altitudes from 5 km to 40 km. An intercomparsion of wind velocity and direction was made between the mobile Rayleigh Doppler wind LIDAR measurements and rawinsonde measurements with good agreement. A continuous wind field observation experiment was carried out in Aug. 2010. A stratospheric quasi-zero wind layer can be found at around 20 km with a direction change from east to west evident. The wind field change process can be detected to help us investigate the atmospheric dynamics.