검색 전체 메뉴
PDF
맨 위로
OA 학술지
Measurement Range Enlargement in Brillouin Optical Correlation Domain Analysis Using Multiple Correlation Peaks
  • 비영리 CC BY-NC
  • 비영리 CC BY-NC
ABSTRACT
Measurement Range Enlargement in Brillouin Optical Correlation Domain Analysis Using Multiple Correlation Peaks
KEYWORD
Fiber optics sensors , Stimulated Brillouin scattering , Brillouin optical correlation domain analysis
  • I. INTRODUCTION

    So far, Brillouin scattering based sensors have been studied as promising technology for a distributed temperature or strain measurement in structural health monitoring [1-10]. Intrinsically, Brillouin scattering is an effect caused by acoustic vibrations in the medium when laser light travels in a medium such as an optical fiber. Since the sound wave is traveling, light is also subjected to a Doppler shift, so its frequency changes. The Brillouin frequency shift νB can be calculated from the effective refractive index of the propagating media n, the acoustic velocity Va, and the wavelength of the incident light λ :

    image

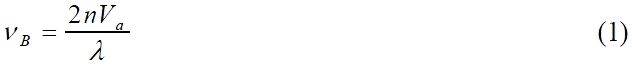
    On the other hand, in optical fibers, the acoustic velocity depends on the material density
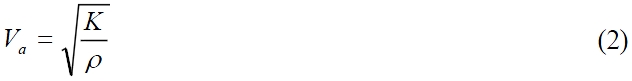
 ρ [11]:

    image

    where K is the bulk modulus.

    Since any temperature variation or deformation experienced by the fiber will also have an impact on its density, the Brillouin frequency will be shifted with the temperature or strain as expressed in Eq. (1) and (2). Also it is known that Brillouin frequency shift (BFS) is linearly proportional to these two quantities [9]:

    image
    image

    where ε is strain, t is temperature, tr is reference temperature, and Cs and Ct are the proportional coefficients of strain and temperature, respectively. (Cs = 4.6, Ct = 9.4 × 10⁻⁵ K).

    Among many Brillouin scattering based sensors, the most extensively studied techniques are Brillouin optical time domain reflectometry (BOTDR), Brillouin optical time domain analysis (BOTDA), and Brillouin optical correlation domain analysis (BOCDA). BOTDR and BOTDA have an advantage of long measurement range of several tens of km. However, their long measurement time (~ several minutes) and limited spatial resolution (> 50 cm) may prevent some specific applications for health monitoring of structures such as aircraft wings, rockets, and wind turbine blades. Meanwhile, BOCDA has a high spatial resolution (~ cm order) and a high sampling rate (~ kHz) with random access of sensing position. In this system, modulation parameters (amplitude and frequency) of a light source must be chosen such that only a single correlation peak lies within the sensing fiber. Thus, there is a trade-off problem between the spatial resolution and the measurement range [12-14]. Several techniques have been introduced to extend the measurement range while maintaining the spatial resolution such as optical time gating [14] (the measurement range: 250 m, the spatial resolution: 8 cm), double frequency modulation [15] (the measurement range: 34 m, the spatial resolution: 10 cm), and using different kinds of fibers [16]. Particularly, in [16], they demonstrated two times enlargement of strain distribution measurement range by using two different kinds of fibers and a typical electro-optic modulator (EOM) with the measurement range of 8 m and the spatial resolution of 4 cm. In this scheme, it is undesirable for the modulation amplitude Δf to be higher than the Brillouin frequency νB, since it suffers the reduction of signal due to counterbalancing of Brillouin gain and loss when Δf is larger than νB, where spectrum overlap occurs between the two sidebands from the EOM [17]. Since the spatial resolution is inversely proportional to Δf, there is some limit of spatial resolution in that scheme. Moreover, it requires a proper optical filter to distinguish the probe signal from the backward reflected pump waves at the overlapped frequency.

    To solve these problems, we use a single sideband (SSB) modulator instead of an EOM. In this scheme, Δf can be higher than νB, capable of achieving high spatial resolution. Additionally, to circumvent a beat noise between the lock-in frequency and the modulation frequency, we used a variation-frequency lock-in detection method [18]. Also we adopted a polarization diversity scheme to avoid the signal fluctuation due to polarization change of probe and pump light.

    II. PRINCIPLE

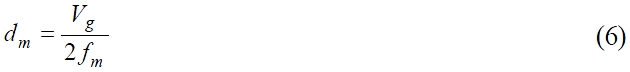
    In the typical BOCDA system, a sinusoidal frequency modulation is applied to the pump and probe waves, producing periodical correlation peaks along the test fiber [3]. The periodic correlation position
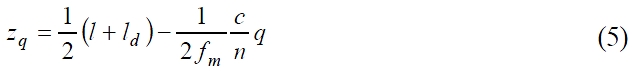
 zq is given by [19]:

    image

    where fm is the modulation frequency of the light source, c is the light speed in vacuum, n is the refractive index, q is

    an integer, ld and l are the length of delay fiber and test fiber, respectively. By adjusting the length of delay fiber, we can locate only one non-zero correlation peak zq along the fiber under test (FUT) sandwiched between the circulator and the optical isolator as shown in Fig. 1(a). And the stimulated Brillouin scattering is generated only at this correlation peak. Therefore, we can selectively obtain the information of the stimulated Brillouin gain spectrum (BGS) at the correlation peak position. This correlation peak, i.e., measuring position, is scanned by sweeping the modulation frequency fm. Therefore, spatial range of measurement is limited to the interval of the correlation peaks dm:

    image

    where Vg is the group velocity of light. Here, the spatial resolution Δz is given by:

    image

    where ΔνB is the Brillouin gain bandwidth and Δf is the amplitude of frequency modulation of the light source. From above two equations, the number of sensing points NR can be calculated as:

    image

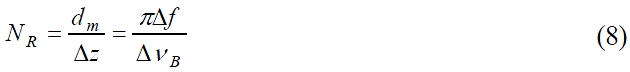
    Accordingly, to increase the measurement range, modulation frequency fm must be lowered or modulation amplitude Δf must be increased. When fm is lowered, the spatial resolution is deteriorated from Eq. (7). Therefore large Δf is required to extend the measurement range while maintaining the spatial resolution. However, it is not easy to increase Δf. Another method for enhancing the measurement range is to utilize multiple correlation peaks. In this technique, different kinds of fibers with different Brillouin frequency are connected to compose of FUT [16]. Furthermore, the length of each fiber is set in order that only one correlation peak is located in each fiber. Thus, strain distribution in each fiber can be selectively obtained by adjusting the sweep region of the microwave frequency ν since each Brillouin gain signal is well separated due to different Brillouin frequency shift among the fibers. Thus, the measurement range can be multiplied. For example, as shown in Fig. 1(b), assume that FUT is composed of three sections of fibers with different Brillouin frequencies which are connected by the correlation peak interval such that only one correlation peak is located on each fiber. By sweeping the microwave frequency wide enough to cover three different Brillouin frequencies, we can obtain overall strain distribution of the FUT. Accordingly, the measurement range can be expanded three times while maintaining the same spatial resolution.

    III. EXPERIMENTS AND DISCUSSION

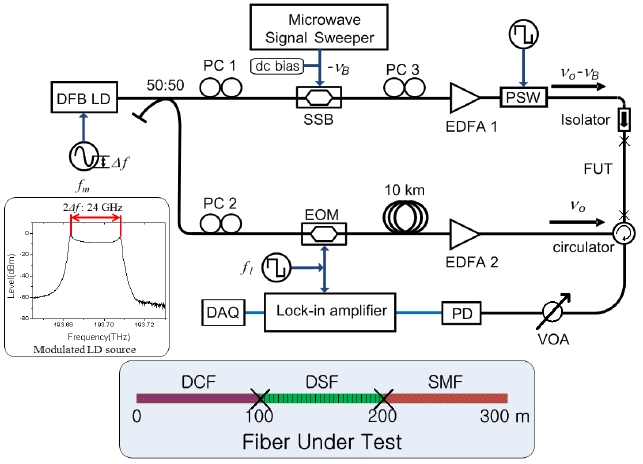
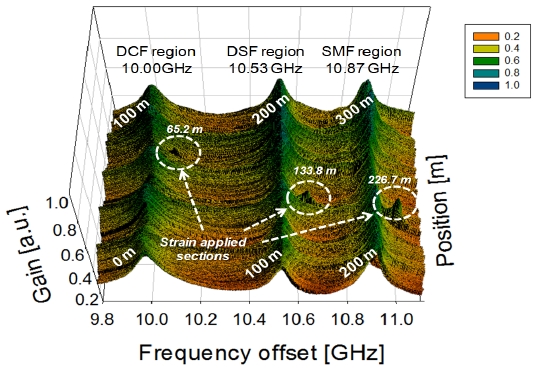
    The experimental setup is shown in Fig. 2. A FUT was constructed by splicing 100 m-DCF, 100 m-DSF and 100 m-SMF, which have different Brillouin resonance frequencies.

    As a light source, 1548 nm-distributed feedback laser diode (DFB-LD) was used, and a sinusoidal frequency modulation was applied to generate two correlation peaks within FUT. The modulation frequency fm was set to 1.0112-1.0313 MHz depending on the measurement position (i.e., the correlation peak) in FUT and modulation amplitude Δf was about 12 GHz. From these parameters the spatial resolution and measurement range was estimated to be about 8 cm from Eq. (7) and 100 m from Eq. (6), respectively. The output from the DFB-LD was divided into two beams by a beam splitter. One of the beams was used as the Brillouin pump after passing through 10-km delay fiber to control the order of correlation peaks and a high power erbium doped fiber amplifier (EDFA). The other beam was injected into the SSBM which was driven by a microwave signal generator, so that the first lower sideband, serving as the probe light, was generated and propagating against the pump in the FUT. Before entering the FUT, the pump and probe powers were about 30 dBm and 23 dBm, respectively. Additionally, a polarization switch (PSW) was inserted after the SSBM for suppressing the polarization dependence of the Brillouin signal [3]. Moreover, the pump light was chopped by an intensity modulator for lock-in detection and the lock-in frequency was chosen to get a sharp Brillouin peak and noise suppression. During the position sweep measurement, fl was varied according to the relation fl = fm/4 (fl is lock-in frequency and fm is modulation frequency) for minimizing the beat noise [18]. A 125-MHz photo receiver was used as a detector and the BGS was obtained through a lock-in amplifier.

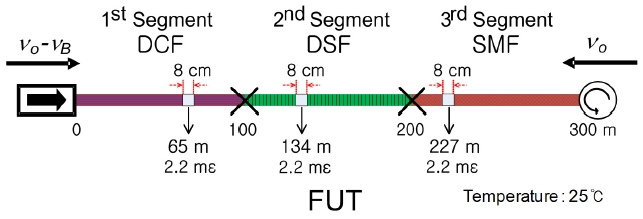
    As a proof of concept experiment, we performed measurement of BGS along the FUT, in which the strain of 2.2 mε was applied to three 8-cm sections and a temperature was maintained by an environment control system at 25℃ as shown in Fig 3. There are three correlation positions within the FUT: One is located in the DCF (0-100 m), another one in the DSF (100-200 m) and the third in the SMF (200-300 m). Since the νB of each fiber is different, we can selectively measure BGS distribution in each fiber by adjusting the sweep frequency.

    The BGS was measured every 4 cm along the FUT, sweeping Δν from 9.8 to 11.1 GHz. There are three Brillouin gain peaks in the spectrum and each peak comes from a different position (zq+1, zq and zq-1 in Fig. 1(b)) along the FUT. The measured distributed BGS along the FUT is shown in Fig. 4. Clearly different Brillouin frequencies

    are observed in each fiber. Note that the νB of each fiber was around 10.0 GHz, 10.53 GHz, and 10.87 GHz for DCF, DSF, and SMF, respectively.

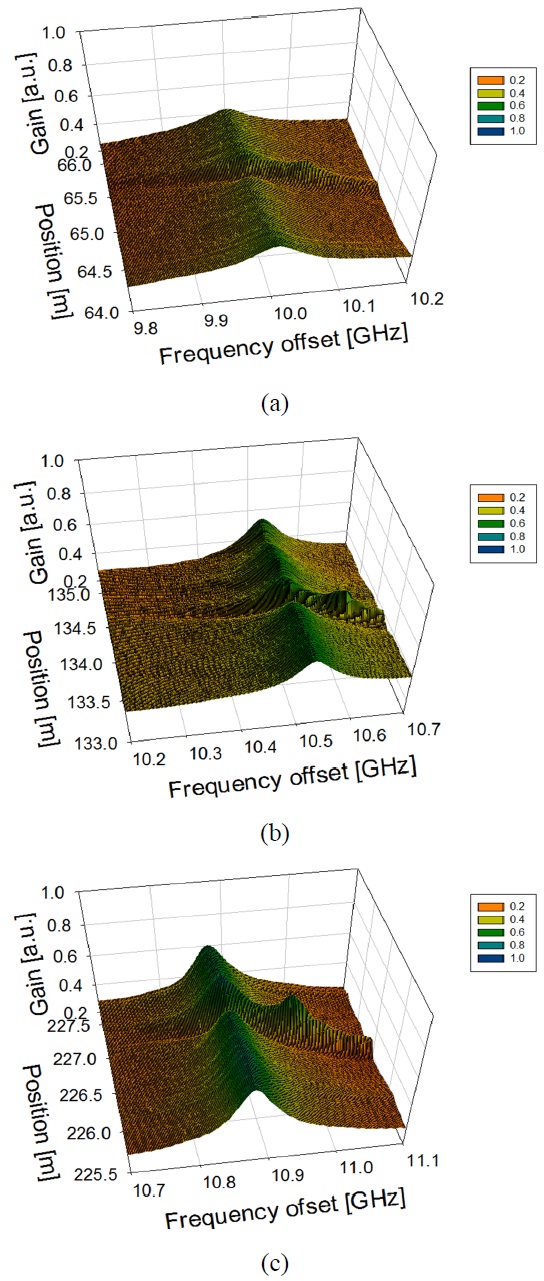
    Fig. 5 shows an expanded view of the distributed BGS of the circled segments shown in Fig. 4.

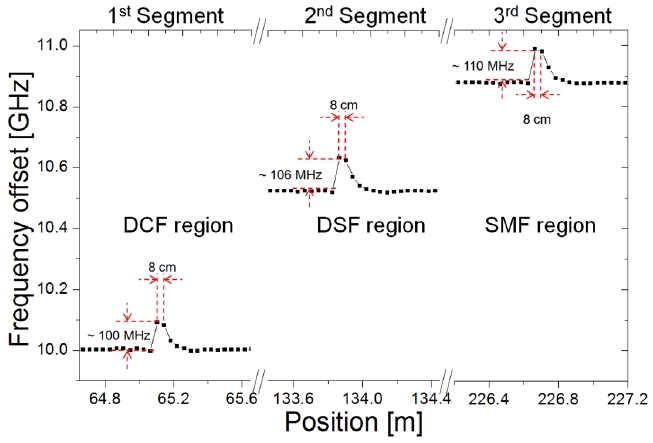
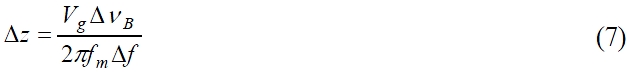
    On the other hand, Fig. 6 shows the distribution of the BFS derived from the data of Fig. 5(a)-(c). The spatial resolution was calculated to be about 8.0 cm by Eq. (7). We can observe clear Brillouin frequency shifts (BFS) at the strain applied sections. The change of the BFS was about 100 MHz, 106 MHz, and 110 MHz for DCF, DSF, and SMF region, respectively, which agree well with the applied strain of 0.22%. Also the BFSs have different slopes of BFS which are 0.046 MHz / 1 με , 0.0484 MHz / 1 με and 0.05 MHz / 1 με for DCF, DSF, and SMF, respectively by Eq. (3). The measurement error was about +/- 3.5 MHz, corresponding to the strain accuracy of +/- 0.007% (+/-70 με ).

    Thus, we successfully demonstrated strain distributed measurement over 300-m measurement range with 8.0-cm spatial resolution by using the proposed scheme, which has three times larger measurement range than that of the conventional BOCDA system.

    IV. CONCLUSION

    In conclusion, we achieved a factor of 3 expansion of measurement range in BOCDA system by using different kinds of fibers while maintaining the spatial resolution. In this technique, multiple correlation peaks within the sensing section can be utilized since any correlation peak point can be arbitrarily selected due to different Brillouin frequency shifts. In the experiment, by adopting the SSBM and variation -frequency lock-in detection technique, we could get a better spatial resolution. We expect that the proposed BOCDA system could be useful in the strain monitoring of civil structures.

참고문헌
  • 1. Li H.-N. (2004) “Recent applications of fiber optic sensors to health monitoring in civil engineering” [Eng. Structures] Vol.26 P.1647-1657 google
  • 2. Rogers A. 2002 “Distributed optical-fibre sensing,” in Handbook of Fibre Optic Sensing Technology, J. M. Lopez-Higuera, ed. P.271-311 google
  • 3. Hotate K., Abe K., Song K. Y. (2006) “Suppression of signal fluctuation in Brillouin optical correlation domain analysis system using polarization diversity scheme” [IEEE Photon.Technol. Lett.] Vol.18 P.2653-2655 google
  • 4. Bao X. (2009) “Optical fiber sensors based on Brillouin scattering” P.40-45 google
  • 5. Song K. Y., He Z., Hotate K. (2006) “Distributed strain measurement with millimeter-order spatial resolution based on Brillouin optical correlation domain analysis” [Opt. Lett.] Vol.31 P.2526-2528 google
  • 6. Mizuno Y., He Z., Hotate K. (2009) “Measurement range enlargement in Brillouin optical correlation-domain reflectometry based on temporal gating scheme” [Opt. Express] Vol.17 P.9040-9046 google
  • 7. Hotate K., Yamauchi T. (2005) “Fiber-optic distributed strain sensing system by Brillouin optical correlation domain analysis with a simple and accurate time-division pump-probe generation scheme” [Jpn. J. Appl. Phys.] Vol.44 P.L1030-L1033 google
  • 8. Dakin J., Culshaw B. 1997 Optical Fiber Sensors Applications, Analysis and Future Trends IV google
  • 9. Horiguchi T., Shimizu K., Kurashima T., Tateda M., Koyamada Y. (1995) “Development of distributed sensing technique using Brillouin scattering” [J. Lightwave Technol.] Vol.13 P.1296-1302 google
  • 10. Park C.-S., Joo K.-I., Kang S.-W., Kim H.-R. (2011) “A PDMS-coated optical fiber Bragg grating sensor for enhancing temperature sensitivity” [J. Opt. Soc. Korea] Vol.15 P.329-334 google
  • 11. Horiguchi T., Kurashima T., Tateda M. (1989) “Tensile strain dependence of Brillouin frequency shift in silica optical fibers” [IEEE Photon. Technol. Lett.] Vol.1 P.107-108 google
  • 12. Hotate K., Hasegawa T. (2000) “Measurement of Brillouin gain spectrum distribution along an optical fiber using a correlation-based technique-proposal, experiment and simulation” [IEICE Trans. Electron.] Vol.E83-C P.405-412 google
  • 13. Song K. Y., He Z., Hotate K. 2006 “Brillouin optical correlation domain analysis system with kilometer measurement range based on intensity modulation scheme” [in Proc. OSA/CLEO 2006] google
  • 14. Hotate K., Arai H. (2005) “Enlargement of measurement range of simplified BOCDA fiber-optic distributed strain sensing system using a temporal gating scheme” [Proc. SPIE] Vol.5855 P.184 google
  • 15. Zou W., He Z., Hotate K. 2011 “Enlargement of measurement range by double frequency modulations in one-laser Brillouin correlation-domain distributed discrimination system” [in Proc. CLEO/QELS 2011] google
  • 16. Hotate K., Tanaka M. 2001 “Enlargement of measurement range of optical-fiber Brillouin distributed strain sensor using correlation-based continuous-wave technique” [in Proc. CLEO/QELS 2001] P.119-120 google
  • 17. Song K. Y., Hotate K. (2006) “Enlargement of measurement range in a Brillouin optical correlation domain analysis system using double lock-in amplifiers and a single-sideband modulator” [IEEE Photon. Technol. Lett.] Vol.18 P.499-501 google
  • 18. Jeong J. H., Lee K., Song K. Y., Jeong J.-M., Lee S. B. (2011) “Variable-frequency lock-in detection for the suppression of beat noise in Brillouin optical correlation domain analysis” [Opt. Express] Vol.19 P.18721-18728 google
  • 19. Seo M. S., Yun S. C., Hyun J. Y., Park H. G. (2006) “Experiment of distributed optical fiber sensor using spatiallyselective Brillouin scattering” [Korean J. Opt. Photon.] Vol.17 P.223-230 google
OAK XML 통계
이미지 / 테이블
  • [ FIG. 1. ]  Schematic diagram of BOCDA system; (a) Conventional method. (b) Proposed method.
    Schematic diagram of BOCDA system; (a) Conventional method. (b) Proposed method.
  • [ FIG. 2. ]  Experimental setup for expanding the measurement range.
    Experimental setup for expanding the measurement range.
  • [ FIG. 3. ]  Structure of the fiber under test (FUT).
    Structure of the fiber under test (FUT).
  • [ FIG. 4. ]  3D distribution of BGS along the FUT.
    3D distribution of BGS along the FUT.
  • [ FIG. 5. ]  Expanded view of measurement of BGS distribution; (a) DCF region, (b) DSF region, (c) SMF region.
    Expanded view of measurement of BGS distribution; (a) DCF region, (b) DSF region, (c) SMF region.
  • [ FIG. 6. ]  Distributed BFS along the FUT.
    Distributed BFS along the FUT.
(우)06579 서울시 서초구 반포대로 201(반포동)
Tel. 02-537-6389 | Fax. 02-590-0571 | 문의 : oak2014@korea.kr
Copyright(c) National Library of Korea. All rights reserved.