In the high-speed optical communication systems with > 40 Gb/s per channel, it is essential to monitor and compensate for chromatic dispersion that can be changed by temperature variation [1] or dynamic reconfiguration of the optical network. Until now, there have been substantial efforts to develop the chromatic dispersion monitoring techniques, which include the techniques based on clock-frequency component (CFC), subcarrier tone, and phase-modulation to amplitudemodulation conversion [2-11]. Among the techniques, the technique using the power change of the CFC in the received signal seems to be the simplest because it does not need to add any extra modulation to the data signal [7-11].
However, the non-return-to-zero (NRZ) signal widely used in optical communication systems originally does not have a CFC. Therefore, if we want to use a CFC for chromatic dispersion monitoring in an NRZ signal, we need a clockextraction process. In an earlier work, we proposed a couple of efficient clock-extraction methods of NRZ signal for chromatic dispersion monitoring through numerical simulations [12]. In another earlier work, we showed that CFC of carriersuppressed return-to-zero (CSRZ) signal can be used for chromatic dispersion monitoring through numerical simulations [13]. In the earlier works, we evaluated the dispersion monitoring performance of the CFCs with two criteria: monitoring range and monitoring sensitivity to dispersion.
However, we have not yet shown any experimental demonstration or analytic derivation for the proposed techniques. Therefore, in this paper, we show an experimental demonstration and analytic derivation of the proposed chromatic dispersion monitoring technique based on CFC in NRZ signal. We conduct the experiment to obtain the experimental value of monitoring range and monitoring sensitivity and compare them with the simulation results and the analytic results. We also want to see if monitoring range and accuracy can be improved by using an efficient clock-extraction method.
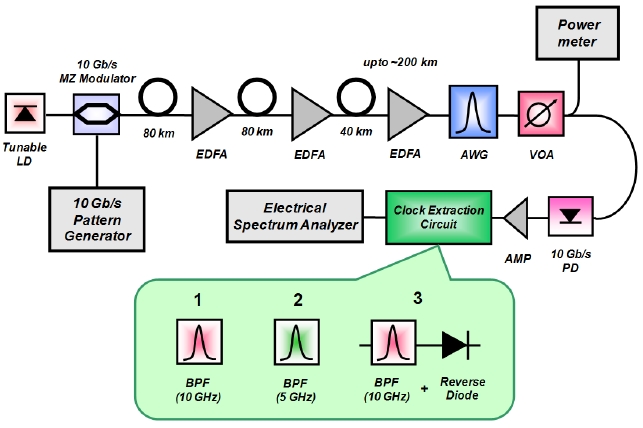
Figure 1 shows the experimental setup of chromatic dispersion monitoring based on CFC in the 10-Gb/s NRZ signal. To accumulate chromatic dispersion, we transmitted an optical NRZ signal up to 200 km through a single-mode fiber. At the receiver site, the optical signal is converted into an electrical signal through a 10-Gb/s photodiode (PD), and the electrical signal is amplified by using a 10-Gb/s electrical amplifier. And then, the amplified electrical signal is sent
into the clock-extraction circuit where three clock-extraction methods are used.
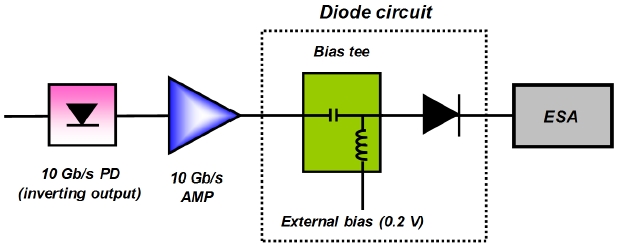
In the experiment, we implemented three clock-extraction methods: (1) the pure CFC, i.e. a 10-GHz component in this experiment (referred to as “C1” in Kim et al. [12]), (2) the half CFC, i.e. a 5-GHz component in this experiment (referred to as “C2” in Kim et al. [12]), and (3) the CFC after a reverse diode function (referred to as “C5” in Kim et al. [12]). The reverse diode function was implemented by using a schottky diode. The schottky diode has a barrier voltage of 0.2 V, thus we added a DC bias of 0.2 V to the input signal of the reverse diode by using a bias tee. The implementation of the reverse diode function in the experiment is shown in Fig. 2. Because we used an inverting output port of the PD, the direction of the diode is forward in Fig. 2. We measured the CFC power by using an electrical spectrum analyzer (ESA) with a resolution bandwidth (BW) of 5 MHz. Note that each clock-extraction circuit is very simple and can be easily implemented.
III. EXPERIMENTAL AND SIMULATION RESULTS
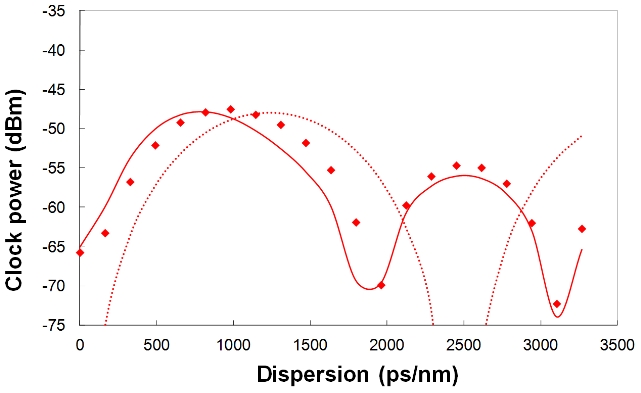
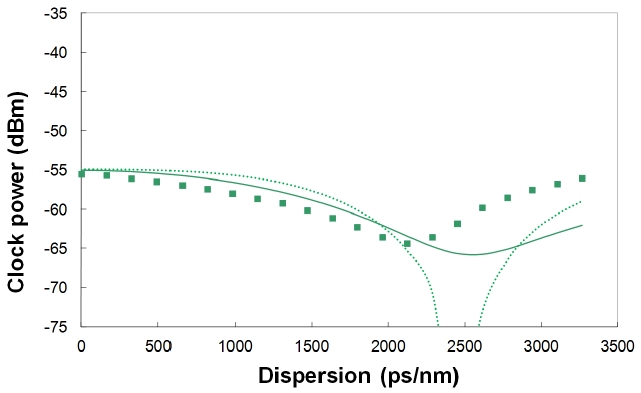
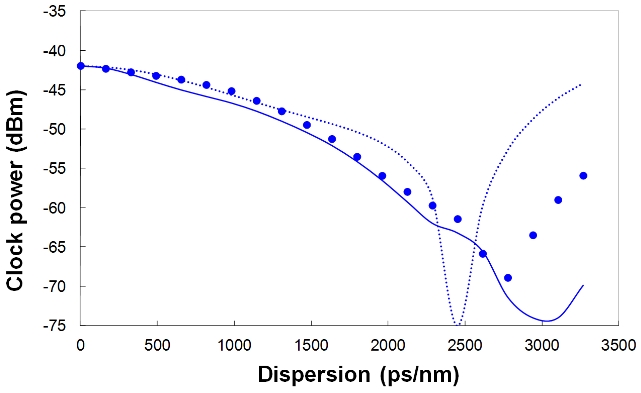
Using the experimental setup in Fig. 1, we measured the CFC powers of three clock-extraction methods as a function of chromatic dispersion. The experimental results of the pure CFC, the half CFC, and the CFC after a reverse
diode function are shown in Fig. 3, Fig. 4, and Fig. 5, respectively. The solid lines in the figures are the simulation results obtained by modeling the electrical BWs of the PD and the electrical amplifier as a one-pole low-pass filter (LPF). The dotted line in the figures are the analytic results, which will be discussed later. We can recognize that the experimental results correspond with the simulation results quite well.
In the experimental results, the monitoring ranges of the pure CFC, the half CFC, and the CFC after a reverse diode function are 1000 ps/nm, 2100 ps/nm, and 2800 ps/nm, respectively. Their simulation results are 820 ps/nm, 2600 ps/nm, and 3100 ps/nm, respectively. Even though the experimental results of monitoring range are not exactly same as the simulation results, the tendency of each clock-extraction method corresponds with the simulation results.
In the experiment, we also measured the monitoring accuracy of each CFC. We measured the noise power and CFC power at each point, thus we can define the monitoring accuracy as the amount of chromatic dispersion which corresponds to the noise variation of the CFC power. In the experiment, the resolution BW, the video BW, and sweep time of the ESA were 5 MHz, 1 kHz, and 1 s, respectively. In the experimental results, the monitoring accuracies of the pure CFC, the half CFC, and the CFC after a reverse diode function are < 12 ps/nm, < 200 ps/nm, and < 7 ps/nm, respectively. The simulation results are 1.5 A, 160 A, and 1.0 A (A is an arbitrary constant), respectively, when we assume that the noise power of each clock-extraction method is identical. We can recognize that the experimental results of monitoring accuracies correspond with the simulation results quite well. The experimental results and simulation results are summarized in Table 1 and Table 2, respectively.
Among the three CFCs that we conducted the experiment, the CFC after a reverse diode function gives the widest monitoring range and the best monitoring accuracy. This result also shows that the monitoring range and accuracy can be improved by using a suitable clock-extraction
[TABLE 1.] Summary of experimental results
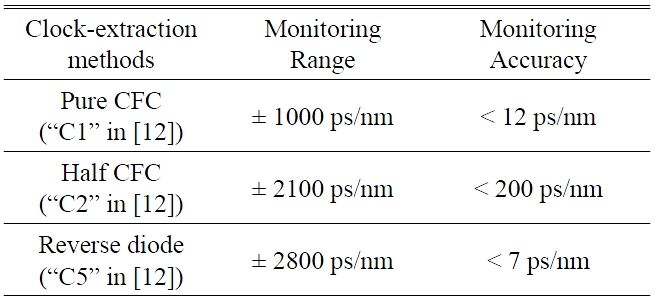
Summary of experimental results
[TABLE 2.] Summary of simulation results
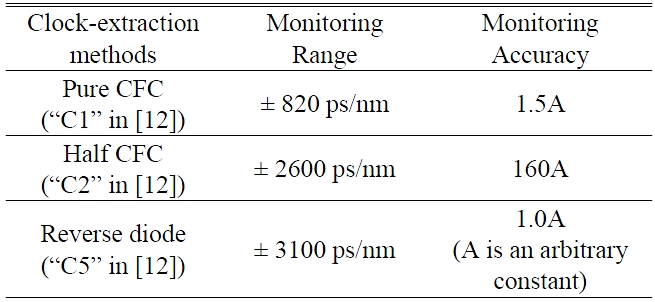
Summary of simulation results
method. And the clock-extraction circuit for the reverse diode function is so simple; a schottky diode (in reverse direction) and a band-pass filter.
IV. ANALYTIC DERIVATION OF CFC
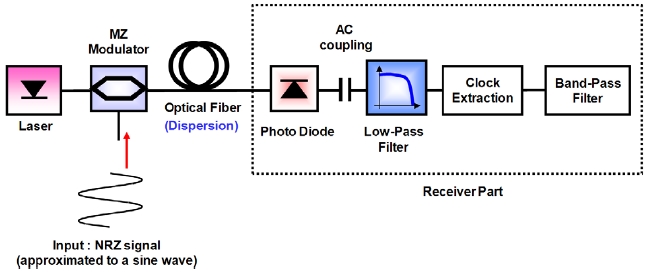
In this section, we will derive the analytic expression of the pure CFC, the half CFC, and the CFC after a reverse diode function. Fig. 6 shows our analytic model of optical transmission system for chromatic dispersion monitoring. At the transmitter, we consider a MZ modulator as a typical optical transmitter in our analytic derivation. And, for a simple mathematical expression, we assume that the input NRZ signal can be approximated by a sine wave because a bandwidth-limited NRZ signal is similar to a sine wave when the bit pattern is alternating zeros and ones and a sine wave input is sufficient for the analytic derivation of CFC as a function of chromatic dispersion [14]. In the model of optical fiber, we consider the chromatic dispersion but ignore the fiber loss because it is not important from the viewpoint of chromatic dispersion monitoring and it will be compensated by an optical amplifier.
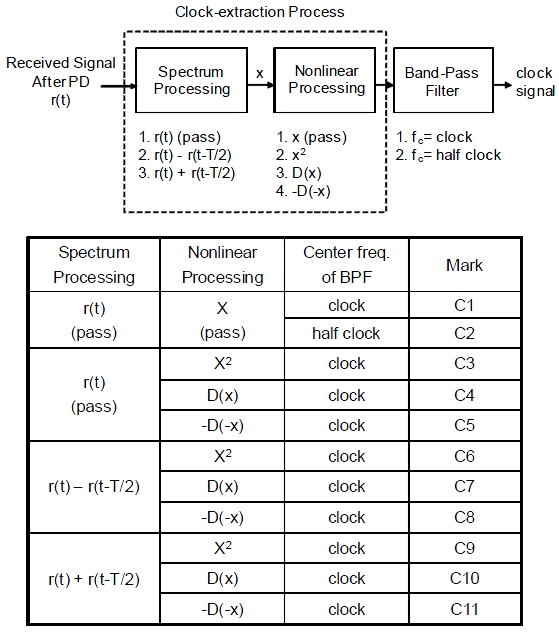
At the receiver, we mathematically consider the functions of a photodiode, an AC coupling, a low-pass filter (LPF) as a function of a typical model of an electrical receiver circuit, a clock-extraction process, and a band-pass filter (BPF) for measuring the CFC. In the earlier work, we categorized eleven clock-extraction methods of NRZ signal according to the clock-extraction process, as shown in Fig. 7 [12]. However, we will only show the analytic derivation of C1 (the pure CFC), C2 (the half CFC), and C5 (the CFC after a reverse diode function) among the eleven clock-extraction methods in Fig. 7.
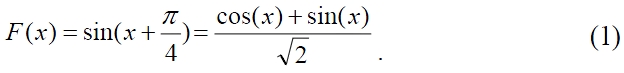
As the first step of the analytic expression, we consider the MZ modulator. The characteristic of a MZ modulator with the chirpless modulation and at the “normal” bias Vdc = Vπ/2, where Vπ is the modulator extinction voltage, the transfer function is given by [15]
As we mentioned before, we assume that the input NRZ signal can be approximated by a sine wave with a half clock frequency [14]. Thus the input NRZ signal, i(t), of the MZ modulator can be written as

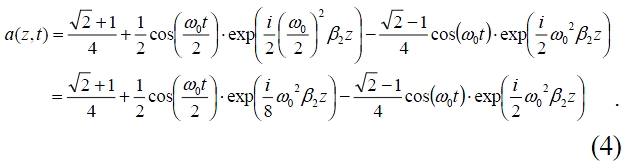
where ω0/2π is the clock frequency. When the input signal of the MZ modulator is given by Eq. (2), the output optical electric field of the MZ modulator then becomes:
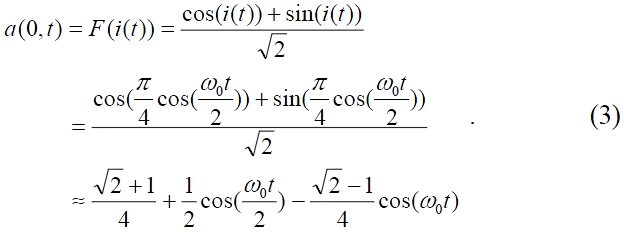
In the last line of Eq. (3), the first term is a DC component, the second term is the half CFC, and the third term is the CFC in optical electric field. Then, we need to consider the effect of chromatic dispersion. The optical electric field after the transmission through an optical fiber with a length of z and a chromatic dispersion of D = -
Due to the square law detection of the PD, the received electrical signal after the PD becomes:
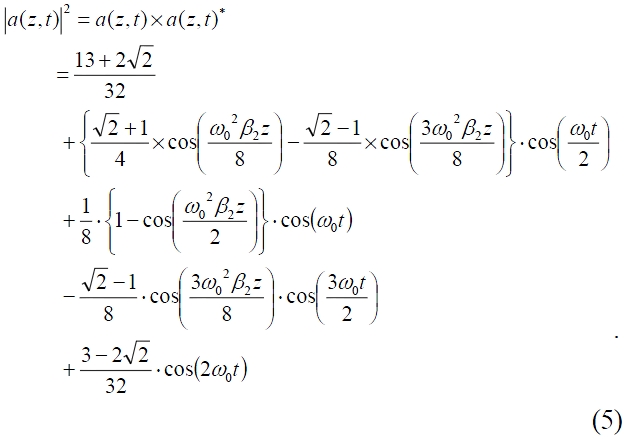
In Eq. (5), the first term is a DC component, the second term is the half CFC, the third term is the CFC, the fourth term is the 3/2 CFC, and the last term is the double CFC. Here, we can obtain the analytic expression of the clockextraction methods, C1 and C2. C1 is the CFC of the received signal, i.e., the third term of Eq. (5), and C2 is the half CFC of the received signal, i.e., the second term of the Eq. (5):
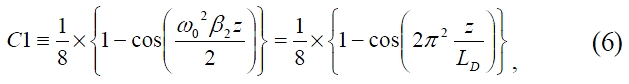
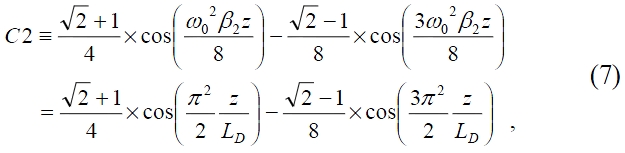
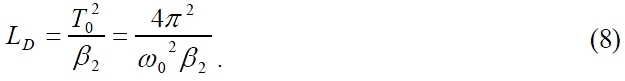
where LD is the dispersion length and is given by [14]
Now we go back to Eq. (5) to derive the analytic expressions of C5. In the nonlinear processing of Fig. 2, the amplitude of each spectrum component is important. However, in the real situation or simulation, the most NRZ optical receivers have a limited bandwidth of [0.75 × bit rate] typically, so we need to consider the LPF-like characteristic of the receiver. So we may ignore the high frequency components higher than the CFC in Eq. (5). We also need to consider the AC coupling of the most optical receivers; we have to remove the DC component. Therefore, we remove the DC component, the 3/2 CFC, and the double CFC in Eq. (5) and insert a constant to consider the LPF transfer function of the optical receiver. Then the received AC-coupled signal becomes:
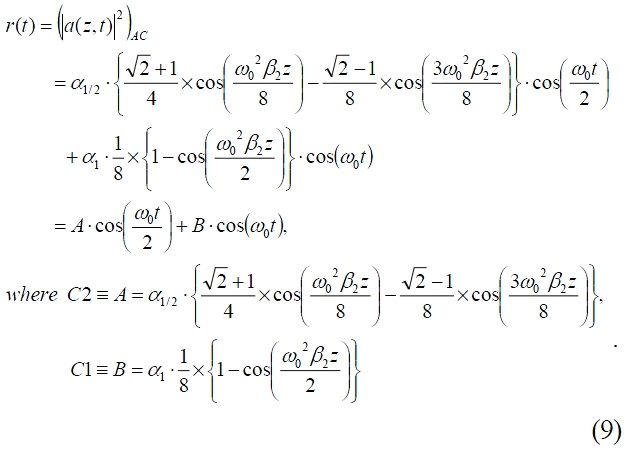
In Eq. (9),
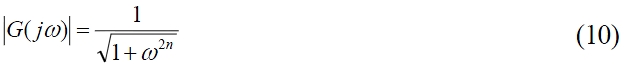
where n is the order of the filter. Thus
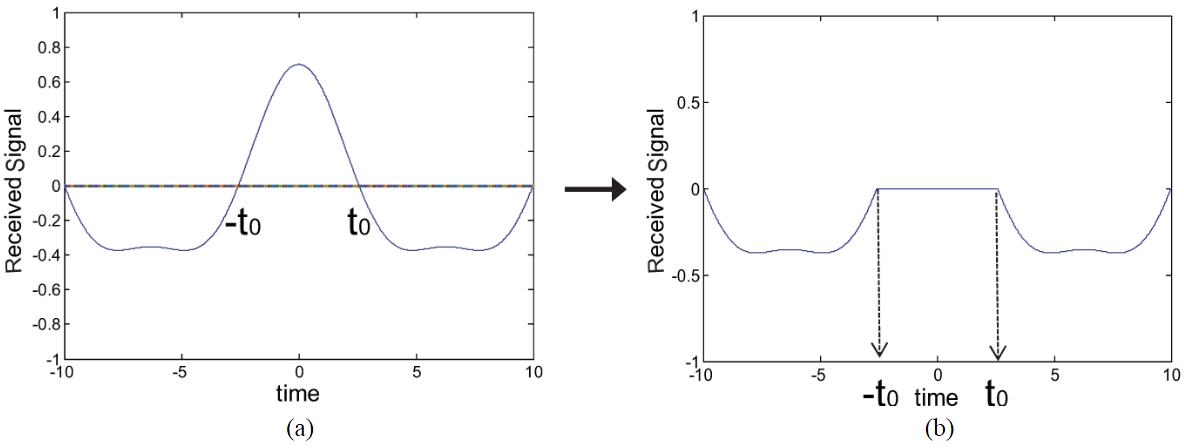
Now we will derive the analytic expression of C5, the CFC after a reverse diode function. C5 has a reverse diode function, which is quite difficult to get an analytic expression for. For better understanding, we illustrated the received signal, r(t), when the signal is transmitted by z = 0.1 LD in Fig. 8(a). If this signal is passed through a reverse diode function, the result will be the waveform in Fig. 8(b). Then we can get an analytic expression of CFC of the waveform in Fig. 8(b) using Fourier’s theorem [17].
Because we defined the input NRZ signal, i(t), as a cosine wave, the received signal, r(t), is an even function.
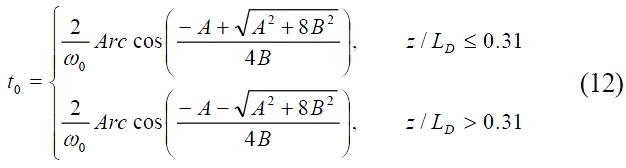
If we want to get an Fourier series of Fig. 8(b), we need to get the zero crossing time, t0, when r(t0) = 0. Therefore, we will solve the question below:
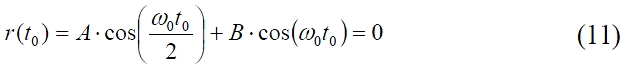
Then zero crossing time, t0, can be solved from Eq. (11) and is given by
Now we can get the expression of C5, the CFC after a reverse diode function by using Fourier’s theorem [17].
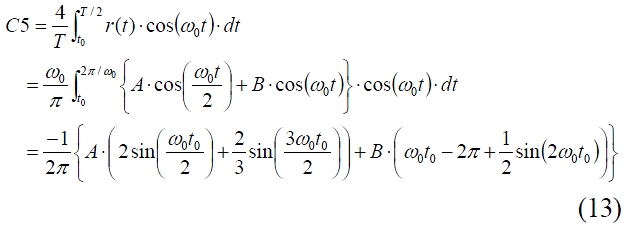
In conclusion, the analytic expressions of the pure CFC, the half CFC, and the CFC after a reverse diode function are derived in Eq. (6), (7), and (13), respectively. The analytic results are shown as a dotted line in Fig. 3, 4, and 5. We approximated the input NRZ signal to a simple cosine wave and assumed the repeated “0101” bit pattern in analytic derivation while we considered the real shape of the NRZ signal and a 27-1 PRBS (pseudo random binary sequence) pattern in the numerical simulations and the experiments. This causes a mismatch between the analytic results and other results. The similar mismatch of CFC depending on the bit pattern and the pulse shape of the input signal is also seen in the work of Heismann [14]. Thus it could be said that the analytic study has its limitations, however we think that it can give us an inspiration as to how the CFC changes after each processing.
We reported an experimental demonstration and analytic derivation of the chromatic dispersion monitoring technique that we had proposed through numerical simulations in the earlier work. The proposed monitoring technique uses the CFC power extracted from the received NRZ signal. We showed that the experimental results of CFC power, monitoring range, and monitoring accuracy correspond with the simulation results quite well. Analytic derivation results also correspond with the experimental and simulation results. Therefore, we can say that the earlier work done by our numerical simulations are credible and the chromatic dispersion monitoring techniques based on CFC are feasible in the real optical transmission systems. We also demonstrated that the monitoring range and accuracy can be improved by using a simple clock-extraction method.


![Clock-extraction methods of NRZ signal [12].](http://oak.go.kr/repository/journal/11457/E1OSAB_2012_v16n3_215_f007.jpg)