One of the surgeries common in the area of ophthalmology is cataract surgery. There are various types of this surgery, and the common process is to break and suck in the lens through keratotomy and then insert and fix an intraocular lens in the spot. Recently, as medical technology and intraocular lens production techniques have developed, the expectation of the surgery result is higher than ever before. When it comes to cataract surgery, although the medical aspects are of importance, the evaluation of the optical characteristics of the intraocular lens inserted into the eyeball is also vital [1-5] since the intraocular lens, in replacement of the natural lens, affects the optical power of the eye to a large degree. When the optical power of the intraocular lens put into the eye is not appropriate or when aberrations are high, the eyes may not properly work. For this reason, it is essential to include precise testing on optical properties such as effective focal length (EFL) and transmission wavefront aberration of the intraocular lens.
Transmission wavefront aberration of common lenses may be readily evaluated by means of the interferometer or Shack-Hartmann sensor (S-H sensor) [6-8]. There are various methods to measure EFL of lenses including, y’tan(θ ) method, Nodal slide method, Cornu method, Moire deflectometry, Talbot interferometry, Fizeau interferometry, and Shack-Hartmann wavefront analysis [9-12].
However, since an intraocular lens needs to be tested in liquid to maintain the optical properties during the testing process, common methods as above may not be enough. This study, therefore, takes into consideration for measuring the transmission wavefront aberration of the intraocular lens the fact that the surface of the liquid is flat under gravity and that the S-H sensor makes it easy to compensate for the aberration of the optical system except for the intraocular lens in the process of measuring. In addition, since the use of the S-H sensor enables the locating of the intraocular lens image to be more accurate, a very useful method to measure EFL of intraocular lens is introduced by means of this characteristic. In utilization of this EFL measuring method, this study introduces a simple method to measure the index of refraction of an unknown liquid.
II. DESIGN AND PRODUCTION OF INTRAOCULAR LENSES
In designing an intraocular lens, it is of great importance to consider the intraocular lens materials and the condition of the eyes for which the intraocular lens is used. In general, the material of the intraocular lens is sensitive to humidity, and thus the result in the testing after production may not satisfy the intended requirements although the performance seems satisfactory in the design.
Most lenses are used in air after production. As an intraocular lens, however, is used in the eye, the condition in the eye should be considered when the lens is designed and tested for satisfactory performance.
On the assumption that the eyes are in a normal condition, an intraocular lens was designed based on the eye model in Table 1 provided by “Zemax models of Human Eye” of the Zemax Knowledge base [13].
The intraocular lens was designed to minimize RMS wavefront error (RMS WFE) in an eye with the pupil size 5 mm, thickness 1.5 mm and hydrophilic acrylic. The location of the intraocular lens in the eyeball was 3.2 mm from the cornea.
Table 2 shows the design data of the intraocular lens, and we can see that the RMS wavefront error and EFL of the intraocular lens in deionized water are 0.02λ and 53.12 mm at wavelength 555 ± 10 nm in design, respectively.
Hydrophilic acrylic, used as a material for the intraocular lens, is easy to produce, but the hydrophilic nature causes
[TABLE 1.] Eye model provided by “Zemax models of human eye” of Zemax knowledge base
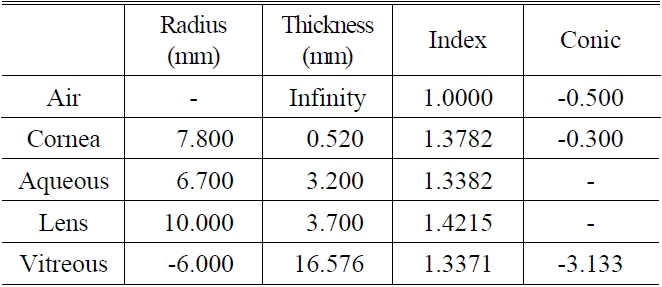
Eye model provided by “Zemax models of human eye” of Zemax knowledge base
[TABLE 2.] Data of intraocular lens design
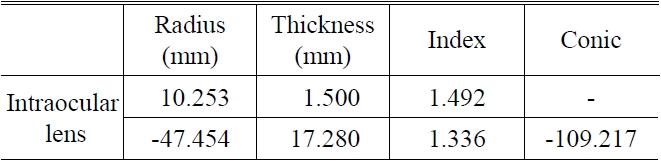
Data of intraocular lens design
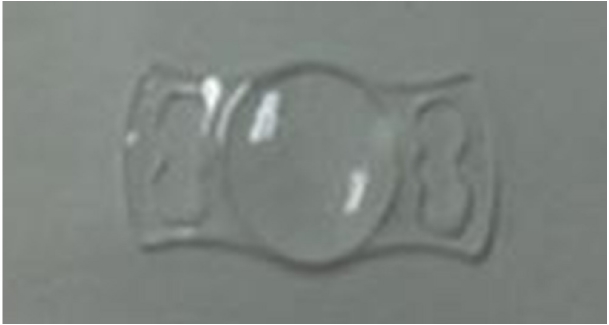
the manufacturing precision to be affected a lot by humidity. Thus, a lot of experience is necessary to get proper optical properties in consideration of such aspects as contraction and expansion of the intraocular lens in the production. For manufacturing of the intraocular lens, Precitech NanoForm 250 with feedback control method was used for ultra-precision processing. The sample of intraocular lens is presented in Fig. 1.
III. MEASUREMENT OF WAVEFRONT ABERRATION AND EFL OF AN INTRAOCULAR LENS
As mentioned in the introduction, the EFL and transmission wavefront aberration of an intraocular lens are measured by means of the S-H sensor. The problem is, though, that precise measuring of the optical characteristics such as thickness, curvature, and index of refraction is impossible by means of common methods since an intraocular lens is very sensitive to humidity. Since the intraocular lens exists in a liquid in the eye, the intraocular lens should be in liquid for accurate measuring. In this study, therefore, a specially designed intraocular lens holder is used to measure the optical characteristics of the intraocular lens while it is in deionized water. The intraocular lens holder is a cylinder type, metal holder of deionized water, which is sealed by means of the cover glass at the bottom of the holder so that light can be transmitted through it. With this intraocular lens holder held vertically, deionized water is put into it so that the intraocular lens is immersed. Then the set of water + intraocular lens + water + cover glass is formed. Since it is under gravity, this lens set can be regarded as a set of plano-convex-plano-plano. In addition, since changes of the thickness of the deionized water and the cover glass are not related to EFL of the lens set, the amount of water and the thickness of cover glass do not affect the measuring result and in the transmission wavefront aberration of intraocular lens too, the amount of water has little effect on it.
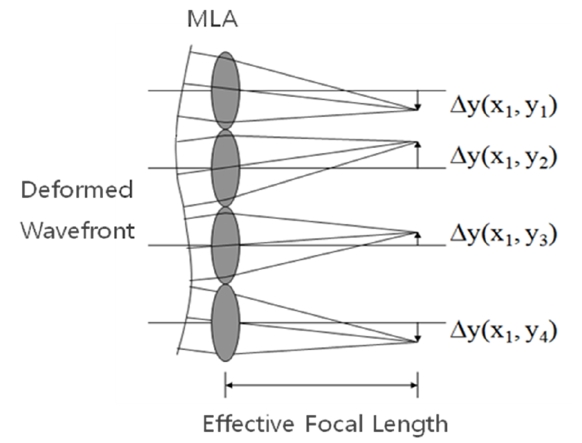
Basically, when a deformed wavefront goes through the
S-H sensor, it provides accurate measurements of the wavefront shape by analyzing the location of spots formed by imaging a beam of light onto a CCD with a microlens array (MLA).
In other words, when a deformed wavefront goes through a MLA, the location of the spots may be changed by each microlens depending on the tilt of the wavefront as illustrated in Fig. 2. As is well known, the partial derivatives relative to x and y of wavefront are determined by the spot shifts of x and y, respectively, as well as by the focal length of the microlens as shown Eq. (1) [14-16].
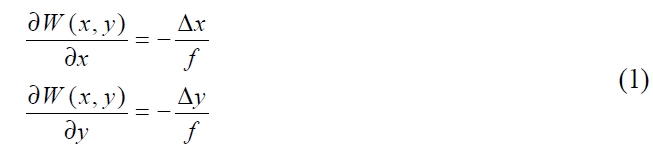
where W(x,y) describes the shape of the wavefront,
One of the outstanding advantages of the S-H sensor in measuring a wavefront is that the wavefront of a target object can be calculated using only the relative spot shift from the spot position formed by the optical system with the target object removed.
Thus, the quality of the optical components in measuring the optical system is not important, which makes it easy to measure the optical performance of an intraocular lens in liquid.
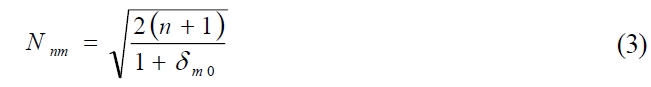
In general, wavefront aberration can be expressed as a superposition of Zernike polynomials [17-18]
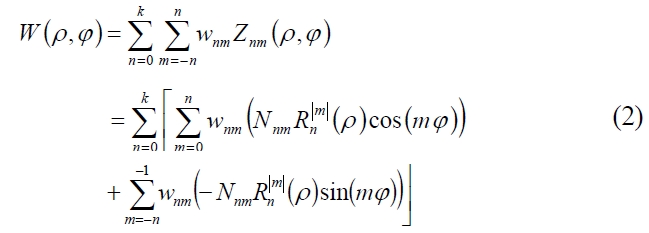
where Nnm is the normalization factor.
Using the data Δx and Δy obtained from the Shack-Hartmann wavefront sensor, the wavefront can be fit to a Zernike polynomial expansion where the expansion coefficients are determined using the least square estimation [14-17].
3.2. Measuring of the Transmission Wavefront Aberration of an Intraocular Lens
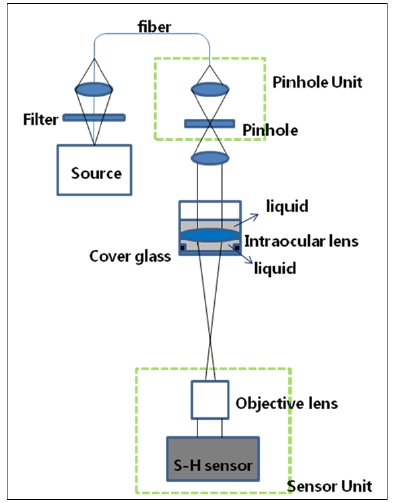
The system as in Fig. 3 is formed to measure the wavefront aberration of an intraocular lens. The narrow band pass filter (555 ± 10 nm) on the white light source was used. The fiber was used to spread the light vertically from top to bottom, and the half ball lens was adopted to focus it on the 3 μm pinhole. With the pinhole as the light source, a collimated beam with 5 mm diameter was formed by means of the collimator and 5 mm aperture. This beam goes through the intraocular lens holder specially designed as above. The collimated beam into the intraocular lens is focused by the intraocular lens in deionized water. The focused beam goes through the infinity-corrected objective lens, forms the collimated beam, and enters the S-H sensor. In this experiment, the pinhole unit and sensor unit in Fig. 3 are designed to move quantitatively in the direction of the z-axis.
The main goal is to measure the transmission wavefront aberration of the intraocular lens only, and thus the wavefront aberration by deionized water, cover glass, and objective lens after the pinhole should be removed.
First, the intraocular lens holder was removed to measure the wavefront aberration by the objective lens, and the pinhole was put on the focal point of the objective lens to
measure the spot shift (Δxobj, Δyobj)i by deformed wavefront aberration through the objective lens, where i indicates 1,2,3...imax, and imax the number of microlenses occupied by the beam transmitted into the S-H sensor.
Second, to measure the wavefront deformation by the cover glass and deionized water in the intraocular lens holder, the collimated beam is made incident on the intraocular lens holder, then the cover glass and deionized water will deform the collimated beam, and then it is possible to measure the spot shift (Δxcom, Δycom)j by this deformed wavefront from the collimator, deionized water and cover glass.
Let’s define the spot shift (Δxr, Δyr)n as follows

The location (Δxr, Δyr)n becomes the reference position of the S-H sensor in measuring the intraocular lens wavefront aberration.
Now the intraocular lens is immersed in deionized water in the intraocular lens holder, the focus of the intraocular lens is set on the focus of the objective lens, and then the spot shift (Δxtotal, Δytotal)k are measured by the S-H sensor.
Finally, the spot shift (ΔxIOL, ΔyIOL)k by the wavefront deformation of the intraocular lens only are calculated as follows
[TABLE 3.] Zernike standard coefficients of intraocular lens by S-H sensor
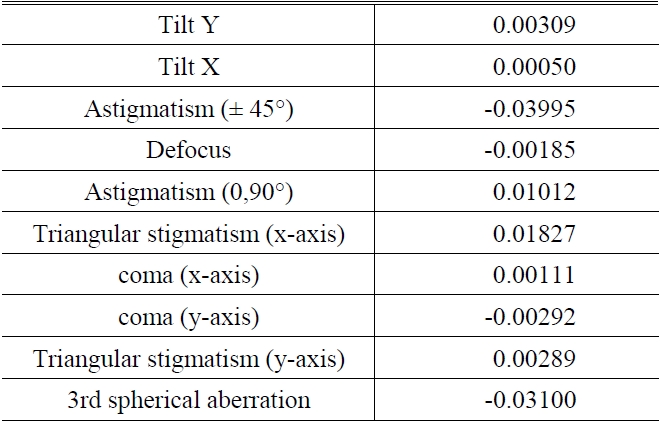
Zernike standard coefficients of intraocular lens by S-H sensor

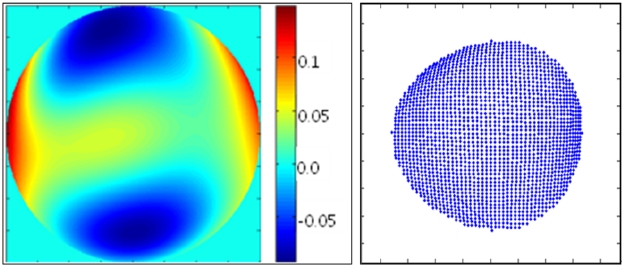
The wavefront deformation by the intraocular lens only are calculated with Eq. (1), Eq. (2) and (ΔxIOL, ΔyIOL)k and Fig. 4 shows the wavefront error map and spot shift (ΔxIOL, ΔyIOL)k of the intraocular lens only, where the spot shift in Fig. 4 is the 500 times amplification of the displacement.
This experiment showed that the amount of deionized water had no effect on the wavefront aberration of the intraocular lens. With the intraocular lens in deionized water, the RMS WFE is 0.02λ in design while the RMS WFE is 0.047λ in measurement and Zernike standard coefficients of the intraocular lens are showed in Table 3.
3.3. Measurement of the Effective Focal Length of the Intraocular Lens
As mentioned earlier, the optical characteristics of the intraocular lens are likely to change when it is inserted into deionized water after manufacturing. Thus, it is essential to measure EFL of the intraocular lens in liquid. This is because the most important optical property is the optical power of the intraocular lens when the intraocular lens is inserted into the eyes. Thus, whether the required optical power of the intraocular lens is appropriate is determined based on the comparison of EFL between the design and the measurement in liquid. This study introduces the easy way of measuring EFL, which is different from those using existing S-H sensors, and measures EFL of the intraocular lens by means of the introduced method. The S-H sensor is advantageous in that it can measure the location of an image point accurately. This is because the location of the image is found accurately by searching the proper position where the defocus coefficient among Zernike polynomial terms is minimized. Although it is possible to find the image position by means of the magnifying optical system and CCD instead of the S-H sensor, this study adopts the S-H sensor.
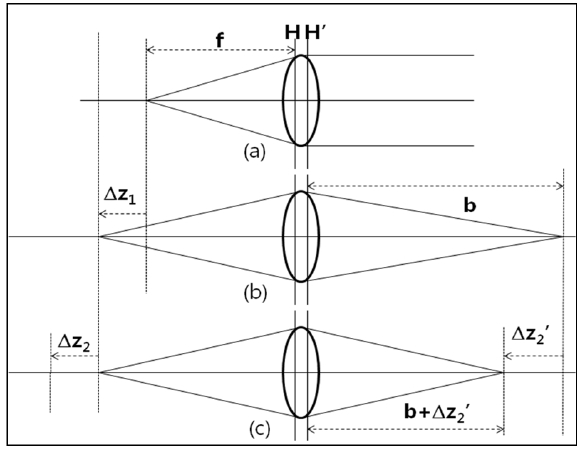
To measure EFL of the lens element, the measuring system as in Fig. 5 might be utilized.
It can be seen the relations as Eq. (6) and Eq. (7) from (b) and (c) in Fig. 5 and the lens equation.
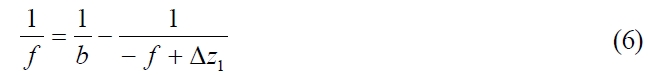
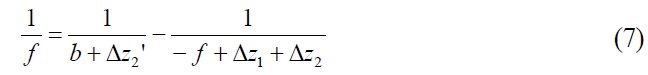
From Eq. (6) and Eq. (7),
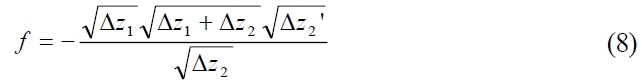
where Δz1, Δz2, and Δz2' become negative values when they move to the left, and positive when moving to the right, and
Eq. (8) shows that the EFL can be measured based on the only changes in location of the object and image.
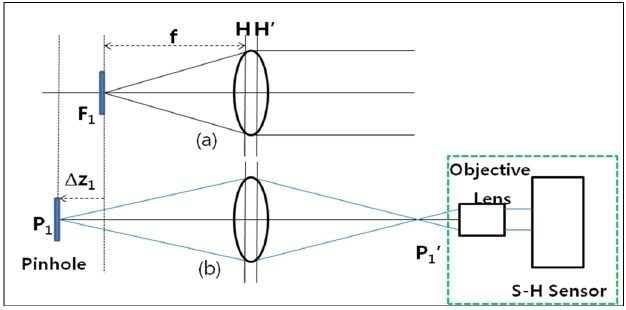
To measure EFL, the pinhole is put at the focus (F1) of a measuring lens as in Fig. 6(a), and the S-H sensor at the back of the measuring lens. It is easy to find the focus by moving pinhole back and forth until defocus coefficient of Zernike polynomial terms becomes minimized.
The pinhole is relocated from F1 to P1 by Δz1, and the sensor unit to the right is relocated as well and the location of the sensor unit is where the defocus coefficient becomes minimum. In the same manner, the pinhole is relocated by Δz2, and then the sensor unit also is relocated by Δz2'.
EFL is calculated based on Eq. (8) by means of the resulting Δz1, Δz2, and Δz2'. To verify the accuracy of the EFL from Eq. (8) through the experiment, the curvature(
The result was compared with that of the experiment result in the way stated in Fig. 6 with a He-Ne light source, unlike the case of the intraocular lens. As shown in Table 4, the difference between the calculated value and measured one was less than 0.5%.
In the experiment, the size of the collimated input beam was adjusted to minimize the wavefront error as small as possible, and the beam expander was adopted when the beam projected into the S-H sensor was small.
To minimize the error in measuring EFL, the object is relocated many times while the location of the image is measured, then EFL will be chosen as the average of EFL
values calculated every time when the object was relocated.
Now EFL of the intraocular lens is measured by means of the method above. In the same way to measure wavefront errors, deionized water is put into the intraocular lens holder, the intraocular lens is put into it, and then Δz1, Δz2, and Δz2' are measured in the way mentioned above to get the value of EFL. In measuring EFL of the intraocular lens, the quantity of deionized water and the cover glass of the intraocular lens holder do not affect EFL. Thus, measuring EFL of the intraocular lens as above is useful in that regard.
In the experiment with light source of 555 nm wavelength for the intraocular lens, the measured values are as follows: Δz1 = -100, Δz2 = -100, and z2' = -14.44; thus, EFL = 53.7 mm.
Note that, 555 nm wavelength is used for the intraocular lens and He-Ne laser for others.
When a plano-convex lens, whose accurate index of refraction is known, is used, the index of refraction of an unknown liquid can be readily calculated by means of the EFL measuring method explained in Section 3.2.Conversely, when the index of refraction of the liquid is known, the curvature and index of refraction of a plano-convex lens can be calculated with measuring method of EFL.
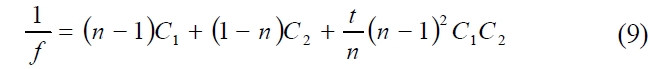
Let’s consider a lens with the curvature
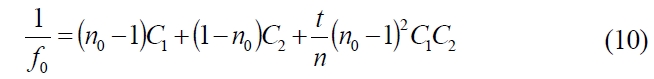
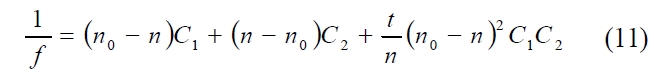
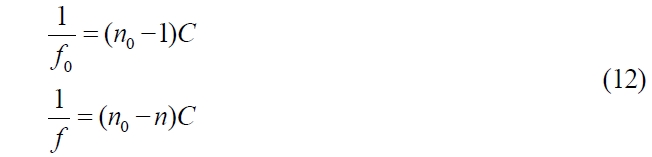
To remove the dependence of t, the lens thickness, let’s consider a plano-convex lens.
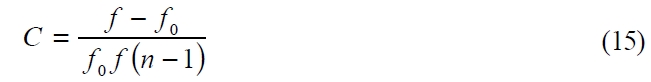
In this case, EFL
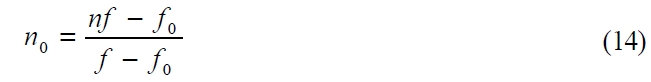
The index of refraction of an unknown liquid can be described as in Eq. (13) from Eq. (12).
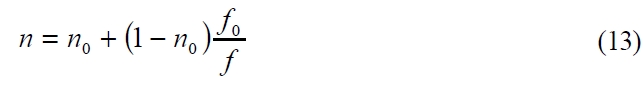
Thus, on a plano-convex lens whose index of refraction(
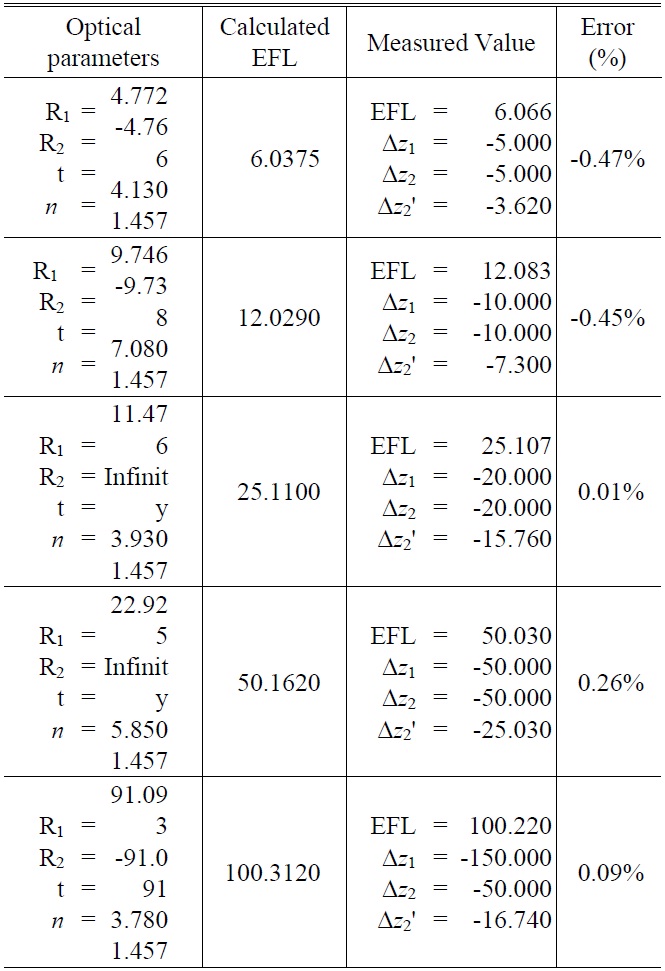
Measurement result of EFL with He-Ne Laser. In this table, error (%) is calculated value-measured value)/calculated value *100
of the unknown liquid with Eq. (13). Note that n in Eq. (13) is not in relation to the curvature and thickness of the lens, thus any kind of plano-convex lens may be used.
Using the lens with
With the index of refraction of the glass
The index of refraction of deionized water is 1.331747 at wavelength 0.6328μm, and thus the index of refraction of an unknown liquid may be measurable down to three places of decimals although there could be some variation depending on the measuring accuracy of EFL.
This way, the index of refraction
The accuracy of the index of refraction and curvature depends on the measuring accuracy of the image location.
As mentioned, an intraocular lens of hydrophilic materials and used in liquid is hard to measure by means of common lens testing methods. As emphasized above, to solve this problem, an intraocular lens should be tested in liquid. In this study, the transmission wavefront aberration of an intraocular lens was measured by means of the S-H sensor in consideration of the fact that the liquid is flat under gravity, and wavefront errors on the optical components other than the intraocular lens were removed easily. As for the intraocular lens, accurate measuring of EFL in addition to the transmission wavefront aberration is of great importance. The change in the image location as the object is relocated is measured by means of the S-H sensor, which indicates that EFL of intraocular lens or any lens is measurable. When the five sample lenses were used, it turned out that the error ratio of EFL was less than 0.5%. In addition, when a plano-convex lens, whose index of refraction was known, was used, EFL both in the air and in unknown liquid were measured in order to calculate the index of refraction of the unknown liquid. It is expected that this method could be utilized in measuring the index of refraction of unknown liquid in the future. Conversely, if the index of refraction of the liquid is known, the index of refraction and curvature of the plano-convex could be calculated. By means of a plano-convex lens with any thickness and curvature on a certain glass, the index of refraction of the glass could be measured in the way stated above. Note that this paper shows a very simple and new method with relatively high accuracy compared to the conventional methods to measure wavefront aberration and effective focal length.