Skin detection plays an important role in various areas of human-computer interaction, such as face detection, face tracking,content-based image data search systems, and gesture analysis.Recently, skin detection methods based on skin color data have attracted considerable attention because of their computational efficiency in terms of rotation, size, and partial obstruction of the relevant region. Skin color is used to complement the geometric data in designing the accurate face detection systems [1-4]. Skin detection via skin color is a significant preprocessing tool in face detection and recognition.
Research on skin detection is generally conducted using the visible spectrum images. However, skin detection in visible spectrum images is limited by ambient illumination, camera characteristics, ethnicity, and personal characteristics. Procedures using non-visual spectrum images, such as infrared images, have been considered as a means of resolving such issues, but these procedures require prohibitively expensive hardware devices or extremely limited environments [5-9].
As a means of classification, skin detection distinguishes two categories: the skin region and the non-skin region. For skin detection based on color data, an efficient classification procedure requires (1) the selection of an appropriate color model, (2) the selection of a suitable model distribution for skin and non-skin pixels, and (3) the consideration of the actual distribution being modeled. Selection of an appropriate color model determines the efficiency with which a given skin color distribution can be modeled. The skin color distribution is usually modeled by a histogram or a Gaussian distribution. Various techniques for
obtaining the actual distribution have been researched, from the simple use of a skin color lookup table to complex pattern recognition. In existing research on skin color detection, RGB images are transformed to a color space, where they can be divided by intensity and color to exclude effects of external illumination. TSL, NCC, HSV, and YCbCr are the color spaces that are usually considered. Techniques of transforming the color spaces include linear and nonlinear transformations in RGB. Linear transformations include YIQ, YYUV, and YCbCr. Nonlinear transformations include NCC, HSV, and HSL [10-13]. Recent research efforts have generally used techniques that transform higher-dimensional color spaces into lower-dimensional color spaces to save computational time [14,15]. When skin detection is conducted using predefined skin color data, the skin similarity threshold value that divides the background region from the skin region. This is determined from repeated experimentation [16]. Such methods are limited in that the threshold values vary according to the experimental environment and skin color data. Also, these threshold values are not standardized objectively, and are partly based on the subjective user concepts. To overcome the weaknesses in the existing procedures, this study introduces a technique of skin color detection using histogram data based on the mean shift algorithm in a lower-dimensional color space. Unlike the existing procedures, this technique does not use experimentally determined threshold values. Instead, it uses the mean shift algorithm to find local maxima, which is used as segmentation points to detect the skin region.
Methods of skin color detection can be classified based on physical characteristics and on statistical characteristics. The latter can be subdivided into parametric approaches [17-19] and nonparametric approaches [20-22]. Generally, methods based on statistical characteristics detect the skin region in a lowerdimensional color space to reduce effects of illumination. The skin color distributions used in parametric statistical approaches tend to follow a Gaussian mixture model (rather than a simple Gaussian model), and thus methods of skin detection based on these approaches usually employ a Gaussian mixture model [18,23]. Selection of model dimensions is one of the important problems which arise in such procedures. The selection is usually accomplished inductively, based on a priori environmental data, and the parameters of the skin color distribution are determined variously on the basis of ethnicity and illumination. Recent studies have made frequent use of the Expectation-Maximization (EM) algorithm as an applied technique for estimating the parameters of the Gaussian mixture model [24]. The EM algorithm uses a probability density function, determining the parameters of a skin color distribution by inductive estimation,based on ambient illumination and ethnicity. Nonparametric approaches use a model that expresses the general shape of the skin color distribution more easily than parametric approaches
[21,22]. Such techniques usually employ a histogram to represent the characteristics of the skin color distribution in color space. One major advantage of using a histogram is that the probability density function can be calculated quantitatively from a quantization level figure, even when the skin color distribution is complex.
Unlike the statistical approach, skin detection based on physical characteristics uses a physical model of inherent skin color. Such physical models are often employed in research methods to detect skin regions because they neglect background-based changes in illumination, and use permanent skin color characteristics.
2. METHOD OF SKIN REGION DETECTIOM
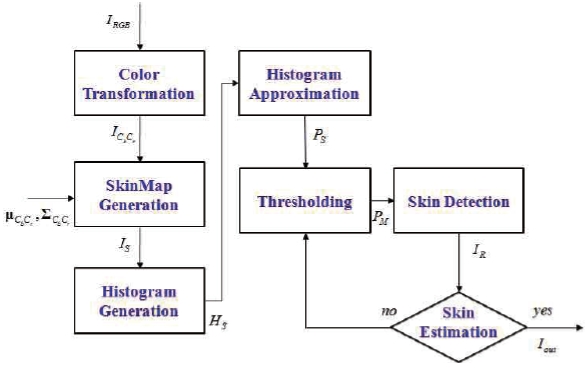
Figure 1 shows the entire block of the suggested skin region detection.
The proposed technique includes color transformation, skin map histogram generation, histogram approximation, and skin region detection via a mean shift. To accomplish the color transformation, input images are transformed to the YCbCr color space using a color transformation formula in RGB color space. The skin map histogram is generated by expressing the skin region distribution in terms of brightness values. This is calculated from a standard skin color table and similarities established in advance by using the skin color characteristics of the CbCr color space. Histogram approximation is carried out by regarding the histogram as a discontinuous function, which is approximated by a continuous Gaussian function using the Bezier curve theorem.Finally, the mean shift algorithm is applied to the histogram to find out the Gaussian local maxima in certain regions having similar brightness distributions. The brightness values of the pixels in the relevant regions are made uniform with these local maxima, and the regions having the maximum brightness value are detected as skin regions via region growing.
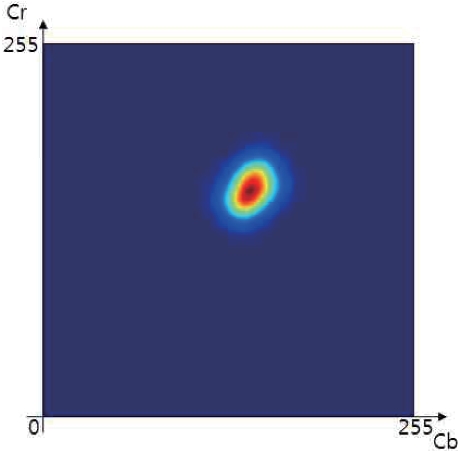
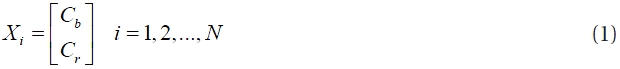
The skin region occupies certain parts of a color space, and this characteristic enables skin color to be divided from other background colors. The skin region distribution varies according to color space, and thus the choice of color space affects detection performance [16]. The YCbCr color space includes Y, which indicates the brightness value, and Cb and Cr, which represent color differences. Except for Y, the pixels of
In the images used in this study, the
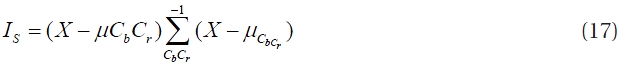
Thus, skin color distribution can be expressed as a 2D Gaussian function
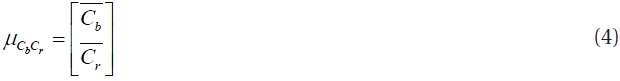
Here,

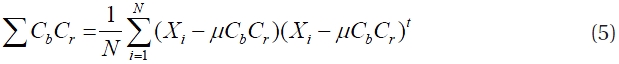
denote Gaussian mean color values, and denotes a 3D Gaussian covariance matrix.
The skin map used in this study is calculated from the skin region similarity between a standard skin color table and input images, and then normalized to brightness values between 0 and 255. The skin map is generated by applying the Mahalanobis distance to the Gaussian mean and covariance of predefined skin color images.
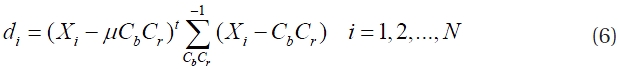
Equation (6) is the formula for calculating the Mahalanobis distance. ∑

2.3 Skin region detection using histogram approximation
The proposed technique uses skin map histogram approximation to efficiently detect skin regions in environments with varying or complex illumination. The procedure is carried out in three steps. First, the skin map histogram is regarded as a discontinuous function to be approximated by a continuous Gaussian function, using the Bezier curve theorem. In the second step, the mean shift algorithm is used to find Gaussian local maxima in certain regions having similar brightness distributions, and the brightness values of pixels in the relevant regions are approximated at the local maxima. In the third step, uniform brightness value of each region is investigated, and the region with the highest brightness value is detected via region growing.
2.3.1 Histogram approximation using bezier curve
Generally, a skin map histogram has the form of a discontinuous function determined by the accumulated brightness values of the pixels. In the proposed method, this histogram is approximated by a continuous Bezier curve, using the brightness value of each level of the histogram as a Bezier control point. Equation (8) is used to obtain a histogram from a skin map.
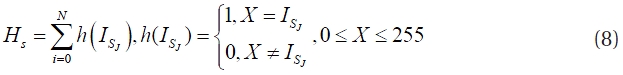
Here, N indicates the size of the skin map.
Equations (8) and (9) are Bernstein function equations for the Bezier curve [18].

Here,
The control point
2.3.2 Establishment of threshold value using mean shift algorithm
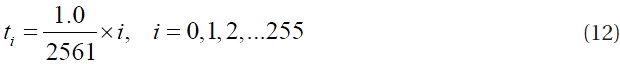
In the mean shift algorithm, the mode of the probability density function is found by hill climbing. The probability density function indicates the brightness distribution of pixels in the intensity image. The algorithm is a procedure for converging on a local maximum point within the kernel via repetitive calculation of mean locations and mean brightness values of pixels having a similar brightness distribution in a neighborhood of the given pixel. In other words, the pixel value at the current location is transformed to the brightness value at the local maximum, and thus the brightness values in the spatial region are made uniform. Thus, the optimal segmentation threshold value is obtained by using the mean shift algorithm. It is a point which has a valley-point in the boundary line between the uniform regions,or in the Gaussian histogram approximation. Equation (13) expresses the mean shift algorithm.
Equation (14) describes the transformation of the current pixel brightness value to the local maximum brightness value via the mean shift algorithm.

Here, x denotes the current pixel brightness value and k denotes the weight variable. Thus,

The maximum value is used because the skin region is the brightest region in the skin map.
Equation (16) is the equation for region growing.

Here,
step 1. The RGB input image is transformed to be YCbCr image.
step 2. From the analysis of standard skin color, skin color similarity is calculated using the following formula and a skin map is generated.
Here,

is expressed as a
step 3. After
step 4. The mean shift algorithm is used to find Gaussian local maxima in certain regions having similar brightness distributions. The brightness values of pixels in the relevant region are made uniform with the local maximum.
step 5. After the brightness values of the segmented regions are investigated, the regions having the maximum brightness value are detected as skin regions via region growing.
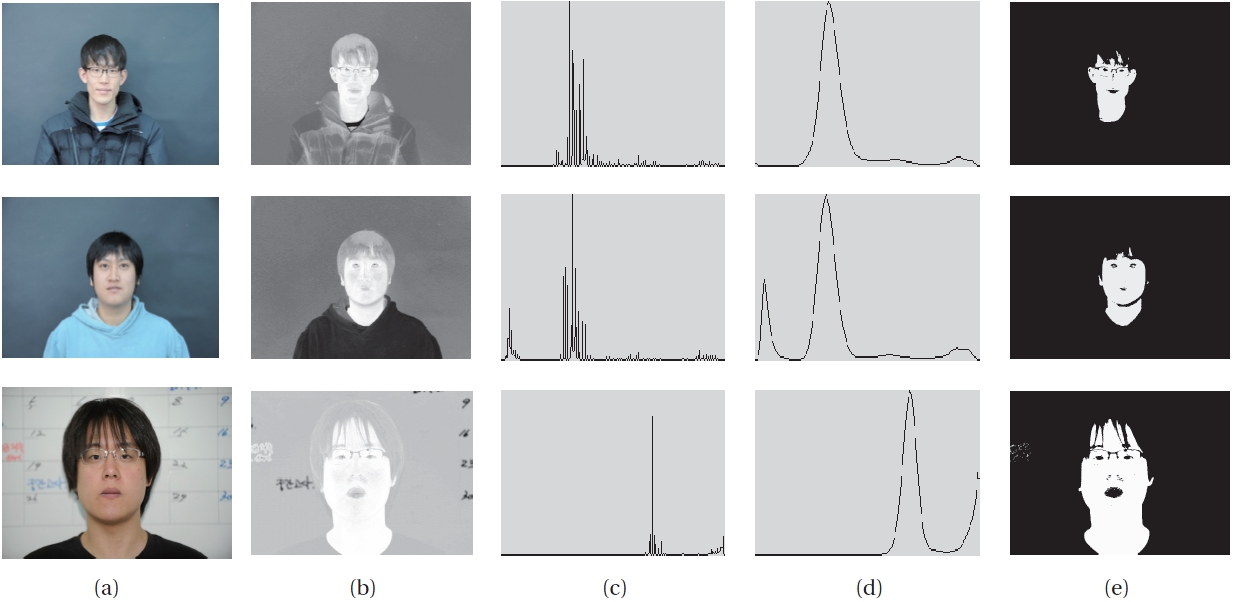
In the experiment, RGB color images 320 × 240 in size were captured with an ordinary digital camera. Figure 3 shows the process of skin region detection via the proposed method.
Figure 3(a) shows the input image, and Fig. 3(b) shows the normalization of skin similarity to the brightness values of 0 to 255 by applying Equations (6) and (7) to the input image. Figure 3(b) is brighter than the background because the face of the input image was accurately identified as the skin region by Equations (6) and (7). Figure 3(c) shows the brightness data of Figure 3(b) converted to a histogram, and Figure 3(d) shows the continuous approximation of the histogram via De Castelli's algorithm. Figure 3(e) illustrates the process of skin region detection via the proposed method. Figure 4 compares the proposed method to the existing method [16] using the skin color model. The same skin color model was used in this study for the objectivity of verification.
The same skin color model was used in this study for the objectivity of verification. As Figure 4 indicates, the proposed method accurately detected the skin regions via the mean shift procedure without a user-supplied threshold values. Also, the figure shows that compared to the existing method, the proposed method can accurately segment the skin and lip regions.
[Table 1.] Performance evaluation of skin color detection.
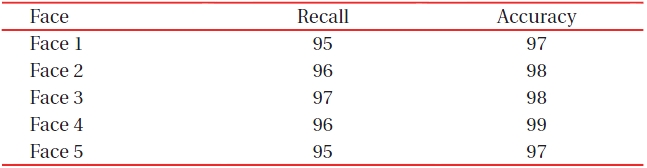
Performance evaluation of skin color detection.
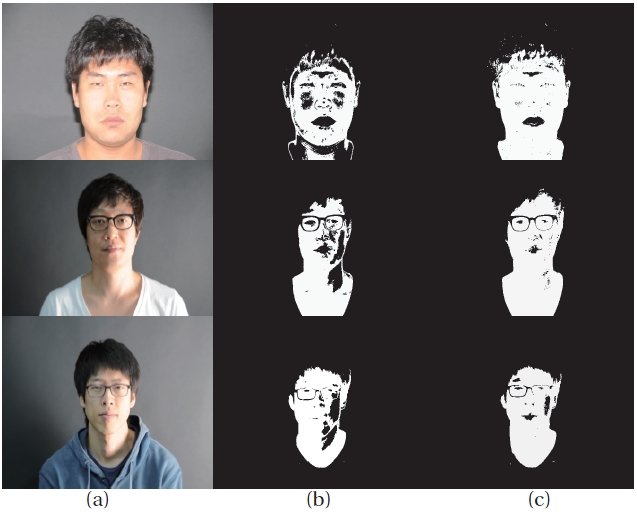
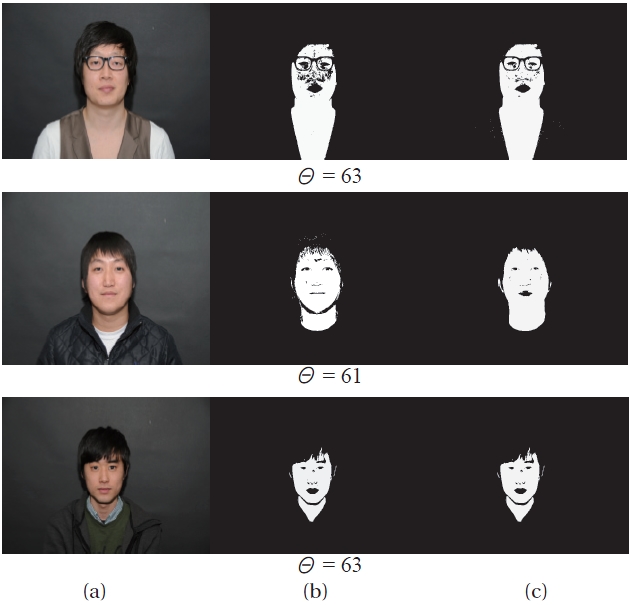
Figure 5 shows the results of skin region detection using the existing method [25,26] which establishes an appropriate threshold value based on ambient illumination, and the proposed method, in which segmentation points are determined via the mean shift algorithm.
Images used in skin detection experiments are generally captured in an internal environment under fluorescent light, where the skin color contamination by illumination is insignificant. In this study, strong illumination was deliberately projected onto a certain part of at the left side of the human face to investigate the performance of the proposed method. The same skin color model was used with both the existing and the proposed method for the sake of performance objectivity.
Figure 5(a) shows input images in which illumination was projected onto the faces from a certain direction. Figure 5(b) shows skin detection results using the existing method, and Figure 5(c) shows the results using the proposed method. In this experiment, the threshold values for the existing method were selected from the optimum skin detection values determined by experiment. As Figure 5 indicates, the proposed method detected skin regions more efficiently than the existing method, even though the skin color was changed by the illumination in certain directions. The existing technique detected the region by calculating skin similarity and establishing a threshold value at each pixel. On the other hand the proposed method applies the mean shift algorithm to the skin map histogram to find Gaussian local maxima in certain regions having similar brightness distributions, and assigns uniform brightness values to pixels in the relevant regions.
To evaluate the performance on the proposed method, we suggested Precision, Recall and Accuracy, the equation is as followed.

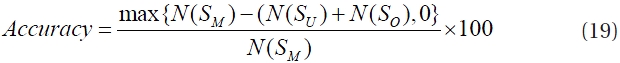
Recall is defined as the ratio between the number of skin pixels correctly classified by the proposed method and the total number of actual skin pixels. Accuracy means that skin region by proposed method was how many matched with real skin region. In the equation (18) and (19),
Table 1 shows the result of the performance of the proposed method, X axis indicated the input images and y axis indicated the percentage of performance. The results of recall was 95.8%, accuracy was 97.8%. The reason for the lower value of recall than accuracy is due to the contamination of skin color on the illumination change. In terms of the result of performance the proposed method appeared as a strong method to detect the skin region.
This study introduces a method of skin detection by applying the mean shift algorithm to histogram data. In the existing methods using standard skin color models, skin similarity threshold values for segmenting the background region and the skin region are determined by repeated experimentation. A weakness of these techniques is that the threshold values vary according to illumination and environment. Also, established threshold values cannot be standardized objectively, and include subjective factors, determined by individual users.
In the proposed method, a skin map histogram of an input image is created by using standard skin color characteristics of the CbCr color space. The accumulated data at each brightness level are analyzed via the mean shift algorithm, and the skin region is detected by finding the regional segmentation points. Even when the skin color is contaminated by illumination, this procedure can accurately segment the skin region and the background region. The proposed method may be useful in detecting facial regions as a pretreatment for face recognition in various types of illumination.