In a p-i-n type thin film amorphous silicon (a-Si) solar cell, optoelectronic properties of the window layer are of significant importance. For high performance, the p-layer of the solar cell should have a high optical bandgap to minimize optical absorption, high dark conductivity and photoconductivity to reduce series resistance, low activation energy to obtain higher open circuit voltage (Voc), and a narrow valence band tail in order to obtain higher short circuit current density (Jsc). As the wide optical gap window layer ensures less light lost in absorption at the p-layer, higher Jsc can be achieved [1].
Boron doped hydrogenated amorphous silicon carbide (p-type a-SiC:H) films have been mostly used for this purpose. However, the incorporation of carbon in the p-type a-SiC:H films give rise to a void structure, and caused an increased defect density. In contrast, p-type a-SiOx:H films have a lower defect density, Urbach energy and comparatively high doping efficiency [2]. Therefore, the p-type a-SiOx:H films provide a wide bandgap and higher photoconductivity compared to other wide bandgap hydrogenated amorphous silicon materials, which could be useful as a window layer for the solar cells [1,3-4].
In this paper, we prepared a-SiOx:H films by varying N2O gas as a p-layer window for a-Si solar cells. We also reported the electrical and optical properties of silicon oxide for different N2O and B2H6 gas ratios as well as current-voltage characteristics for a-Si
solar cells with p-type a-SiOx:H films as a window layer.
P-type a-SiOx:H films were deposited by the RF PECVD technique on a glass (Eagle 2000 glass, size 5 × 5 cm2, 1 mm-thick) and Si wafer with (100) orientation as substrates. The glass substrates were ultrasonically cleaned by dipping in acetone, isopropyl alcohol, and de-ionized water for 5 min. The 0.2 μm film thickness was fixed for each sample at a substrate temperature (Ts) of 175℃ through the glow discharge decomposition of silane (SiH4), hydrogen (H2), nitrous oxide (N2O 90% diluted in He), and diborane (B2H6 99% diluted in H2) gas mixtures, with gas flow rates of SiH4=10 sccm, N2O(+He)=3(+27), 5 sccm, B2H6(+H2)=0.05(+4.95), 0.1 (+9.90) sccm, H2=95, and 90 sccm. The RF power density of 50 mW/cm2, pressure of 0.2 Torr and an electrode separation of 4.0 cm was used for the whole process.
The Fourier transform infrared spectroscopic (FTIR) (Prestige-21 spectrometer, Shimadzu, in 7,800 ~ 350 cm-1) system was used to estimate the concentration of oxygen (C(O) at.%) within the film measurements on Si samples. The asymmetric stretching vibration of oxygen in the Si-O-Si bond was detected at a wave number of approximately 1,000 cm-1 and was used to calculate the oxygen content with the help of a calibration constant from reference
We fabricated the a-Si solar cell with p-type a-SiOx:H window layer while the i and n-type (1% phosphine, PH3, doped) layers are a-Si:H based. The quantum efficiency (QE) of a-Si solar cell was measured by the QEX7 system (PV measurement Inc.QEX7).
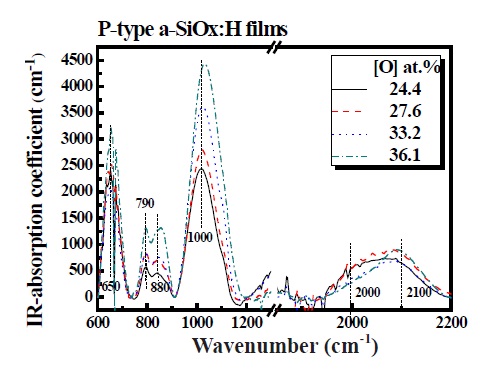
Figure 1 shows the absorption coefficient between 600 and 2,200 cm-1 attained by FT-IR spectra of p-type a-SiOx:H films with different oxygen contents. By neglecting reflectance, the absorption coefficient α is directly defined from the relation [5].
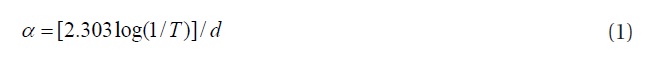
where d is film thickness in centimeters and T is the transmittance by measuring the FT-IR spectra. The spectra exhibits absorption peaks corresponding to an Si-O-Si rocking at 650 cm- 1, overlap of a local bond configuration with mixed bending and stretching character for oxygen and hydrogen atoms (H-Si(Si2O)) at 790 cm-1, HSi-O3 bending at 880 cm-1, Si-O-Si stretching at 1,000 cm-1, Si-H stretching at 2,000 cm-1, and Si-H2 stretching at 2,100 cm-1[10-14]. The integrated absorption band centered at around 1,000 cm-1 mainly represents oxygen content by the following relation [6].
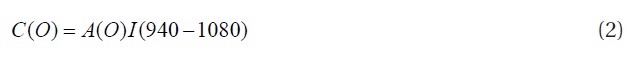
where C(O) is the oxygen concentration (units of at.%), A(O) = 0.156 at.%/eV cm-1 and I(940-1080) is the integrated absorption. Considering this mathematical relation, the oxygen content depends critically on N2O and B2H6 gases ratio. With increasing N2O gas ratio (30 and 50%) and decreasing B2H6 gas ratio (0.5 and 1%), the oxygen content increased from 24.4 to 36.1 at.%. The peak position was shown to shift slightly to higher wave numbers with increasing oxygen content. The presence of more electronegative neighboring atoms shifts the peak toward higher wave numbers and this shift is due to the reduction of the bond length caused by the transfer of valence electrons to more electronegative neighboring atoms [6]. The properties of p-type a-SiOx:H films such as I(940-1080), oxygen content, Eopt and refractive index are summarized in
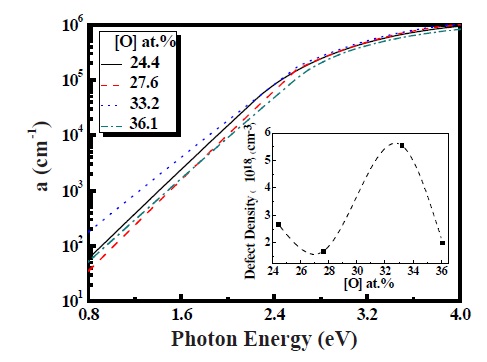
In Fig. 2 the absorption coefficient (α) measured by spectroscopic ellipsometry (SE) of p-type a-SiOx:H films for oxygen content between 24.4 and 36.1 at.% displayed. The absorption area is divided into three regions - the defect region (0.8~1.6 eV), the band tail region (1.6~2.0 eV) and the band to band absorption region (2.0 eV~). In regards to the defect region, absorption occurred by defect states located in the middle of the gap for the defect region [7]. We can deduce defect density (ND) from the integrated absorption in the defect region by using the below mathematical expression.
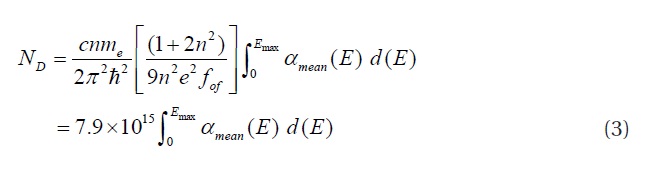
where ND is the defect density, αmeans is the measured defect absorption, c is the velocity of light, n is the refractive index, me is the electron mass and Emax, of approximately 1.6 eV, after subtracting the Urbach edge contribution. For Eopt = 1.91-2.03 eV, the ND increased from 1.91 × 1018 cm-3 to 5.55 × 1018 cm-3 (see inset of Fig. 2). In general, ND increased with increasing oxygen content as well as Eopt at the same B2H6 gas ratio in the p-tpye a-SiOx:H [8]. However, our deposition condition of gas ratio is a variable factor for both the N2O and B2H6 gas ratio. For this case, the absorption in the defect region increased with increasing the N2O and B2H6 gas ratio. Therefore the value of ND is highest at the condition regarding N2O of 50% and the B2H6 1% gas ratio. Therefore, the variation of these gas ratios will be acting as dopants for the role of increasing conductivity, Eopt and defect.
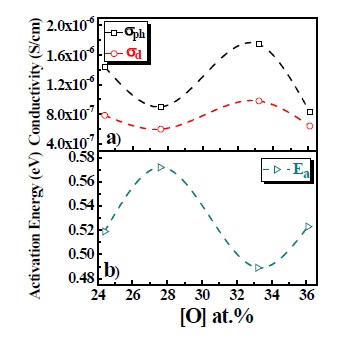
Figure 3 contains the room-temperature dark conductivity (σd), photo conductivity (σph) [(a)] and activation energy [(b), derived from the temperature dependence of σd] for p-type a-SiOx:H films as a function of oxygen content. It provides a correlation between the effect of dopant- B2H6 and oxygen and conductivity. The value of σd and σph increased with increasing the B2H6 ratio at the same oxygen ratio. The value of σd and σph also increased with the rising N2O ratio at the same B2H6 ratio. The p-type a-SiOx:H film with N2O 50% and B2H6 1% has σd and σph of 9.79×10⁻⁷ S/cm and 1.71×10⁻⁶ S/cm. From the conductivity between the variable B2H6 and the N2O ratio, we can deduce that the B2H6 ratio is a superior factor. One possible reason for this may be that boron doping can compensate the donor like states created by oxygen in boron doped a-SiOx films [8]. As the oxygen atoms with three fold coordination have extra electrons so the oxygen-induced donor like states move the Fermi-level causing the increase of σd and σph. The activation energy is the energy distance between EF and the valence band edges as shown in Fig. 3(b). The activation energy is 0.49-0.57 eV for the p-type a-SiOx:H films with Eopt=2.03~1.91 eV. The activation energy increases with the in-
crease of B2H6 and N2O ratios. The shifting of Fermi level towards the valence band due to the incorporation of oxygen and boron may be the reason for the increase of activation energy [9,10].
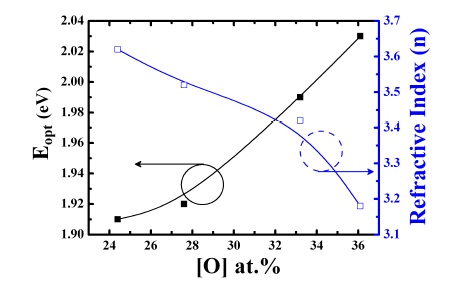
As a result the Eopt decreased with the increase of the B2H6 ratio. Figure 4 also represents the variation of the refractive index (n) with different oxygen content. The refractive index is expected to depend on the density of films and their electronic band structure [10]. We also observed that the refractive index decreases from 3.62 to 3.18 at the beginning of O-incorporation into the p-type a-SiOx:H film network. The decrease in regards to the refractive index may be due to an increase of voids and disorder in films through the incorporation of oxygen [14].
For the high conversion efficiency of a-Si solar cells, the player should have high Eopt, low Ea, high conductivity, and low absorption. We further apply p-type a-SiOx:H films (N2O 30% and B2H6 0.5%) and (N2O 30% and B2H6 1%) to a-Si solar cells.
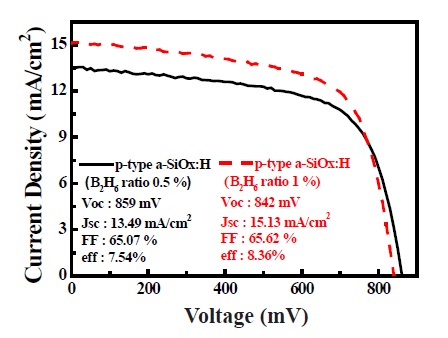
Figure 5 shows the current - voltage (I-V) characteristics of the a-Si solar cells with 0.5 and 1% of B2H6 ratios. The cells with Voc = 0.853 and 0.842 V, Jsc = 13.87 and 15.13 mA/cm2, fill factor = 0.664 and 0.656 and a conversion efficiency of 7.54 and 8.36% have been obtained. The Voc and FF slightly decreased while Jsc increases with higher a B2H6 ratio. The higher Eopt of the B2H6 0.5% condition compared to the B2H6 1% condition will result in a higher Voc. The higher Eopt has a higher built-in potential energy in the solar cell. The lower Jsc and a higher FF coincides with the tendency of theoretical efficiency limits for homojunction solar cells [15].
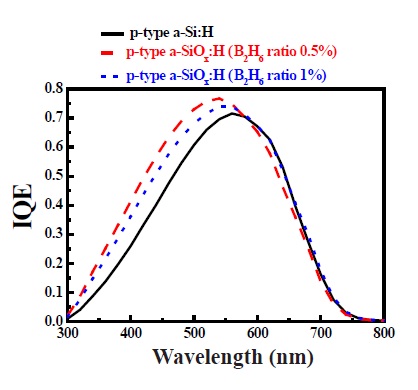
The quantum efficiency of a-Si solar cells for different p-type window materials is presented in Fig. 6. We used three different devices with the following (p-type a-SiOx:H with Eopt of 1.75 eV), (a-SiOx:H(p) with Eopt of 1.94eV) and (p-type a-SiOx:H with Eopt of 1.91 eV) conditions. The effect of Eopt has been represented in the short wavelength region and by increasing Eopt, whereby the intensities of the spectral response increases.
We prepared p-type a-SiOx:H films by optimizing the optical bandgap, electrical conductivity, and activation energy with the PECVD process of SiH4, H2, N2O and the B2H6 gas mixture. The Eopt was found to increase with an increase of the N2O gas ratio through the incorporation of oxygen but decreased with an increase of the B2H6 ratio. There is an increase in σd, σph and Ea with increasing both the B2H6 and N2O ratio. Here, we selected two ptype a-SiOx:H films with good optical bandgap, dark conductivity and activation energy for the applications regarding a-Si solar cells. We employed these two p-type a-SiOx:H films for the a-Si silicon solar cell. The increase in Jsc of the device with B2H6 (1%) as compared to B2H6 (0.5%) was related to Eopt. A conversion efficiency of 7.54 and 8.56% at the B2H6 (0.5 and 1%) ratio was achieved demonstrating the effectiveness of the silicon oxide (SiOx) material.