In mineral oil filled transformers, the degradation of the oil is a major concern [1]. Insulation materials degrade at higher temperatures in the presence of oxygen and moisture. The degradation from thermal stress affects electrical, chemical, and physical properties of the oil [2]. There has been a growing interest in the technique to diagnose, determine and decide the condition assessment of transformer insulation. This is primarily due to the increasingly aged population of transformers in utilities around the world [3].
Each of the known techniques has its own method of assessing the condition of transformers. Dissolve Gas Analysis (DGA) is one of the most recent techniques developed to diagnose the fault condition on oil filled insulation transformers.
There are more than 6 known different methods of the DGA fault interpretation technique so there is the likelihood that they may vary in their interpretations. This could lead to inconsistent conclusions on the condition of the transformer and thus it is necessary to arrive at a reliable decision on each transformer so
[Table 1.] Common types of fault and key gases in DGA [5].
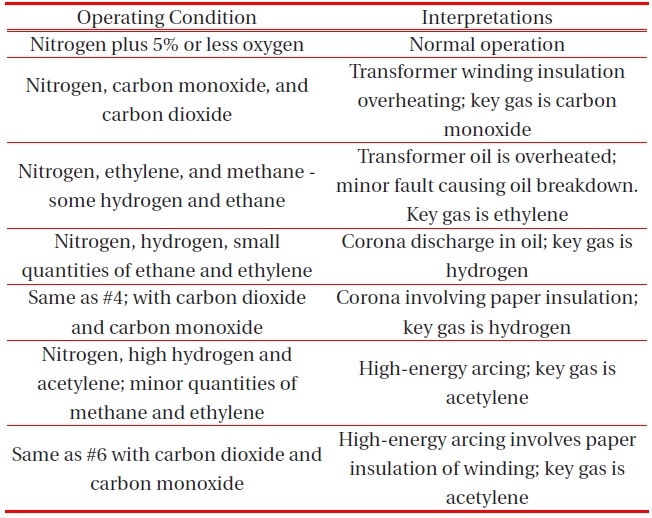
Common types of fault and key gases in DGA [5].
[Table 2.] Roger’s ratio gas [5].
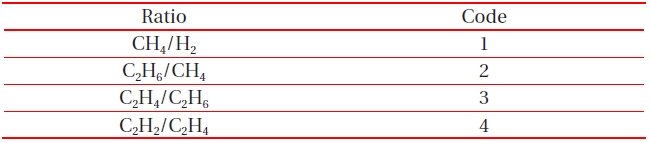
Roger’s ratio gas [5].
as to take the correct and appropriate maintenance action. A series of combined interpretation methods that can determine the power transformer condition faults in one assessment is therefore needed.
In this paper, a computer program-based system for four DGA assessment techniques is presented and discussed because some of the methods are similar with near equivalent gas ratios [4]. The analysis of these diagnostic techniques on fault interpretation to determine a common comprehensive fault analysis is also presented. The four techniques are the Rogers Ratio Method, IEC Basic Ratio Method, Duval Triangle method and Key Gas Method. When they are used separately, they are likely to be less accurate than when combined.
The four diagnostic techniques above are presented separately and this is followed by the computer program and the analysis of the computer result to compare the fault interpretations.
Various diagnostic schemes have been developed for DGA interpretation. These methods attempt to map the relations between gases and fault conditions, some of which are obvious and some of which may not be apparent. The evaluation has been simplified by looking at key gases and the associated condition as discussed in Table 1.
3. DGA FAULT ANALYSIS TECHNIQUES
This method uses the 4-digit ratio code generated from the 5 fault gases (H2, CH4, C2H6, C2H4, and C2H2) to determine 15 diagnosis rules for transformer conditions as shown in Tables 2 and 3.
[Table 3.] Roger’s ratio code [5].
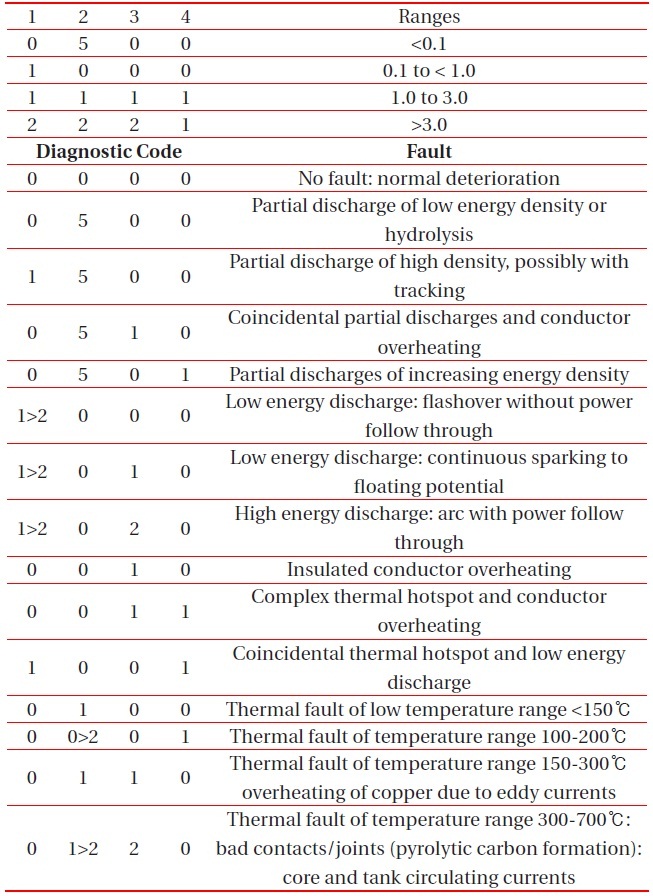
Roger’s ratio code [5].

IEC basic gas [5].
[Table 5.] IEC basic code [5].
IEC basic code [5].
This method originated from the Roger’s Ratio method, except that the ratio C2H6/CH4 was dropped since it only indicated a limited temperature range of decomposition [6] as shown in Table 4 and 5. The faults are divided into nine different types.
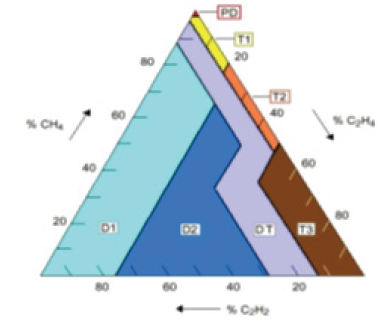
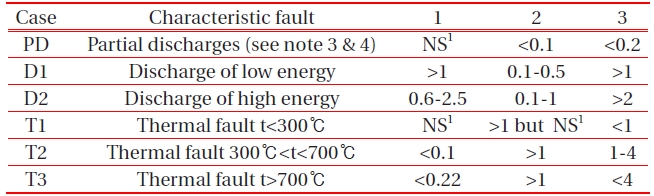
This method has proven to be accurate and dependable over many years and is now gaining in popularity. The Duval triangle determines whether a problem exists as in Fig. 1 below. At least one of pre-requirement of L1 limit must fulfill, and increasing at a generation rate (G1 and G2) as shown in Table 6, before a prob-
[Table 6.] Duval triangle legend [7].
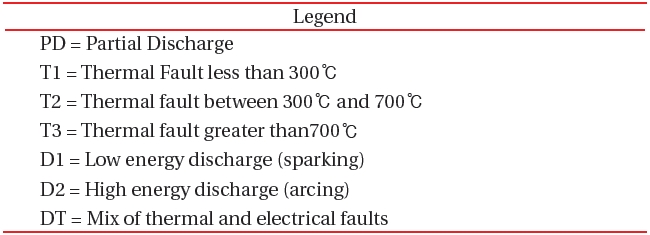
Duval triangle legend [7].
[Table 7.] Limit and generation rate per month [5].
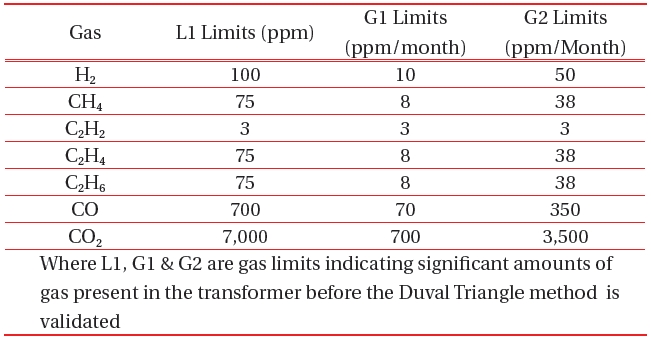
Limit and generation rate per month [5].
lem is confirmed [7].
The Key-Gas analysis method could present damage levels of the power transformer and its cause by analyzing the levels of combustible gases. The gas levels for this method are given in Table .8. The method defines the level of damage by considering all of the total combustible gases, which can be classified in different ranges.
4. COMPUTER PROGRAM AND IMPLEMENTATION
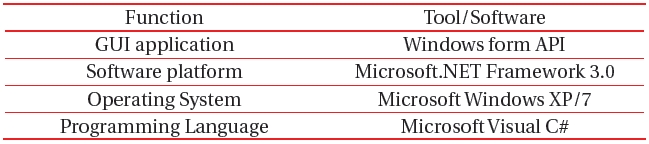
The development tool used in the DGA fault interpretation computer program is given in Table 9 below.
4.1 Method of fault analysis classification
The fault interpretation results from each method are used in the main interface to determine the fault analysis classification by using a single fault analysis to find the common result. As seen in Table 10, each fault is represented by code (from F1-F6) as a conclusion from each method.
[Table 8.] Combustible gas in key gas analysis [6].
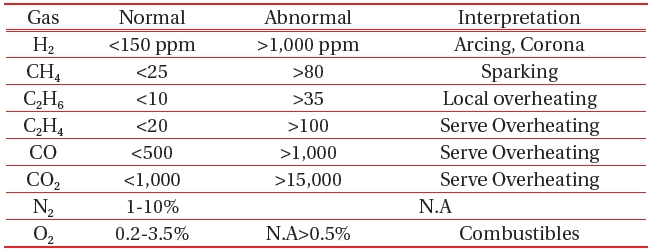
Combustible gas in key gas analysis [6].

Development tools.
[Table 10.] Codes of fault analysis classification [6].
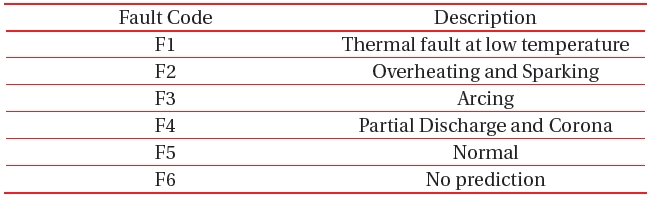
Codes of fault analysis classification [6].
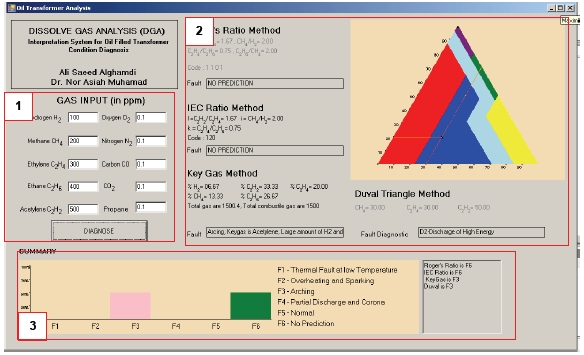
The software is implemented in a single unit GUI as shown in Fig. 2 and performs the analysis after values have been entered and the user clicks the “DIAGNOSE” button.
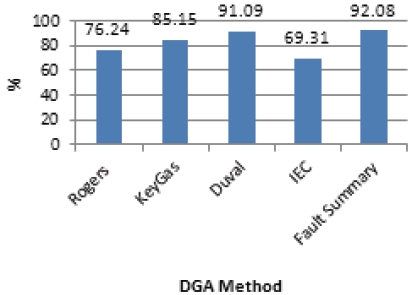
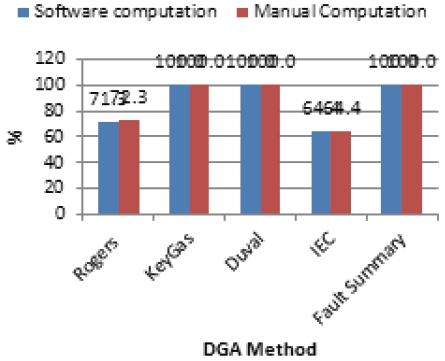
After the software has been developed and tested with data which consists of 101 different oil gasses conditions, the results were compared with that of manual calculation. The data used are oil samples from oil-filled transformers under several conditions. The summary of the results are presented in Figs. 3 (accuracy analysis of program) and Fig. 4 (percentage prediction). The fault summary gives the percentage of accurate fault predictions obtained compared to the manual computation.
From the results, the software calculations indicate that the software validates the manual input calculations because it con-
forms to most of the manual results obtained. Lack of method accuracy, and computation and data entry errors may be attributed to the differences noted in Fig. 4. The gas codes and ratios used to develop this computer software cannot be ruled out as a possible contributor to the observed difference in Fig. 4.
The computer based oil insulation assessment software has been successfully developed. Analysis compared the accuracy and predicted results between each method utilizing both manual calculation and software calculation. The test concludes that the accuracy of fault-analysis classifications increased the accuracy of DGA methods by 20%. The no prediction result had been reduced down to 0% rather than using one single DGA method. The software also demonstrates that the DGA analysis faster since only the gas input data is required to arrive at a valid prediction.
6.1 Advantages and limitations
The advantages of using computer- based software for DGA analysis on oil filled insulation transformer are:
It utilizes four methods to predict faults in transformer insulation oil in the same time
It reduces the time to calculate and analyze oil-filled transformer faults by using DGA system.
It gives better and more accurate results to confirm the transformer incipient fault.
It reduces the human-error on interpreting the fault on DGA system.
6.2 Recommendation for further work
The use of four (4) methods of the DGA technique has fulfilled the requirement process to determine the fault type, but adding more DGA diagnostics is necessary. Accuracy is the main concern of fault analysis determination t. Although the accuracy in this developed system was sufficient, implementation of accurate algorithms are needed. The process of the fault decision in this computer- based software is based on a general percentage mechanism, where each of the methods has the same percentage of accurate predictions.
This research application in the real world will facilitate an easier fault prediction process in DGA analysis techniques. The implementation of online systems and continuous monitoring systems based on this computer- based software could be performed to improve its use in the real world. The use of online and monitoring systems have already shown that detailed on-site analysis is necessary for the management process of transformer [8,9].

![Common types of fault and key gases in DGA [5].](http://oak.go.kr/repository/journal/11384/E1TEAO_2012_v13n5_229_t001.jpg)
![Roger’s ratio gas [5].](http://oak.go.kr/repository/journal/11384/E1TEAO_2012_v13n5_229_t002.jpg)
![Roger’s ratio code [5].](http://oak.go.kr/repository/journal/11384/E1TEAO_2012_v13n5_229_t003.jpg)
![IEC basic gas [5].](http://oak.go.kr/repository/journal/11384/E1TEAO_2012_v13n5_229_t004.jpg)
![IEC basic code [5].](http://oak.go.kr/repository/journal/11384/E1TEAO_2012_v13n5_229_t005.jpg)
![Duval triangle legend [7].](http://oak.go.kr/repository/journal/11384/E1TEAO_2012_v13n5_229_f001.jpg)
![Duval triangle legend [7].](http://oak.go.kr/repository/journal/11384/E1TEAO_2012_v13n5_229_t006.jpg)
![Limit and generation rate per month [5].](http://oak.go.kr/repository/journal/11384/E1TEAO_2012_v13n5_229_t007.jpg)
![Combustible gas in key gas analysis [6].](http://oak.go.kr/repository/journal/11384/E1TEAO_2012_v13n5_229_t008.jpg)
![Codes of fault analysis classification [6].](http://oak.go.kr/repository/journal/11384/E1TEAO_2012_v13n5_229_t010.jpg)