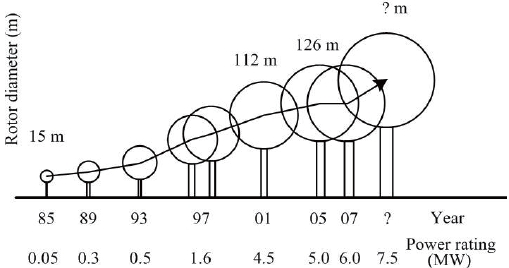
Recently, there has been a growing interest in wind energy as it has outstanding advantages: ample, renewable, wide distribution, cheap, reducing toxic gas emission. The wind turbine systems with larger blades are preferred to harvest more energy as the size of the wind turbine blades is directly related to their capacity of energy generation, and cost efficiency. Thus, the blade has become larger and slender. Figure 1 shows the wind turbine size evolution over the years (Ciang at al., 2008). As the wind turbine blades have become slender and larger, composite materials with light weight and low density have been applied to these large blades. Thus, the structural test of wind turbine blades has grown in importance. In the structural design phase of wind turbine blades, the structural tests (Hahn at al., 2002; Jensen et al.,
2006; Jorgensen et al., 2004; Rumsey and Paquette, 2008) were carried out to evaluate the bending stiffness, life time, and simulate extreme load events using the conventional sensors including electric strain gauges (ESGs). However, the conventional sensors are easily influenced by the electromagnetic interference (EMI), and the cables from the sensors can disturb the accurate measurement of structural performances. In this study, one of the fiber optic sensors, the fiber Bragg grating (FBG) sensor was used for the structural performance tests, i.e., static and dynamic tests of the composite wind turbine blade as they can reduce the weak points of the conventional sensors. The FBG sensors have greater advantages compared to the conventional sensors such as excellent sensitivity, a wide dynamic range, high reliability, small size, capability of multiplexing, absolute measurement and immunity to EMI. The FBG sensor can also be used to monitor the state of the structures steadily during their operation.
Meanwhile, full scale structural tests of wind turbine blades require high testing cost, a lot of time, and a large space. Full scale tests are necessary to investigate the structural characteristics of the blades, but full scale structures cannot be manufactured in sufficient number due to time and cost limitations. Thus, a separate set of test as an alternative, especially, a down scale test of blades, is required to reduce the disadvantages of the full scale test. In this study, the down scaled composite wind turbine blades, the 1/23 scale of the 750 kW composite blade, was used for the structural performance tests to predict the structural behavior and also to verify the capability of FBG sensors. Various sensors and measuring instruments were installed on/in the wind turbine blade for test verification. In static tests, the deflections along the blade were predicted with simple beam theory and quadratic fitting method by using the embedded FBG sensors. They were compared with those obtained from the measuring instrument and conventional sensors such as a laser displacement sensor (LDS) and ESGs. In dynamic tests, natural frequencies of the blade were measured from the embedded FBG sensors. They were compared with those obtained from the laser Doppler vibrometer (LDV) to achieve the verification.
An FBG sensor is a type of an optical fiber sensor that includes a distributed Bragg reflector as a component. This reflector consists of a short segment of optical fibers. The segment reflects specific wavelengths of light, and transmits other wavelengths. The principle of an FBG sensor is based on the shift of the reflected light at a certain wavelength. This wavelength satisfi es the Bragg condition when strain or temperature changes occur in the Bragg grating elements. The Bragg condition is expressed as follows:

Here,

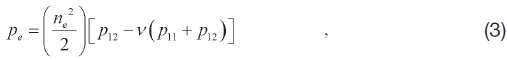
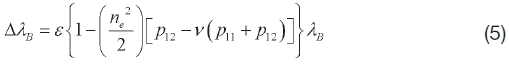
In this equation, α represents the coefficient of thermal expansion of the fiber core, ξ is the thermo-optic coefficient, and
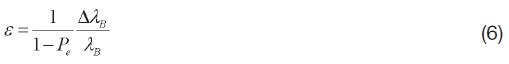
The strain of a structure can be calculated by measuring the wavelength shift (Δ
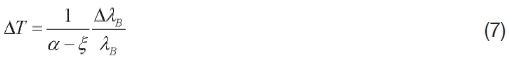
The temperature also can be obtained simply by measuring the wavelength shift (Δ
3. Composite Wind Turbine Blade
3.1 Fabrication of the wind turbine blade
The composite wind turbine blade used in this study was the 1/23 scale of the 750 kW composite blade. The blade was composed of a shear web and two skins, i.e., upper and lower surface. The shear web is made up of a composite sandwich structures which consist of balsa woods and biaxial glass fabric reinforced polymers (GFRPs). The skins are made up of composites with unidirectional GFRPs along the blade, and tri-axial GFRPs near the root of the blade. The three components were fabricated through vacuum
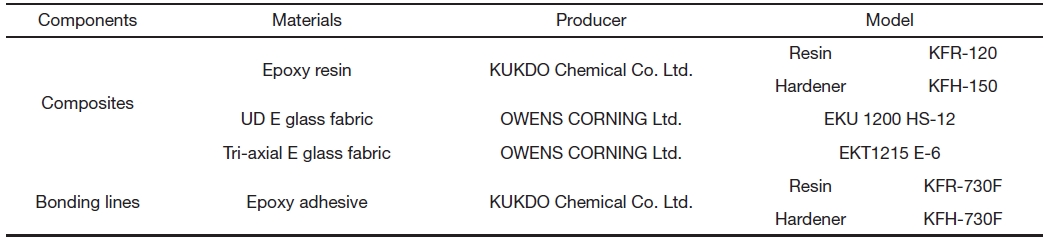
[Table 1.] Materials used in the wind turbine blade

Materials used in the wind turbine blade
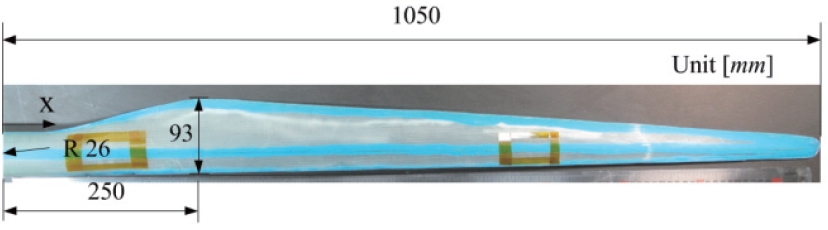
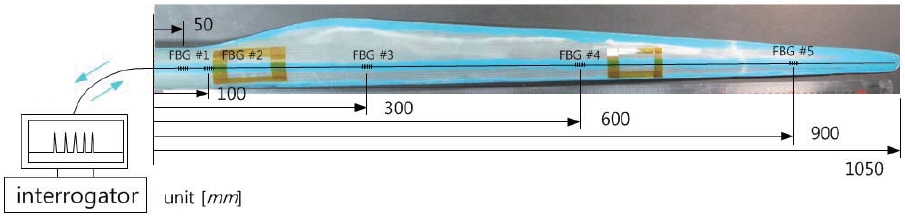
assisted resin transfer molding (VARTM) process, and were bonded together using epoxy adhesive. Table 1 presents the component materials used in the blade. The epoxy resin, KFR- 120 was mixed with hardener, KFH-150. They were cured at 80℃ for 24 hours during the VARTM process. Figure 2 shows the pressure side of the fabricated blade and its dimensions. The length of the down scaled wind turbine blade was 1,050 mm. The blade section was with the maximum chord length of 93 mm and it was located 250 mm apart from the root of the blade. The radius of the root of the blade was 26 mm.
Two kinds of sensors, FBG sensors and ESGs were installed in/on the composite wind turbine blade. The multiplexed FBG sensors which have five different Bragg grating elements were embedded in the adhesive layer between the shear web and the composite skin of the pressure side. Here, five different Bragg gratings were formed by the phase masks techniques (Hill et al., 1993) in the core of an optical fiber. They were multiplexed in line with the optical fiber. The five ESGs were positioned on the composite skin of the pressure side. Table 2 shows the details of the installed ESGs and the FBG sensors. Figure 3 presents the installation points of the FBG sensors. The position and wavelength in Table 2 indicate the distance from the root to the installation point of the sensors, and the initial wavelength of the FBG sensors, respectively.
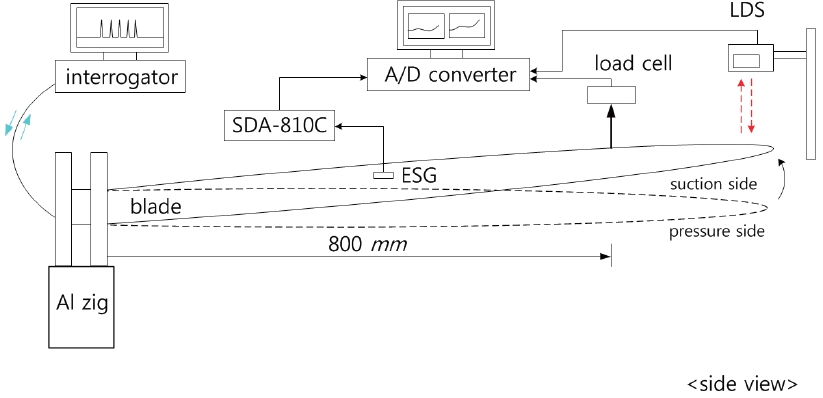
The structural tests such as flapwise quasi-static loading test, and edgewise tests are the most prevalent methods used to predict the structural behavior. In this study, the flapwise static test was carried out to investigate the static behavior of the blade. Figure 4 shows the schematic of the static bending test of the blade.
The static load with a control rate of 4.0 mm/min was applied at the loading point, 800 mm apart from the root of the blade. The FBG sensors and ESGs measured the strains at the installation points of the blade while the LDS, LB-041, measured the tip deflections of the blade. The commercial
[Table 2.] Description of the installed sensors
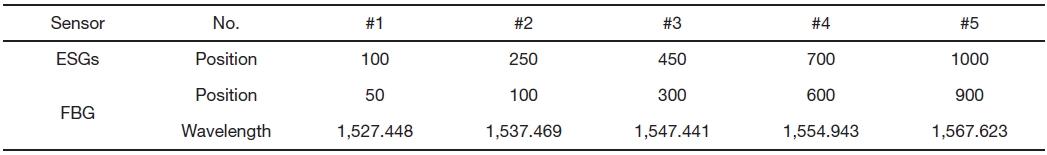
Description of the installed sensors
interrogator, SM-130 was used to obtain the strain from the FBG sensors. SDA-810C was used to measure the strains from the ESGs.
4.2 Evaluated deflection of the blade
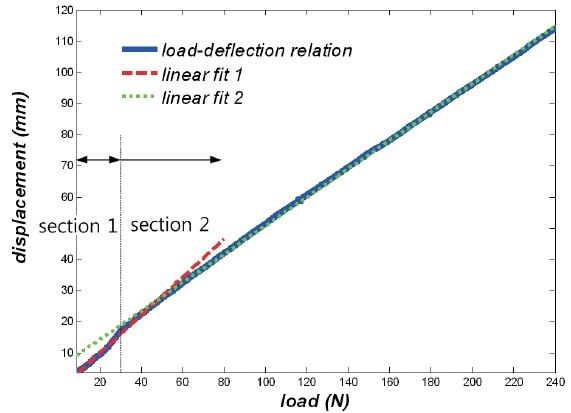
Figure 5 shows the relation between the applied load and the tip deflection of the down scaled composite wind turbine blade. The slope of the load-deflection relation decreased at 30 N as the static load increased. They changed from 0.609 to 0.455 corresponding to Sections 1 and 2 in Fig. 5. This represents that the bending stiffness increased. It seems that the reason for nonlinearity was due to the complex geometry of the blade.
Even though stiffness was changed at 30 N, it was small. The deflection was linearly changed after that point within the measuring section as shown in Fig. 5. Also, the maximum deflection of the tip was approximately 10% for the whole length of the blade. Therefore, for the evaluation of the blade deflection using the FBG sensor signals, the blade was assumed to be a simple beam with a small deformation. The deflection of the blade can be easily predicted with the assumptions. The strains between the two measuring points assumed to be linearly changed. Thus, the relationship between deflection and strain can be expressed as:

where,
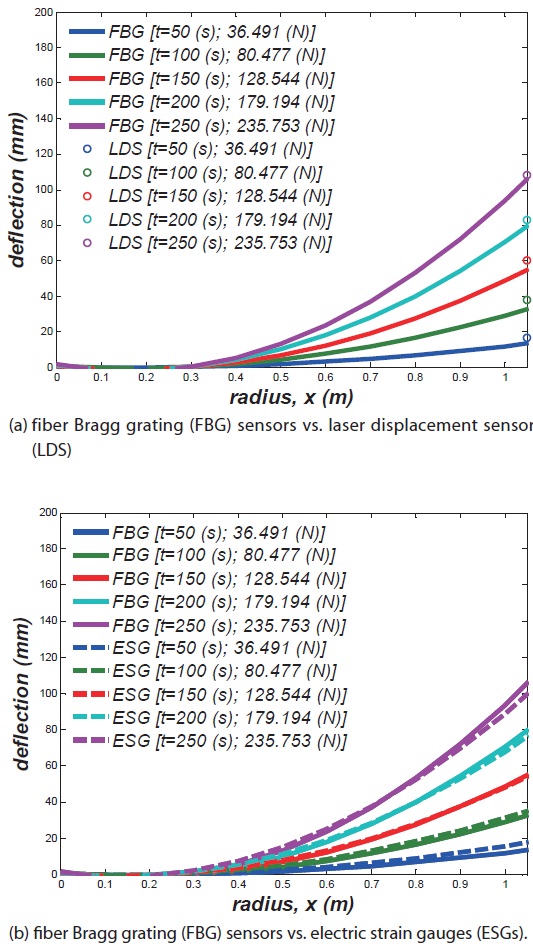
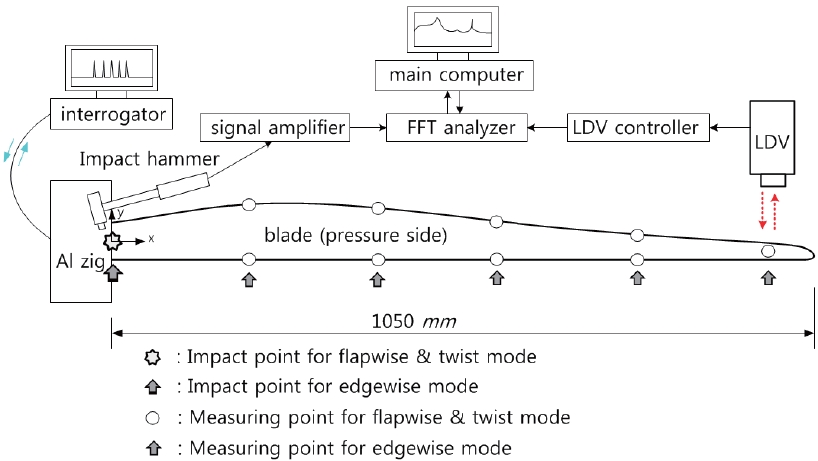
The deflections evaluated from the FBG sensors and the ESGs were compared to those directly measured from the LDS. All results were measured at 50 seconds, 100 seconds, 150 seconds, 200 seconds, and 250 seconds corresponding to 36.491 N, 80.477 N, 128.544 N, 179.194 N, and 235.753 N, respectively. Figure 6 shows the measured deflection of the down scaled wind turbine blade. Quadratic fittings were applied to the results of the FBG sensors and the ESGs when the deflections along the blade were indirectly evaluated with the assumptions. The tip deflections in Fig. 6 indirectly obtained from the FBG sensors were 13.029 mm, 31.930 mm, 53.527 mm, 77.484 mm, and 103.204 mm. The directly measured tip deflections from the LDS were 16.625 mm, 38.117 mm, 60.376 mm, 83.001 mm, and 108.191 mm as shown in Fig. 6a. The deflections from the ESGs are presented in Fig. 6b, and the tip deflections are indirectly obtained from the ESGs. They were 17.202 mm, 34.335 mm, 52.784 mm, 74.375 mm, and 97.503 mm. Both results were slightly different. These slight differences were caused by the assumptions of the small deflection and the linear change of strain between two measuring points, and experimental errors. Among the five deflections in Fig. 6a, the differences of tip deflections between the FBG sensors and the LDS according to each load were 3.596 mm, 6.187 mm, 6.849 mm, 5.517 mm, and 4.987 mm. Similarly, the differences of the tip deflection between the FBG sensors and the ESGs were 4.173 mm, 2.405 mm, 0.743 mm, 3.109 mm, and 5.701 mm as shown in Fig. 6b. However, the differences were small and ignorable considering the scale of the deflections with respect to the length of the blade. Therefore, it can be determined that the deflections of the blade from the FBG sensors were generally consistent with those from the LDS and the ESGs.
The shaker testing and impact testing among excitation mechanisms are the most common in modal tests. In this study, the impact hammer tests were carried out in order to obtain the dynamic characteristics of the down scalded wind turbine blade using the FBG sensors. Previous research for
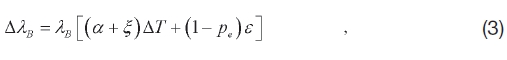
obtaining natural frequencies of the structure using the FBG sensors (Chang and Kim, 2011) was performed. The natural frequencies for flapwise and twist mode of the composite wind turbine blade was obtained (Kim et al., 2010). However, they used the surface mounted FBG sensors to obtain the natural frequencies. In this study, the natural frequencies of the blade were obtained by using the embedded FBG sensors. Figure 7 shows the schematic of the impact hamper tests of the blade.
The impact hammer used in the experiment was PCB 086C01. The impact excited at two impact points for flapwise and twist mode, and edgewise mode using the impact hammer. The strain responses for impact excitations were measured at the FBG sensors using the commercial interrogator, SM-130 of Micron Optics, Inc. The fast Fourier transform (FFT) was carried out using MATLAB. Additionally, the velocity signals according to the impact were measured by using the LDV to obtain dynamic characteristics for test verification. The
[Table 3.] Dynamic characteristics of the wind turbine blade

Dynamic characteristics of the wind turbine blade
LDV used in this test is Polytec OFV-303. The FFT analyzer, PULSE 3560-B-040 is used to perform FFT for the signals from the LDV and the impact hammer. Frequency response functions (FRFs) were computed between each of the inputs and outputs. The velocity responses of the excitations were measured at nine measuring points for flapwise and twist mode, at five measuring points for edgewise mode as shown in Fig. 7. Thus, FRFs could be expressed as mobility.
The sampling rate of all the instruments was set to 1 kHz. Thus, the frequency range from 0 to 500 Hz could be extracted according to a Nyquist frequency. The mode shape of the blade was obtained by assembling the FRF numerator terms.
5.2 Dynamic characteristics of the blade
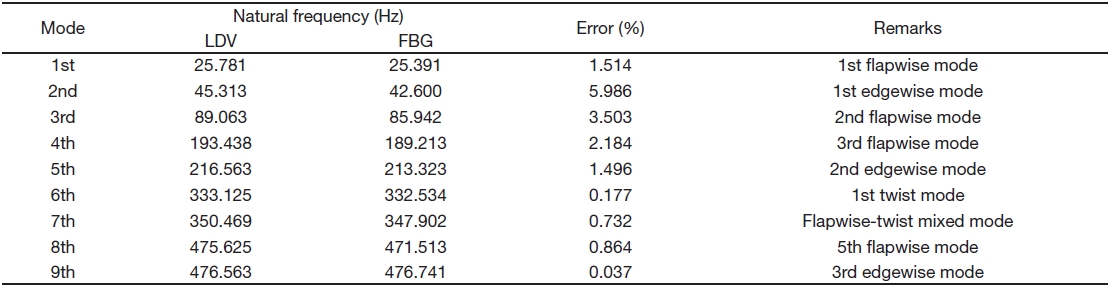
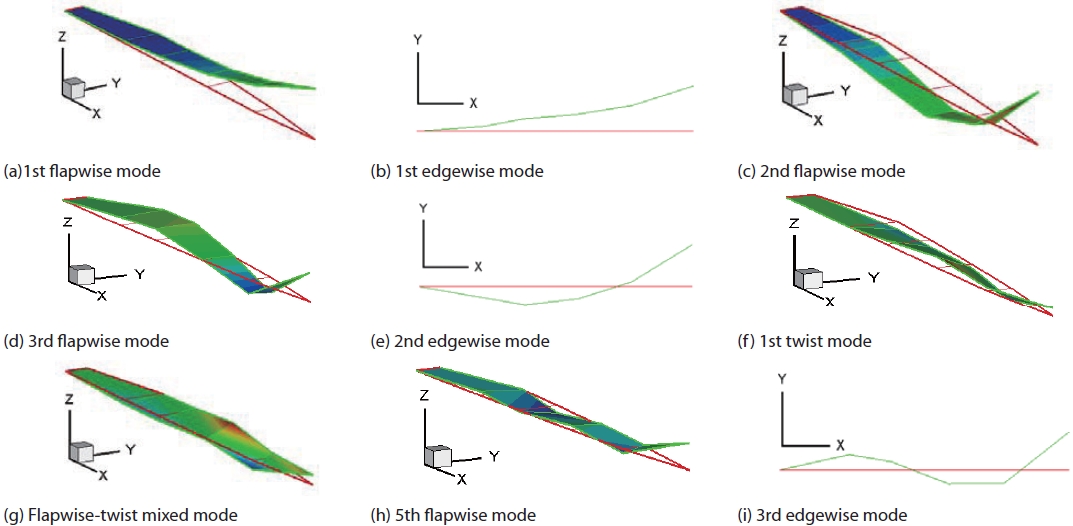
Table 3 presents the dynamic characteristics of the down scaled composite wind turbine blade. The nine modes corresponding to flapwise, twist, and edgewise modes were obtained from the embedded FBG sensors. The natural frequencies obtained from the FBG sensors were compared to those from the LDV for verification. A maximum error of 5.986% between two results was observed at the 2nd mode, but it is ignorable. Thus, it is determined that the natural frequencies from the FBG sensors well matched with those obtained from the LDV. Additionally, the mode shapes of the blade were obtained by using the LDV. Figure 8 shows the lowest nine mode shapes of the down scaled composite wind turbine blade. The LDV measured the nine modes namely; four flapwise modes, three edgewise mode, and a flapwise-twist mixed mode. Generally, even though glass/ epoxy wind turbine blades have different geometries, they have the similar tendencies of dominant mode shapes. First flapwise mode is first, followed by first edgewise mode, and second flapwise mode (Kim DH and Kim YH, 2011; Larsen and Forskningscenter Riso, 2002). The down scaled composite wind turbine blade in this study also presented the same order of the preceding discussion.
The static and dynamic characteristics of the down scaled wind turbine blade were investigated by the static bending test and the impact hammer test, respectively.
In the static tests, static bending tests were carried out to investigate the structural behaviors. The load-deflection relation was examined. The deflections of the blade were
indirectly and directly predicted using the embedded FBG sensors, the ESGs, and the LDS. The deflections from the FBG sensors according to the load were experimentally verified by comparing the deflections evaluated from the LDS and ESGs. They showed good agreement.
In dynamic tests, modal tests, impact hammer tests were performed. The natural frequencies corresponding to the nine mode shapes of the blade were obtained from the FBG sensors. The frequencies of the blade were compared to those obtained from the LDV to achieve the verification. They were generally consistent with each other. Additionally, the mode shapes of the blade were obtained by using the LDV. They presented similar tendencies of dominant mode shapes of other glass/epoxy composite wind turbine blades.
The embedded FBG sensors could measure both the static deflections and the natural frequencies of the down scaled composite wind turbine blade. These measured and predicted results obtained from the embedded FBG sensors can contribute to predict the structural behavior of the 750 kW full scaled wind turbine blades. The capability for measuring structural performances using embedded FBG sensors can save the cost of the structural test, time, and the effort to install the sensors and measuring instruments as the embedded FBG sensors can be suitable for both static and dynamic tests. Therefore, it is concluded that the embedded FBG sensors have greater potential to investigate the structural characteristics, i.e., static characteristics and dynamic characteristics of composite wind turbine blades.