Ab = propellant burning area
Acylinder = area of the separation cylinder
Ae = nozzle exit area
Apin = cross sectional area of fastening pins
At = nozzle throat area
a = burning rate constant
B = stress variable
C = strength variable
CD = discharge coefficient
CF = thrust coefficient
Cp = specific heat at constant pressure
Cv = specific heat at constant volume
D; D1, D2 = failure variable; for failure mode 1, for failure mode 2

e = burning distance
F1 = thrust of ejector
F2 = force generated by the separation cylinder
Fpin = force required to shear fastening pins
Mw = molecular weight
m = missile weight

n = burning rate exponent
P; P1, P2 = pressure; for the burning chamber, for the separation cylinder
Pa = ambient pressure
Pe = pressure at nozzle exit
Q = unreliability

R; R1, R2 = reliability; for failure mode 1, for failure mode 2
Rg = gas constant
rb = burning rate
sD = standard deviation of failure variable
T; T1, T2 = temperature; for the burning chamber, for the separation cylinder
Tf = flame temperature
tmin = time that separation must not occur
tmax = time that separation must occur
U = variable represents minimum limit in Eq. (5)
V = variable represents shearing of fastening pins in Eq. (5)
V1 = volume of the burning chamber
V2 = volume of the separation cylinder
v = ejection velocity
vR = required ejection velocity
W = variable represents maximum limit in Eq. (5)
Z = standard normal deviate
Z0 = lower integration limit in Eq. (4)
α = half angle of nozzle divergence cone
γ = specific heat ratio
ΔF = force difference
ρ; ρ1, ρ2 = gas density; for the burning chamber, for the separation cylinder
ρp = propellant density
σshear = shear strength of pin material
φ = probability density function of standard normal distribution
Φ = cumulative distribution function of standard normal distribution
The main rocket motor used in man-portable missiles must be ignited at a sufficient distance from the gunner due to the danger of its exhaust plume. Some devices are thus needed for ejecting the missile from the launch tube with a certain velocity. For this purpose, an additional small rocket motor (hereafter called “ejector”) having a very short burn time of less than about 0.1 second is generally employed. Once the missile is ejected, the ejector is preferably separated from the missile since no further function is to be performed and unnecessary weight acts against flight performance. Hence, the separation of a post-fired ejector has been a trend in highly maneuverable man-portable missiles. For the ejector separation, additional devices such as pyrotechnic actuated devices are widely used. As shown in Fig. 1, however, we have designed an ejector that can be separated from the missile without help of any additional devices.
The ejector must satisfy two requirements: a sufficient ejection velocity and a highly reliable separation. The ejector must expel the missile from the launch tube with a required velocity since a low ejection velocity can cause either the loss of the flight altitude of the missile or harm to the gunner due to main motor ignition at a too close distance. Meanwhile, the ejector must be separated from the missile after functioning since the onset of the next event of the missile is usually determined by whether or not the separation succeeds. If the separation fails, the next sequence such as the main motor ignition no longer proceeds because of safety, which results in the total mission failure of the missile. In this respect, the reliability on the ejection-and-separation of the aforementioned ejector has been a subject of practical importance.
Reliability can be defined as numbers representing the probability that an item will function without failure. In general, mechanical devices or electrical components can be assembled into the system after confirming their reliabilities by a test. In other words, those items can be repeatedly tested until the sufficient reliability data are obtained. On the other hand, it is impossible to confirm the functions for one-shot items such as the ejector prior to the use of actual situations because those items become useless once they are fired for the test. For this reason, the reliability estimation of this type of item has depended significantly on the number of firing tests available in a conventional method. For example, at least 10,000 items are needed for 99.99% reliability.
This conventional approach, based on a large number of firing tests with full scale items, would require considerable time and cost to achieve statistically significant reliability (Perkins and Fragola, 1989; Wood, 1983; Zhang and Shiue, 2001). Moreover, problems found during a test are very difficult to correct in terms of the schedule because firing tests are usually performed at the end of the development phase. Indeed, if the item were to be modified after many tests were conducted for calculating reliability, the accumulated data could become useless in reliability calculation since this approach is based on the assumption that all of the test items are the same. Due to these difficulties this type of item has long been used without confidence of whether it functions well. Further, so far no report has been made of any related research attempt to represent the reliability of the items. We will address the possibility of such research in the present work.
An alternative approach is available, based on a probabilistic design concept. The method not only provides the ability to estimate reliability without numerous firing tests but also can be applicable to all program phases. This approach regards all the variables included in the design, fabrication, and operation of the items as random variables having their own probability distributions instead of point values. We employ this probabilistic approach to overcome the long-standing troublesome problem of representing the reliability for the items. The objective of the present work was two-fold: (1) to introduce a particular separation mechanism of the newly devised self-separable ejector and (2) to present a methodology based on the probabilistic design method known as a stress-strength model for predicting the reliability of the ejector. Particular subjects of interest were what reliability value is and which variables dominantly affect reliability. For this purpose, Monte Carlo (MC) simulation is employed. The current approach can, in general, be extended to various other one-shot items.
Figure 1 is a schematic of the ejector. The ejector has the same configuration with a typical rocket motor, consisting of the igniter, propellant charge, combustion chamber, and nozzle, except for the separation cylinder which is assembled between the missile and the combustion chamber having orifices. The ejector is fixed at the aft end of the missile by fastening pins. Here, we designate the combustion chamber as 1 and the separation cylinder as 2.
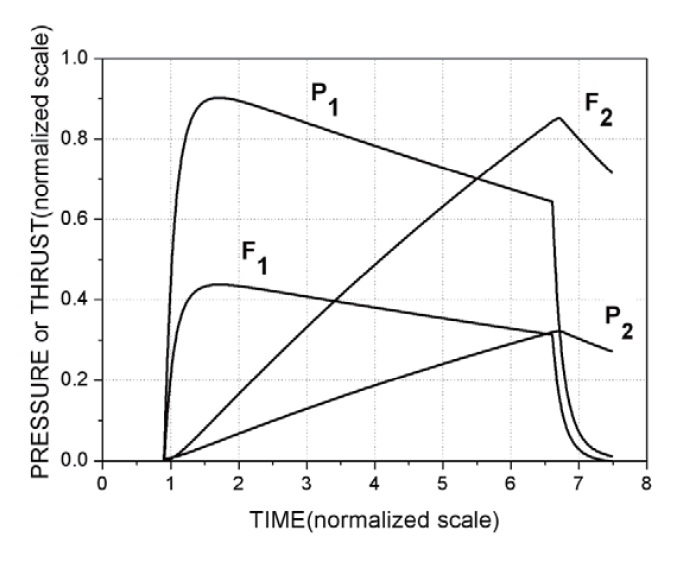
The thrust F1 is generated in proportion to the nozzle throat area and the gas pressure P1 which is generated by burning propellant in space 1 with volume V1. This thrust is utilized for ejecting the missile from the launch tube. Some of the combustion gas generated in space 1 can flow into space 2 with volume V2 through the orifices. Also, the force F2 is gradually generated and is proportional to the area of the separation cylinder and the gas pressure P2 by inflowing gas.. F1 and F2 are opposite to each other in direction. The four major parameters of P1, P2, F1, and F2 could be varied with time as shown in Fig. 2, and were dependent on many design variables including the burning area of propellant charge, burning rate of propellant, size of nozzles, orifice size, area of the separation cylinder, and so on. The fastening pins fixing the missile and the ejector are cut by the interaction of F1 and F2, which results in the separation.
A specific feature of the ejector is that a premature separation should be avoided. In the present work, the premature separation can be defined as the case when the
separation occurs even though the missile does not reach the required level of ejection velocity. If the separation occurs when the propellant of the ejector is still burning, the leftover impulse can no longer be utilized to thrust the missile because the contact between the missile and the ejector is broken. The required ejection velocity is preferably achieved by using the minimum amount of propellant since excessive propellant can incur detrimental effects in terms of a large back-blast and a high chamber pressure. This can be interpreted to mean that the separation should occur near the point of the completion of web burn. This requirement can be met by the following separation mechanism.
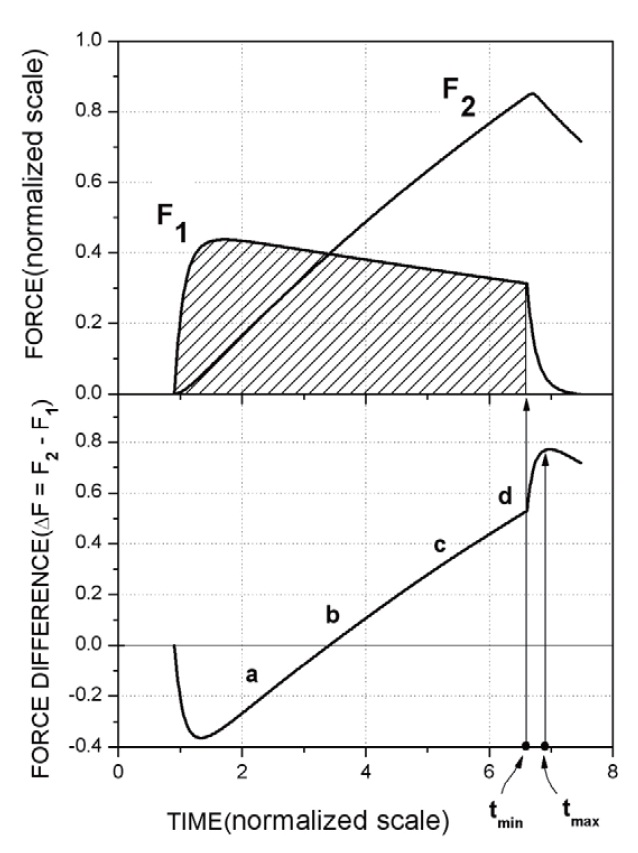
F1, assigned a minus sign, cannot act as the cutting of the fastening pins because the force was transmitted to the missile through the separation cylinder, not the pins; whereas F2, assigned a plus sign, can be exerted to cut off the pins. Because F2 is offset by F1 with the opposing direction, however, the force for cutting the pins can be developed only in a condition whereby F2 is larger than F1; that is, only when the difference of the two forces, ΔF = F2-F1, is positive. As shown in Fig. 3, the force difference varies with time. The cutting force did not exist since ΔF<0 before reaching the point of “b” where ΔF=0. Subsequently, difference continuously increased until the point of “d”, which is the point of web-burn completion, then rose sharply to the peak and then gradually decreased in the final stage. The drastic increase beyond the point of “d” occurs because F1 is more rapidly decreased than F2. This was attributed to the fact that P1 decreases very fast at the burn out of propellant whereas P2 decreases relatively slowly because the combustion gases flow out through the small orifices. A time point in which
the pins are cut can be controlled by the shearing force of the pins, Fpin. If the cutting force is greater than the shearing force of the pins, i.e., ΔF≥Fpin, the pins can be cut off and the ejector separation will occur.
The separation must occur between tmin and tmax as represented in Fig. 3. tmin is the lower time limit at which the separation must not occur. This limit can be determined by the impulse, which is the shaded area in Fig. 3, corresponding to the ejection velocity of
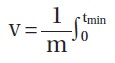
F1dt. The pins must not be severed before this limit is reached. It is preferable for tmin to be as close as possible to the web burn time. Meanwhile, tmax is the upper time limit at which the separation must occur, which corresponds to the maximum cutting force. The pins must be cut off before the reach of this limit.
3. Simulation Methodology for Reliability Prediction
3.1 Definition of failure modes
Many failure modes are possible in the function of the ejector, such as ignition failure, structural failure, overpressure, and too long burn time. However, only the
following two failure modes will be considered in this paper:
1) Failure mode 1: no separation of the ejector
2) Failure mode 2: insuffi cient ejection velocity
Failure mode 1 occurs when the pins are not cut off ; whereas failure mode 2 occurs when the premature separation occurs. Two assumptions were made. Firstly, the reliability values of all the failure modes involved in all of the components of the ejector are all one, except for the two failure modes mentioned above. Secondly, all of the failure modes are independent of each other. The overall reliability (Rt) can thus be regarded as the product of the reliability of failure mode 1 (R1) and the reliability of failure mode 2 (R2).
3.2 Probabilistic design method
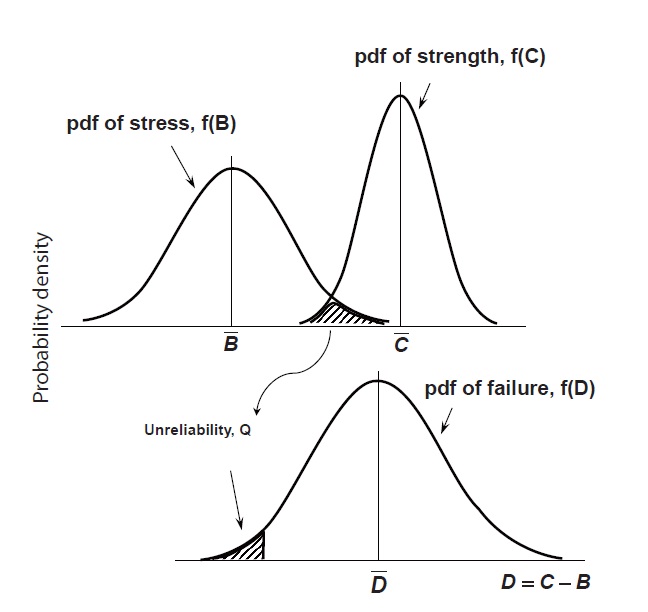
The failure modes of a one-shot item such as the ejector are normally characterized by a ‘static failure.’ In other words, when the item is operated or tested, there can be only two possible outcomes: a success or a failure. This nature of the static failure enables us to apply the probabilistic design method to reliability prediction. The most common type of model used to describe the static failure is known as the stress-strength model (Johnson, 1988; Kececioglu, 2003). According to this model, the failure function or failure variable, D, can then be simply defined as follows:

where C is “strength” as measured on an applicable scale and B is “stress” as measured on the same scale. The variable D is the diff erence between C and B. In this model, both C and B are not point values but random variables with their own
probability density functions (
If the stress exceeds the strength, i.e., B>C, failure may occur. Therefore, the overlapped region, shaded in Fig. 4, of the two distributions implies the unreliability, Q, as follows:

Since ‘1-Q’ gives the reliability, the reliability R is given by all the probabilities whereby the strength exceeds the stress or D is greater than zero. Therefore, R can be calculated by the integration of the
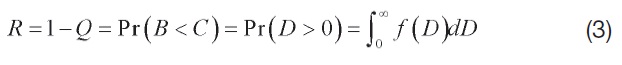
If the variables of C and B are independent and normally distributed, the probability density D can also be assumed as normally distributed with its mean value

and the standard deviation sD. Under this assumption, the R of Eq. (3) can be simply evaluated using probability information of the standard normal distribution as shown below:

where Z is a standardized variable of D and

is the lower integration limit.
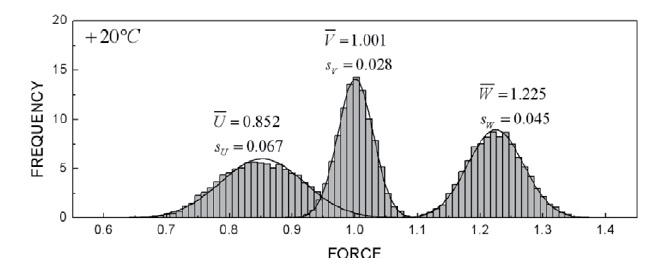
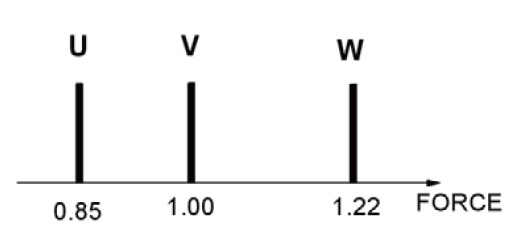
To predict reliability of two failure modes, a simulation model based on the probabilistic design method was proposed. In the simulation model, the three major variables of tmin, tmax, and Fpin were considered, which aff ect the ejector’s function. The two limits of tmin and tmax were converted into U and W, respectively, to have the same unit with the force Fpin as given in Fig. 5 and Eq. (5).
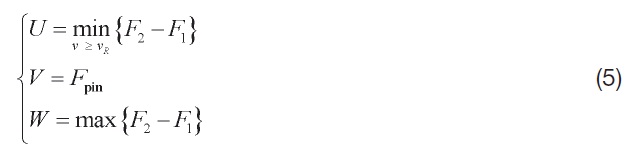
This expression helps us to make a model based on the probabilistic design method. In the above equation,
the brackets { } indicate the set consisting of the force diff erence F2-F1. This is possible by changing the viewpoint of time from continuous to discrete because there are infi nite combinations of F2-F1 with time as can be seen in Fig. 3. The operators of “min” and “max” denote the minimum and maximum value in the sets, respectively. The U is the minimum value of F2-F1 and the W is the maximum value of F2-F1. The fastening pins must not be cut off at the limit U for preventing the premature separation; whereas, they must be cut off at the limit W for the separation because there is no cutting force greater than the limit. The V is the value of the shearing force of the pins, which must be placed between the U and W for successful function without failures. In the present work, the V was determined to have a bias value closer to U, not a center between U and W, to give more weight to failure mode 1 than to failure mode 2.
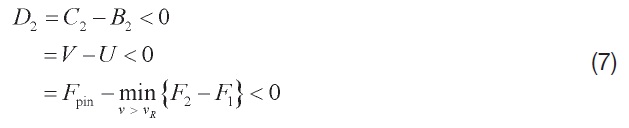
The two failure modes can be modeled into the form of Eq. (1) by using the definition of Eq. (5) as shown below:
1) Failure mode 1 (no separation of the ejector) occurs when V> W:
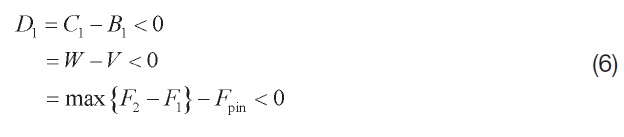
2) Failure mode 2 (insuffi cient ejection velocity) appears when V< U:
The subscripts of 1 and 2 of D, C, and B in the above equations indicate the relevant failure modes. In a deterministic design method, a safety factor is generally defined as

According to this definition, the safety factors for failure mode 1 and failure mode 2 were calculated as 1.22 and 1.17, respectively. It is important to note, however, that they give no information about the reliability.
In the models above, the variable B1 for failure mode 1 is identical to the variable C2 for failure mode 2, which are a function of the Fpin. Similarly, C1 is equal to B2, which are a function of F1 and F2, as given in Eq. (8):
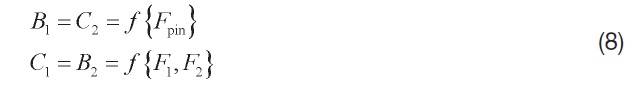
Eventually, the major design variables determining the ejector’s reliability are summarized: Fpin, F1, and F2. Of course, each of these variables is a function of more than one variable as shown below:


In Eq. (10), the thrust coefficient C
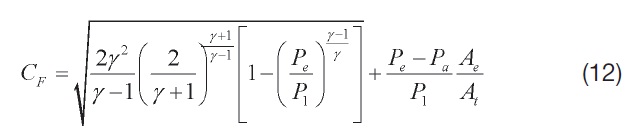
The Fpin in Eq. (9) can be simply obtained by shear test in a simulated condition using the real pins. The F1 and F2 in Eqs. (10) and (11) can also be obtained either by direct measurement through ground-firing tests of the manufactured ejector or by calculation of multiplying the area by P1 or P2 measured from the tests. However, due to the lack of the number of the ejector available for the test, it would be diffi cult, realistically, to obtain these data suffi cient to construct the
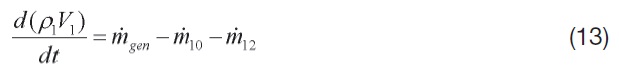
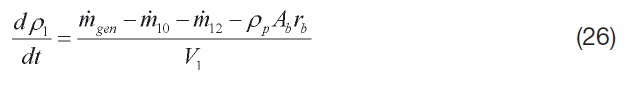
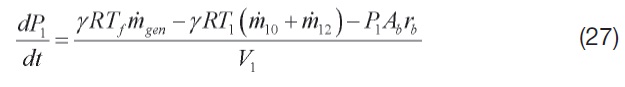
In terms of the physical model shown in Fig. 1, we can write the mass and energy conservation equations for each chamber by assuming that all flow variables are uniform inside each chamber and the combustion gas behaves as an ideal gas.
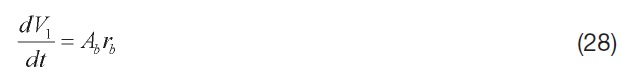
The conservation equations for chamber 1 are:
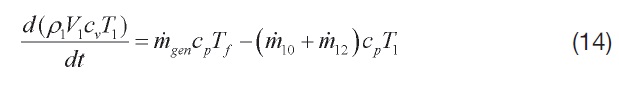

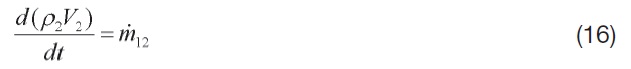
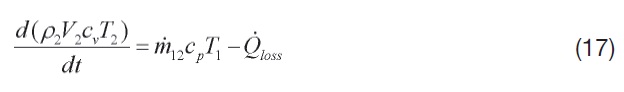
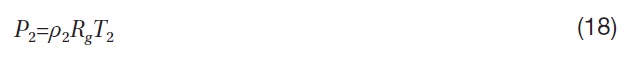
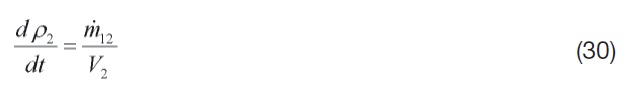
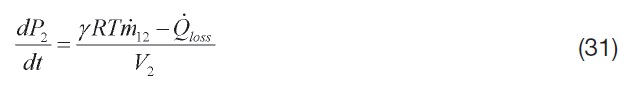
The conservation equations for chamber 2 are:
In the equations above, the mass flow rate generated by burning a solid propellant,

is evaluated by

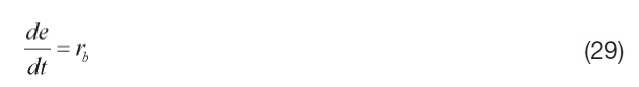
Here, the burning rate

The burning area
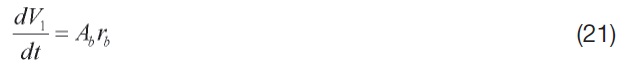
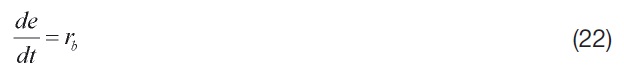
In order to terminate the combustion of the propellant, we need to determine the burning distance with time by the following equation. When
The mass flow rate flowing out of chamber 1 to the atmosphere through a nozzle,

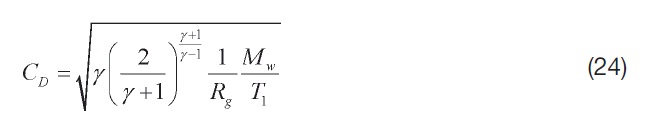
is evaluated by assuming that the nozzle flow is always choked.

Here, the discharge coefficient,
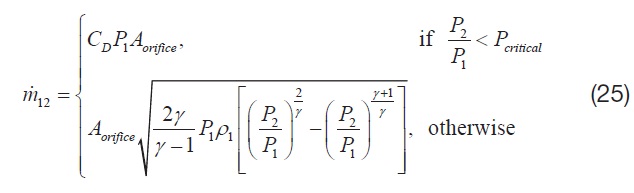
The mass flow rate flowing out of chamber 1 to chamber 2 through the orifices,

is dependent upon the pressures in chambers 1 and 2: If the pressure ratio of
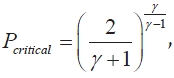
the flow is choked; on the other hand, if the pressure ratio of

can be evaluated by the following expression
The

in Eq. (17) is the heat loss of chamber 2 and cannot be neglected because the wet area of chamber 2 is considerably large compared to the small amount of hot gas flowing through the orifices. This is very difficult to evaluate theoretically and, thus, is empirically determined.
Now we have established the governing equations to evaluate
These ODEs can be solved by the Runge-Kutta integration scheme.
In order to predict reliability according to the models of Eqs. (6) and (7) based on the probabilistic design method, the probabilistic information on the variables of C and B (in detail Fpin, F1, and F2) is necessary, including the distribution shape and its parameters such as mean and standard deviation. Basically, the
1) Generate values of the design variables consisting of the forces of C and B according to their respective distributions
2) Calculate the values of the forces of C and B using the randomly generated values of the variables
3) Calculate the value of the force D from the forces of C and B
4) Repeat steps 1 to 3 n times to obtain the pdf of D
Consequently, the reliability of failure modes can be calculated from the
4.1 Verification of internal ballistics calculation
It is necessary to verify the internal ballistics model since the present work is based on the calculated result of P1 and P2 instead of the result of the ground-firing test of the ejector per se. Figure 6 represents a comparison between the firing-test result and the deterministically calculated result using the internal ballistics model at +20℃. The correction factors, which for convenience were not shown in the governing equations, were used for better fitting of the results of the experiment and calculation. Agreement in the major performance by the calculation and experiment was relatively good, which gives validity to the present internal ballistics model.
The MC simulation was carried out at the temperatures of -40℃, +20℃, and +60℃ to predict the reliability of each failure mode and to identify the most important design variables on reliability. Each simulation consists of n = 10,000 trials to obtain the
mode. In each trail, the U in Eq. (3) is determined as ΔF at the time point when the impulse, by time integration of thrust F1, reaches the level equivalent to the required velocity. The W is obtained as a maximum of ΔF by checking the value in every time increment. The V is randomly sampled in the specified distribution, based on the shear test of the pins. All the design variables and their respective distributions used in the simulation are listed in Table 1.
The
[Table 1.] Input variables treated as a random variable in the simulation
Input variables treated as a random variable in the simulation
Figure 8 represents the frequency distributions of the variables of U, V, and W obtained from the simulation at a condition of +20℃. Those at -40℃ and +60℃ were not presented here since they were similar to that of +20℃.
The frequency distribution of each variable showed a good fit with a normal distribution function (solid line). It was observed that the distribution width of V was narrow whereas those of U and W were relatively broad. This was attributed to the difference of the variance extent and the
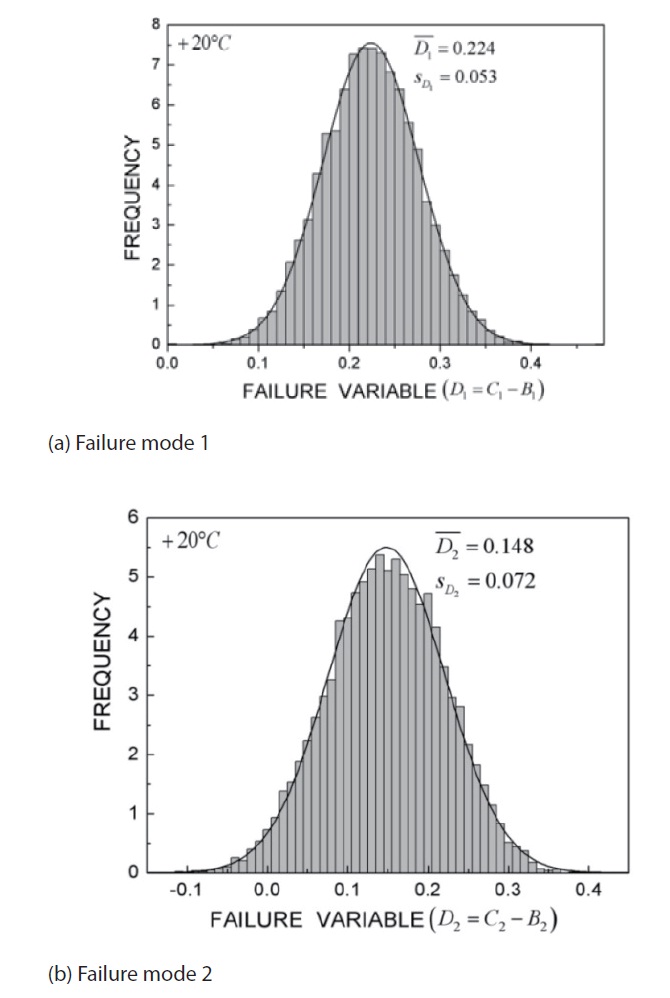
[Fig. 9.] Distribution of the failure variable at 20℃ for (a) failure mode 1 and (b) failure mode 2.

number of design variables consisting of each variable. For example, while V depends only on the diameter and the material strength of the fastening pins with a small variance, U and W are affected by many variables such as nozzle throat size, propellant grain dimension, and propellant burning rate with a large variance. The overlapped region of the distributions of V and W, corresponding to failure mode 1, was smaller than that of V and U, equivalent to failure mode 2. These regions can be expressed in another form of failure variable D as shown in Fig. 9.
It was also shown that D1 and D2 conform to the normal distribution. Because Eq. (4) is based on the assumption of a normal distribution, this consistency gives the validity of reliability prediction in the present work. According to Eq. (3), the position of zero at the
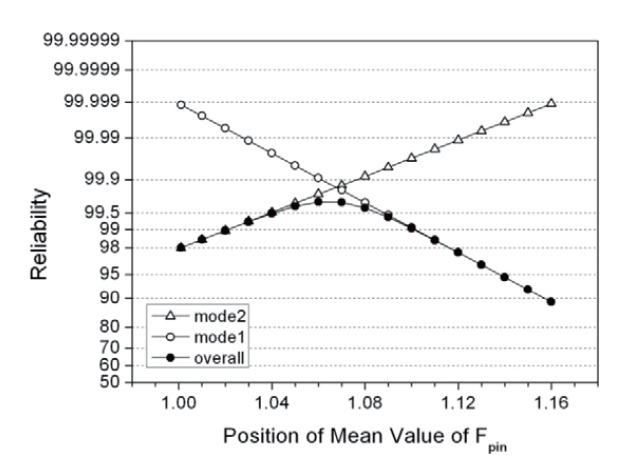
The reliability can be improved up to 99.7% by moving the mean value of V toward W (reducing the weight of failure mode 1) in the design (Fig. 10). This operation, however, is accompanied by the decreasing of the reliability of failure mode 1 having more importance. Figure 10 represents the calculation result showing the effect of the mean of V (i.e., Fpin) on reliability. This calculation was performed whereby the values of

varying with the mean value of V, were substituted into Eq. (4) while the standard deviations of the three variables (U, V, and W) and the means of U and W
[Fig. 10.] The dependence of the reliability of each failure mode variedwith the mean value of Fpin.

were fixed. As found in Fig. 10, a strong dependence of the mean value of Fpin on reliability implies that the strength and diameter of the pins were the most important variables of the ejector.
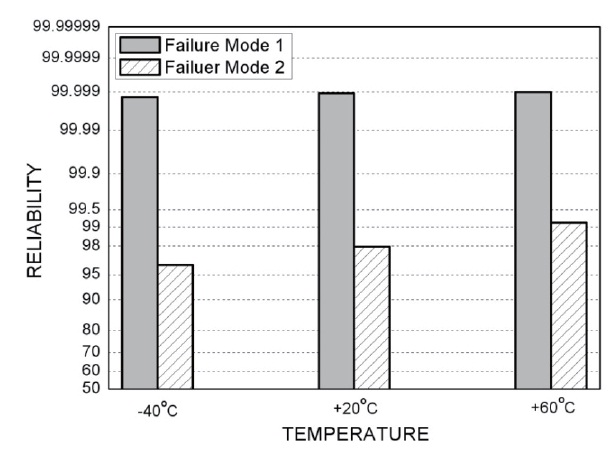
Figure 11 shows the dependence of reliability on the temperature. With increasing temperature, the reliability of failure mode 2 increased from 96.3% to 99.2%, whereas that of failure mode 1 did not change significantly. This is because of a change at the mean value of U (Table 2). That is, as the temperature increased, the mean value of U moved too far from that of V such that the overlapped region of these two distributions was reduced, resulting in a reliability increase for failure mode 2. The reason why the change at the mean value of U occurs can be ascribed to the fact that the greater impulse is transmitted to the missile prior to separation, due to a higher burn rate of propellant at the higher temperature. It is interesting to note that the mean values of V and W and the standard deviations of all the variables remained almost unchanged regardless of temperature.
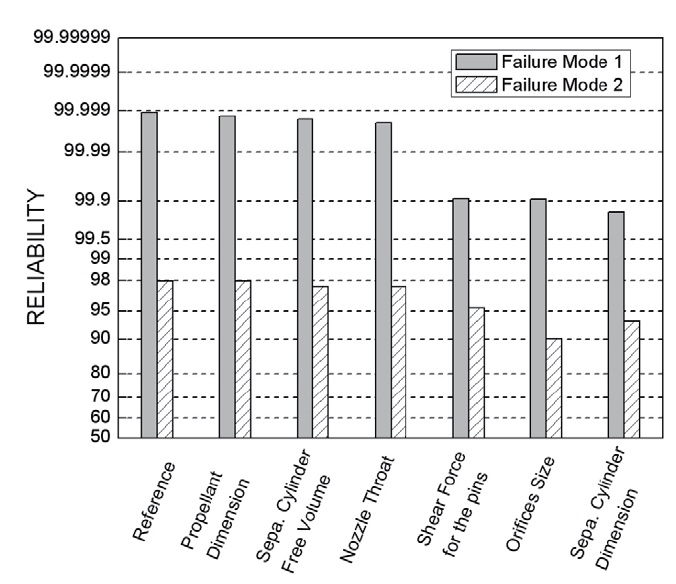
To determine which variables affect reliability most significantly, the sensitivity of each design variable on reliability was analyzed. For this, the simulation was conducted under a condition of changing only one variable at a time. The change was given whereby, while the mean
[Table 2.] Temperature effects on the distribution parameters of U, V, and W

Temperature effects on the distribution parameters of U, V, and W
of a variable remained the same, the standard deviation of the variable was increased to twice that of the reference. In the case whereby the variable is the dimension of a nozzle or an orifice, the dimensional tolerance given in the design was increased instead of the standard deviation. Figure 12 summarizes the simulation result for the impact of each variable on reliability.
As indicated in Fig. 12, the three design variables play an important role in the reliability of both failure modes: the separation cylinder diameter, orifices size, and the pin strength. An increase of the variance of the first two variables caused a noticeable decrease in both reliabilities. This is because the variation of ΔF becomes large by increasing the variance of the variables. In other words, an excessively large orifice or separation cylinder makes large such that the possibility of the premature separation increases; on the contrary, an excessively small orifice or separation cylinder gives a high chance of failure in cutting the pins, resulting in a separation failure. Similarly, the variance of the latter variable, depending on the diameter and material strength of the pins, also had a significant influence on reliability since excessively high or low pin strength increases the failure possibility in both modes. Therefore, the variance as well as the mean of the diameter and material strength of pins should also be precisely controlled for high reliability. Contrary to our expectation, however, the propellant grain size and the nozzle throat size have less influence on reliability in both of the failure modes. Through this analysis, one can identify important variables and thus give priority to the variables for controlling the dimension and tolerance of the each component in design or in fabrication processes.
In the present work, a particular separation mechanism of the newly devised self-separable ejector is introduced for man-portable missiles. Due to a limited number of items available to test, reliability evaluation on major functions of the ejector such as ejection and separation has become a challenging problem. In this respect, the methodology is presented based on a probabilistic design method to predict reliability without numerous firing tests. This method can not only provide advantage in respect of a schedule to correct problems in the design as well as in fabrication processes because it can be applicable to all program phases, but also gives information on important variables in performance. From the simulation result, the following conclusions were drawn:
1. It was found that the strength and diameter of the fastening pins were the most influencing variables on reliability. The sensitivity analysis result also revealed that the orifices’ size and separation-cylinder’s diameter have a considerable influence on reliability of both ejection and separation.
2. The internal ballistics model developed for calculating the performance of the ejector was in good agreement between the firing test results and the calculation results, which gives validity to the present work.