In modern war, combat aircraft survivability is an essential factor in the design of combat aircrafts, which are operated in an enemy’s air defense area. The combat aircrafts will be confronted with anti-aircraft artillery (AAA) and/or surfaceto- air missiles (SAM) from the ground. Improving their survivability has to be considered at the conceptual design phase. For instance, the A-10, which is an attack plane, was designed to withstand a surface attack during a low-altitude flight. The F-117, deployed as the first stealth aircraft in the United States, maximizes its survivability and reduces its observable rate using stealth performance as the underlying design concept. During the Gulf War, it was proven that aircrafts designed with survivability in mind were cost effective and were able to command the air. Therefore, survivability becomes an essential factor in design. Ball (2003) defines survivability as “the capability of an aircraft to avoid or withstand a man-made hostile environment.” Survivability comprises two parts: susceptibility and vulnerability. A simulation method is used for analyzing and researching survivability because of the limitations of testing in a real combat environment. A constructive simulation method, such as a war game simulation, is used for research on aircraft survivability. A modeling and simulation technique (M&S) is used in designing and training the aircraft against a weapon system. Yoon (2003) divide simulation to Virtual, Constructive, Live. In the war-game has used constructive simulation. This technique is economical and scientific, and it overcomes spatial and temporal limitations at a low cost.
In this article, we have studied calculations of aircraft susceptibility, using the M&S technique, in the case of a one-on-one engagement between a combat aircraft passing through an air defense network and its surface-based threat. In addition, a score method was used to study the qualitative tendency of susceptibility because of the following reasons: calculating susceptibility with many variables might have poor accuracy, and it is difficult to obtain specific quantitative data of a weapon system because of its characteristics. Choi and Lee (2011) proposed qualitative method to analysis susceptibility. Additionally, Kim and Lee (2011) have advanced the Choi’s study. We also apply the qualitative method and weighting factor to each score because every parameter has a different influence on susceptibility. Reliability of the weighted scores was increased using Monte Carlo simulations to obtain numerous samples that follow a normal distribution. The F-16 C/D, which is the main combat aircraft of the Korean air force, and a high speed weapon system (HSWS) were selected for this study. The SA- 10, an air defense missile made in Russia, was selected as the surface-based threat for the combat aircraft. A one-on-one engagement was simulated between the F-16 C/D and the SA-10. For the user’s convenience, a graphical user interface (GUI) was designed and developed using MATLAB.
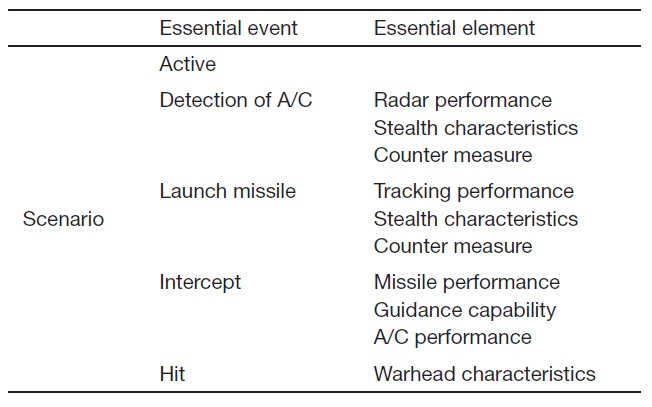
Ball (2003) defines aircraft susceptibility as "the inability of an aircraft to avoid the guns, approaching missiles, exploding warheads, air interceptors, radars, and all of the other elements of an enemy’s air defense that make up the man-made hostile mission environment." In other words, susceptibility is the change of state from the time of detection to the actual hit. The three factors that influence susceptibility are scenario, threat, and aircraft. A scenario comprises the essential event and the essential element. The essential event is that event, which brings an independent outcome. A radar detecting an enemy aircraft or the explosion of a proximityfused high-explosive warhead are examples of an essential event. An essential element is needed as a physical factor to determine the essential event. In the case of detecting the enemy aircraft, for example, the position and performance of radar are the essential elements. To calculate susceptibility, first, the combat aircraft and a threat have to be chosen. Then
[Table 1.] Essential events and essential elements

Essential events and essential elements
a scenario is set up.
2.2 Scenario, essential event, and essential element
This article studies the prediction of susceptibility in the case of a one-on-one engagement between the combat aircraft and the surface-based threat. The aircraft passes through the enemy air defense area to reach the area where its mission object is located. A threat is assumed to be a single shot scenario, that is, it starts from an event in which the threat radar detects a combat aircraft. If the aircraft is detected, the threat radar locks on and launches a missile or artillery which then approach the aircraft. The susceptibility scenario is considered completed when the projectile hits the combat aircraft. The essential events and essential elements included in this scenario are shown in Table 1.
2.3 Probability calculation method
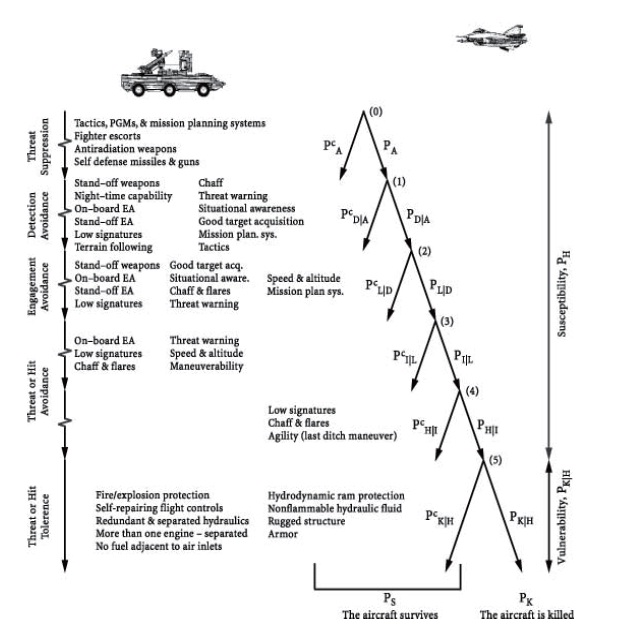
The calculation of probability for each phase follows the survivability kill chain introduced by Ball (2003). "The survivability kill chain" shown in Fig. 1 shows survival or kill by conditional probability in chronological order. The first step of the one-on-one engagement is activity. The probability of activity of the threat or the system, that is, PA, is calculated. If threat radar or systems are not active, the kill chain is terminated and the combat aircraft survives. Whereas, if the threat radar or system is active, the probability of detection of the combat aircraft is calculated.
PD|A, the probability of detection, depends on whether the
threat is activated or not. If the aircraft is not exposed to an active threat, the combat aircraft survives. However, in the case of an aircraft exposed to the threat radar, the scenario moves on to the next step of calculating the probability of launch of the missiles or projectiles, PL|D. If a projectile is launched, the conditional probability of intercept, PI|L, and the conditional probability of hit, PH|I, are calculated. Finally, the susceptibility of the combat aircraft, that is, PH, is the product of conditional probabilities of each of the phases as shown in Eq. 1.

The probability of each phase is calculated by comparison between the weighted scores of the parameters of the aircraft and threats. Each score of parameters generates a random number that follows a normal distribution and produces a probability distribution called Monte Carlo simulation. PA, an exception, is calculated using the Bernoulli probability that considers whether the surface-based threat is active or not. PA has a probability distribution with a value of normal distribution, 0.5, which is the default for the program developed in this study. However, the normal distribution of PA can be changed by users. In other words, the threat activity factor provided as input by the users can be the normal distribution of PA.. For example, if a user inputs 0.8 as a threat activity factor, the probability of threat activity is approximately 80% and PA is approximately 0.8. By varying the probability of threat activity, this method lets susceptibility to be calculated in comprehensive ranges. PH|I is calculated in the same way as mentioned.
2.3.1 The parameters related to susceptibility
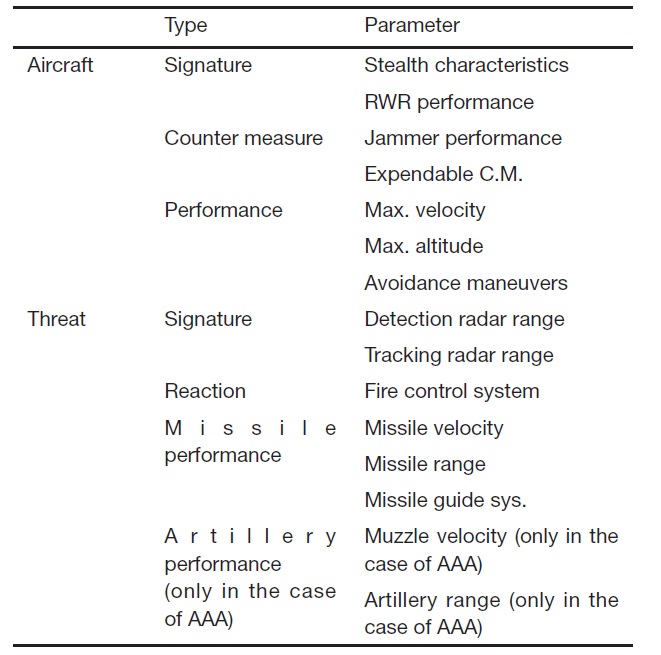
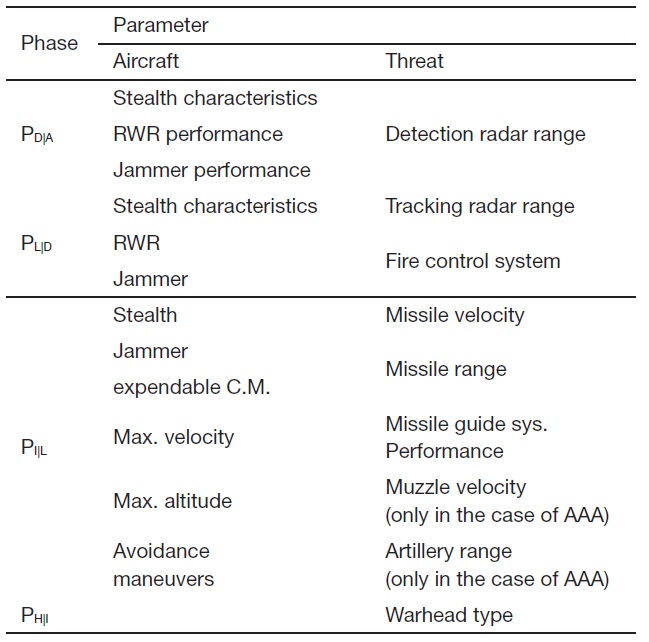
The parameters related to susceptibility can be obtained from the essential element of the scenario. The parameters of each essential element are shown in Table 2. A few of the parameters do not denote the whole performance of a weapon system. However, a performance trend can be observed by selecting some of the parameters that aff ect the susceptibility, such as stealth, jammer, and radar warning receivers (RWRs).
The stealth parameter includes radar cross section (RCS), IR signal, sound signal, and optical signal. The other parameters are as follows: (1) The parameters "max. velocity" and "max. altitude" are the aircraft’s maximum velocity and altitude, respectively. In the scenario, the aircraft flies through the enemy air defense area with maximum velocity and altitude. "Avoidance maneuvers," such as the maximum load factor, indicate the aircraft performance. The "detection radar range" refers to the maximum detection range of the threat radar. The "tracking radar range" represents the maximum tracking range of the threat tracking radar. The "fire control system" refers to the method of launching the projectile. The "missile velocity," "missile range," and "missile guide system" denote the missile maximum velocity, missile maximum range, and missile guide system performance, respectively. In the scenario, the missile flies at maximum velocity. The parameters "muzzle velocity" and "muzzle range" refer to the initial velocity and range of the muzzle, respectively, in the case of air-defense guns. The "warhead type" refers to the shape of the warhead. The aircraft hit probability depends on the warhead type.
To explain an evaluation model for analyzing a system mathematically, all structured factors and unstructured factors have to be quantified. However, most of the information on weapons is closed because of the characteristics of munitions. Thus, the score method is used for quantifying structured factors to calculate compared qualitative values in this effort. The probability is obtained using scores given to each parameter on the basis of data that are as objective as possible.
2.3.2 Score method
As all parameters have diff erent physical characteristics, it is impossible to score the parameters using consistent criteria. Thus, parameters are scored with different criteria in the comparable range. The range for parameters within the group, which consist of parameters of each phase, are comparable.
[Table 2.] Parameters for analyzing susceptibility

Parameters for analyzing susceptibility
Grouped parameters are shown in Table 3. The parameters needed for calculating the probability of detection are the aircraft’s stealth, jammer, and RWR, and the weapon’s detection radar range. For example, the scoring criteria of stealth come from the classification of the combat aircraft. The combat aircraft is classified into several generations, such as the third, fourth, and fifth, and those currently in use The fifth generation of combat aircraft, which first adopted stealth technology can be divided more specifically. For example, SR-71 is the first stealth generation (low observable 2 [LO2]), and F-117 is the second stealth generation (very low observable 1 [VLO1]) with B-2 bomber. The F-22 and F-35 are the most advanced stealth aircraft as the third generation stealth aircraft (VLO2). The third generation stealth aircraft scores 4 points, the second one 3 points, and the first one 2 points. The fourth generation combat aircraft (LO1) has a score of 1 point and the third one (conventional) that does not consider the stealth technology has 0 points. Each parameter is scored differently but the score ranges of parameters in the same group have to be identical. For example, if the score of the stealth parameter ranges from 0 to 4 points, then the jammer, RWR, and detection radar range parameters also must range from 0 to 4 points. The score criterion of all the parameters is shown in Tables 4 and 5.
2.3.3 Weighted score
Aircraft susceptibility is calculated by the score. Each parameter has a different effect on susceptibility. The degree
Parameter group
of effect is called sensitivity. To compensate sensitivity, a weighted score is adopted. The method of weighting is called the analytic hierarchy process (AHP). The AHP is a
[Table 4.] Score criteria of combat aircraft parameters
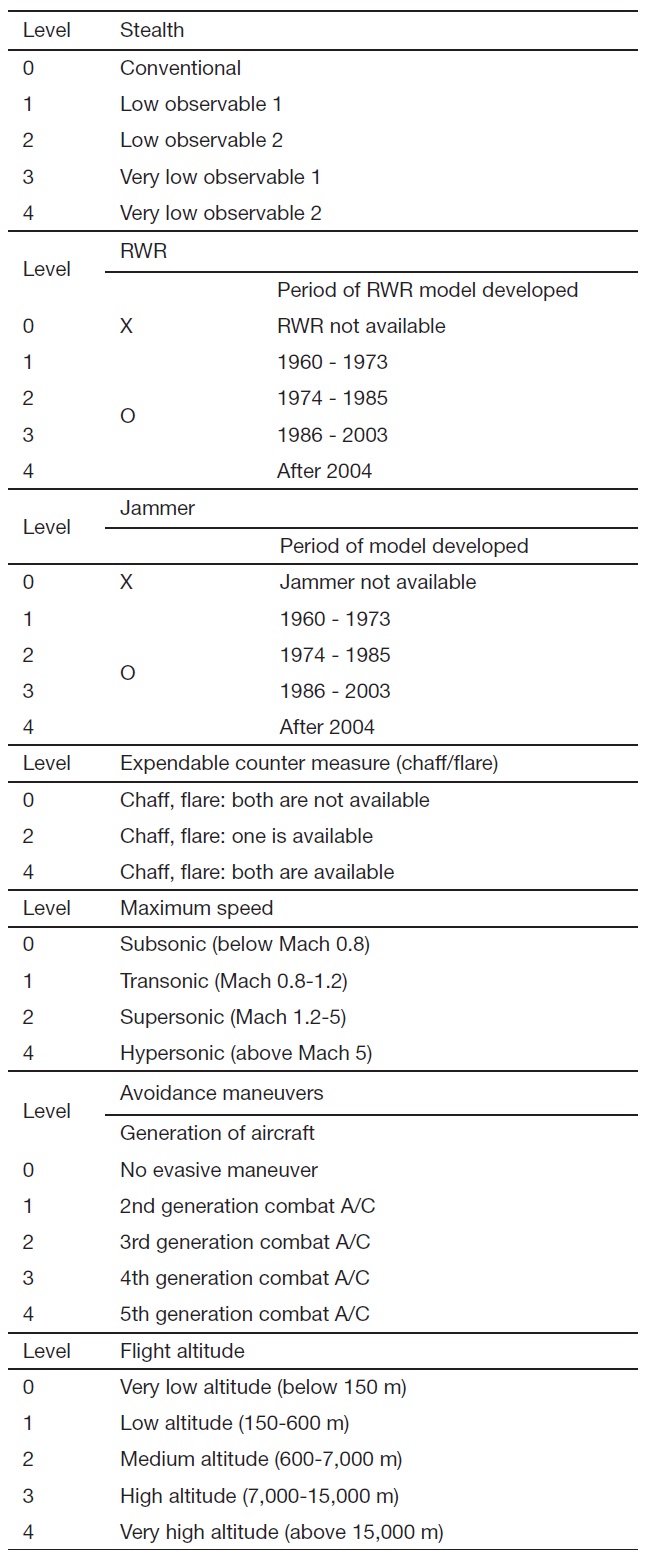
Score criteria of combat aircraft parameters
structured technique for dealing with complex decisions. Rather than prescribing a "correct" decision, the AHP helps decision makers find one that best suits their goal and their understanding of the problem. It is difficult to decide a priority from several factors at a time. However, it is relatively easy to choose one between the two rather than among several factors.
Thus, all factors are compared at once. Moreover, simultaneous equations are obtained as much as the number of factors when paired factors have a relative value of importance. Using this, the weight of each factor can be obtained by solving equations. In this study, this method has been applied. First, two parameters of the same group are selected. Second, these parameters are divided based on importance and have each relative value. Third, compared
[Table 5.] Score criteria of surface-based threat parameters
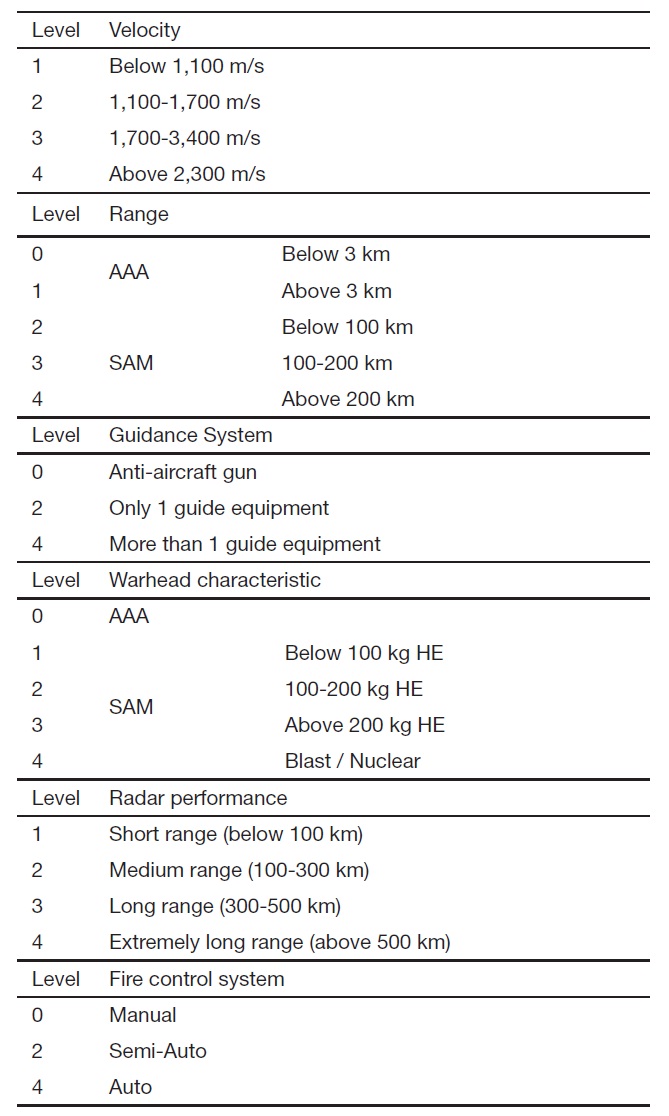
Score criteria of surface-based threat parameters
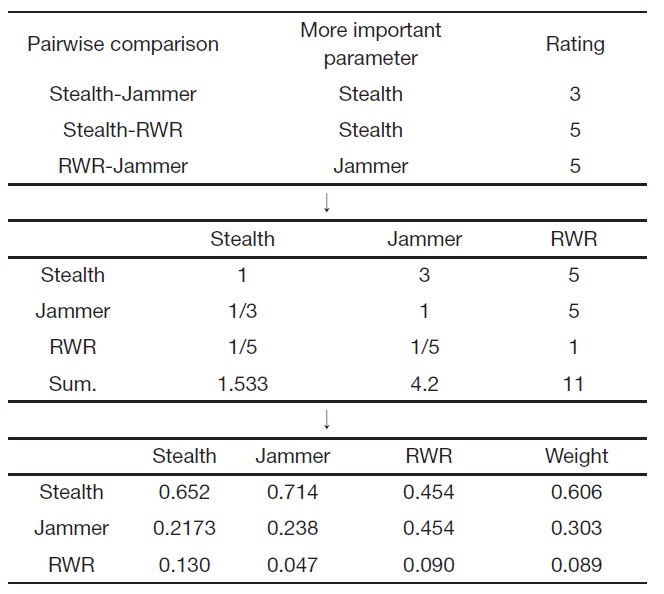
values make an n×n matrix and the vector sum of impact value is calculated. Finally, the sum of the values of the calculated vector sum divided by each parameter score is the weight. At the PL|D phase, parameters of the aircraft are stealth, jammer, and RWR.
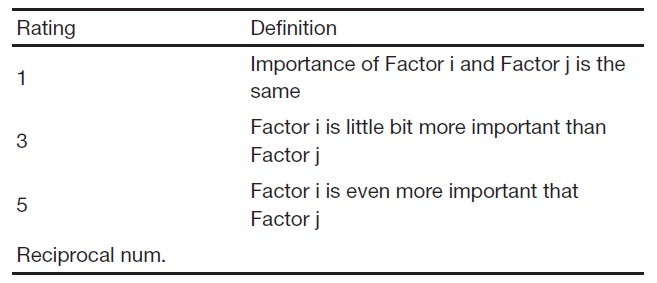
An example for calculating the weight of PL|D is shown in Table 6. The importance scale that has been used is a 5-point scale for AHP, which is shown in Table 7.
Finally, the sum of values of the calculated vector sum divided by each parameter score is the weight n = 3; thus, the consistency index (CI) is given by
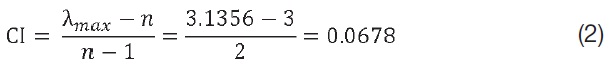
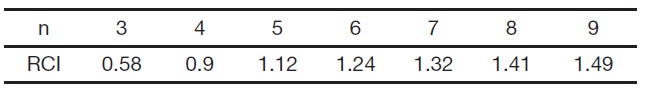
Again, Saaty (1990) proposed that we use this index by comparing it with the appropriate one. The appropriate CI is called the random CI (RCI). He randomly generated a reciprocal matrix using scales 1, 2, 3, . . . , 9 and got the RCIs to see whether it is approximately 20% or lesser. The average RCI of sample matrices is shown in Table 8.
[Table 6.] Process of get weight in PL|D phase with AHP method

Process of get weight in PL|D phase with AHP method

Scale definition
Then, he proposed what is called the consistency ratio (CR), which is a comparison between the CI and RCI, represented by the following equation:
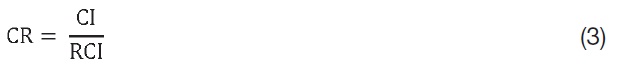
If the value of the CR is lesser than or equal to 20%, we
[Table 8.] Random consistency index (RCI)

Random consistency index (RCI)
[Table 9.] The experts survey result
The experts survey result
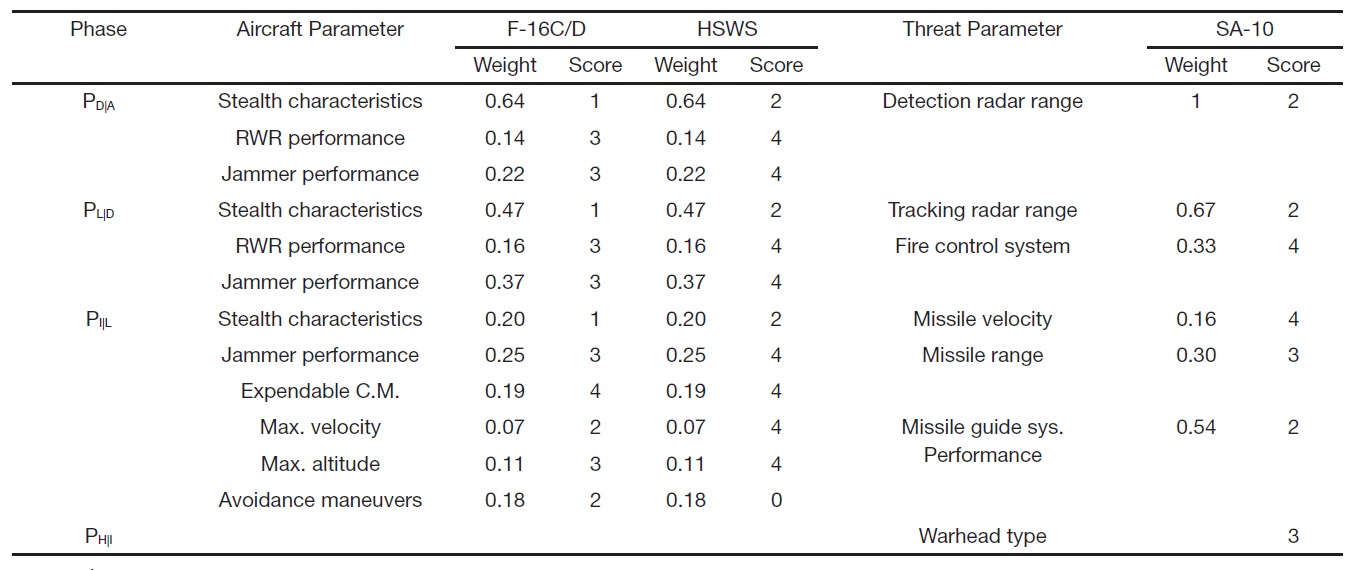
[Table 10.] Weight and Score of F-16 C/D and SA-10

Weight and Score of F-16 C/D and SA-10
need to revise the subjective judgment. For our previous example, CI is 0.0678 and RCI for n = 3 is 0.58, then we have . Thus, the CR of the example is consistent.
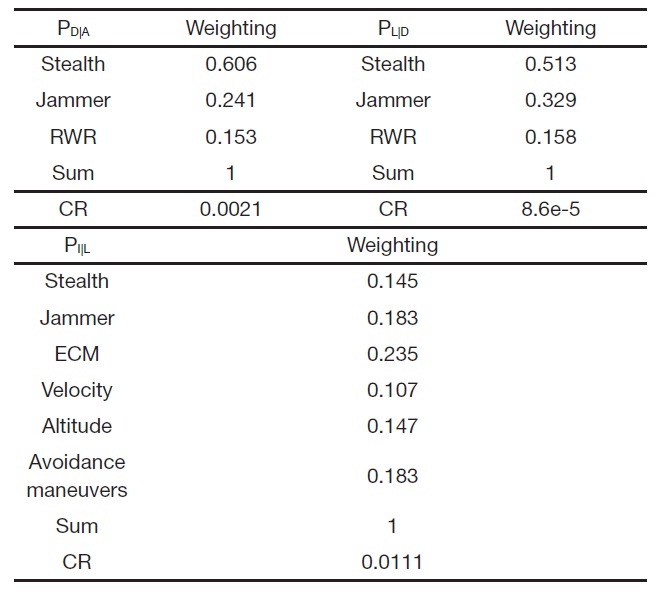
The weighting value used in this study was obtained from 16 consistent survey results among 30 expert responses. The final weighting values from the survey results are shown in Table 9.
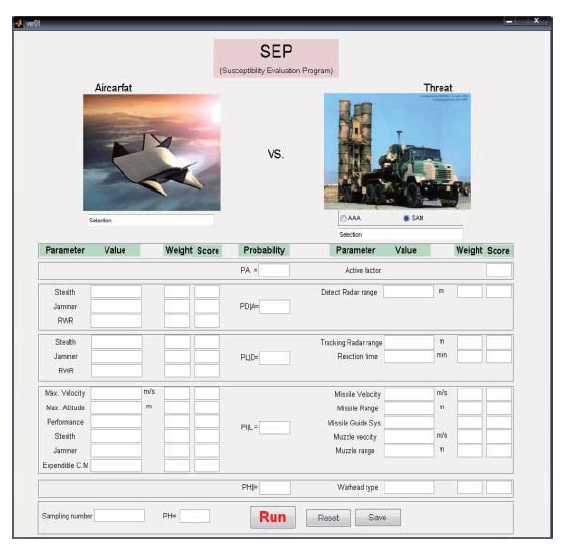
For the user’s convenience, the probability calculation GUI was designed and developed using MATLAB. The score of parameters and weights are the input data and the probability of susceptibility is the result. The GUI screens
are shown in Fig. 2. Basically, the aircraft and threat scores and weighting values are entered in the designated input boxes. On clicking the "Run" button, the susceptibility value is evaluated as an output. It is also possible to calculate the parametric sensitivity analysis for the selected susceptibility parameters.
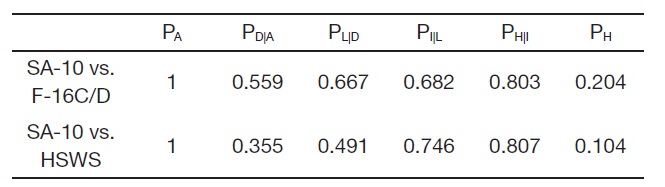
2.5.1 F-16 C/D vs. SAM SA-10
As an example of simulation, the value of susceptibility is calculated between F-16 C/D and SAM SA-10. The scores and weights based on reference data are shown in Table 9. The result of susceptibility is shown in Table 10. The value of PA becomes 0.799 when the threat activity factor is chosen to be 0.8. The product of all the conditional probabilities including PA is the final value of probability of hit, PH. There is disparity between the calculated value of PH and the real value. The combat simulation between the HSWS and SA-10 is done for comparing qualitative trends based on the above results.
2.5.2 HSWS vs. SAM SA-10
With the United States at the head, several countries have developed hypersonic flying weapon systems called "high speed weapon systems" to tackle "time critical ground mobile threats" effectively.
There is no precise performance data or mission profile information because it is currently in the development phase. Because of this reason, we have to assume some specifications. Cruise speed and altitude are Mach 5 and 30,000 m respectively. Even though the SR-71 Blackbird is a hypersonic aircraft, it applies stealth technology. Thus, HPWS has similar stealth characteristic with SR-71 which has LO2 level. And no avoidance maneuver is assumed because of high speed. Furthermore, it has the newest RWR, Jammer and possess the Chaff and Flare. With these conditions, scores are calculated and shown in Table 9. And the result is shown in Table 11. The probability of the HSWS PI|L is lower than that of the F-16 C/D. Consequently, probability of hit,

Simulation result
namely susceptibility, can be reduced.
In this study, "weighted score algorithm" is suggested to evaluate the aircraft combat susceptibility and the MATLAB-based software tool for estimating susceptibility has been developed with critical parameters that influence the susceptibility. Although the weighted score algorithm is not a deterministic approach and the evaluated combat susceptibility is not verified quantitatively, the developed tool using the weighted score algorithm can evaluate the qualitative characteristics and trends for the sensitivity of susceptibility parameters. In addition, it can be very useful for the first-order estimation of susceptibility design parameters in the early stage of aircraft design, such as in the preconceptual design phase. The reliability of the weighted score algorithm may depend on the parameter score and weighting factor criteria and further research will be continued in these areas.
A susceptibility database for combat simulation was designed to provide information regarding the susceptibility parameters for a broad spectrum about threat weapon systems. The "weighted score algorithm" and the database for susceptibility analysis will be improved through future research in this area, and we also have a plan to broaden the scope of research to one-on-many, many-on-one, and many-on-many scenarios of engagement.