The analysis of the flow around the moving object accounts for a significant part in the recent computational fluid dynamics. Even though, numerous studies have been carried out until now, there is still much to be identified on the flow around a circular cylinder. Despite its simple shape, a circular cylinder is known to cause complex flow phenomena such as separation flow and vortex shedding. This is due to its large pressure gradient which makes numerical computation and interpretation difficult. As fluid flow around a blunt body is similar to that around a circular cylinder, analysis of flow around a circular cylinder is the basis for analyzing flow around blunt bodies. Structural oscillation is one of the important factors associated with the service life of a structure. Moreover, aero-acoustic noise has a great impact on the noise environment around a structure. Therefore, many people have attempted various methods to analyze and control the cause of vortex shedding. A method for controlling vortex shedding is to attach a plate at the back of a circular cylinder or to control wakes by using another cylinder, to disturb the inflow or absorb and spout fluid on the cylinder surface, to periodically oscillate the cylinder, etc. Accordingly, flow around an oscillating circular cylinder has been studied and it is yet an object of important numerical computation [1,2,3].
The most important phenomenon for analysis of the flow around an oscillating object is the “lock-on.” The lock-on is a phenomenon in which the oscillation of an object coincides with the vortex shedding that is generated from the object. The circular cylinder has its characteristic Karman vortex shedding frequency which is dependent on the Reynold’s number. The lock-on happens when the oscillation frequency of the cylinder is approximately same or similar to the Karman vortex shedding frequency [1,2,3].
Many researchers have carried out numerous numerical or experimental studies for the fluid flow around the oscillating cylinder. Williamson and Roshko[1] carried out excitation oscillation test in order to analyze the wakes that are generated depending on the changes in oscillation amplitudes and oscillating frequencies. Kim and Yoo[2], measured the changes in dynamic properties of wakes behind a circular cylinder by using a high-speed PIV system to compare and examine it with natural shedding. Atluri, et al[3]. Examined wake flow of a circular cylinder oscillation which is dependent on the Reynold’s Numbers and frequencies. Koopman[4] examined the lock-on phenomenon for a circular cylinder oscillating with low Reynold’s numbers. Gerrand[5] examined the vortex shedding mechanism that occurs in a fixed blunt body and its various patterns. Griffin and Ramberg[6] examined the transverse oscillation effect in a lock-on zone and observed horizontal vortex intervals by using the visualization technique. Kang, et al[7]. numerically computed the flow of a circular cylinder oscillation by using the DNS of the central difference scheme of 4th order accuracy and the upwind scheme of 7th order accuracy.
For this study, we identified the lock-on zone according to the changes of the transverse amplitude and the excitation frequency of the cylinder, and carried out a comparative analysis for flow phenomena in the lock-on and the non lock-on conditions. In other words, we analyzed the correlation between the excitation frequency of the circular cylinder which oscillates in the transverse direction and the vortex shedding frequency that is generated around the cylinder. As for the governing equation, we used two-dimensional unsteady compressible Navier-Stoke’s equation but we did not use the turbulence model for the computation of low Reynold’s number. We used the fourthorder accuracy Runge-Kutta’s scheme for time differential and the Optimized High-Order Compact (OHOC) scheme with the fourth-order accuracy for the space differential. For the zone, we used the O-type moving mesh up to 40 times the diameter of the cylinder. The flow condition was set to and the transverse amplitudes were set to 0.1, 0.2 and 0.3 times the diameter respectively. The excitation frequency was applied at the zone of . By performing PSD analysis for the lift coefficient for each flow condition, we analyzed the characteristics of the primary oscillation frequency and resonance frequency. When the excitation frequency is near the natural vortex shedding frequency of the fixed cylinder, the lift coefficient and the vortex shedding were amplified by the excitation oscillation, and the the one primary oscillation frequency appeared in the lock-on zone. In the non-lock-on zone beyond the zone, the beat was formed in which two or more primary oscillation frequencies were mixed together. Furthermore, as the amplitude increased, the frequency zone where lock-on appeared got wider.
2. Governing Equation and Numerical Method
The 2-dimensional unsteady compressible Navier- Stokes equation non-dimensionalized in the generalized coordinates was used, as in Equation (1).
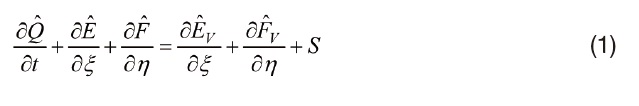
Non-dimension parameters are cylinder diameter(D), freestream velocity(U) and freestream density(

and

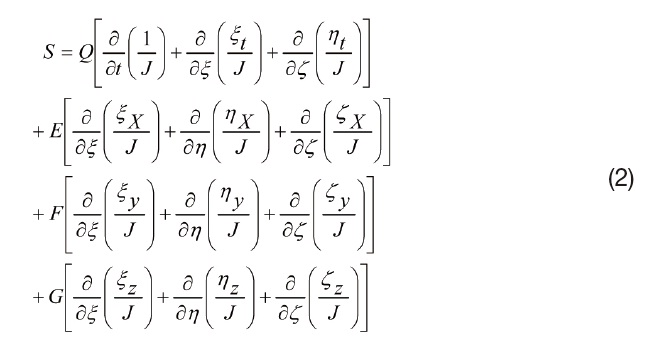
represents the nonviscous flux vector and the viscous flux vector in each direction . In order to deal with the oscillating airfoil, a moving mesh had to be used and the mesh movements were taken into consideration for the conversion matrices[8]. The term
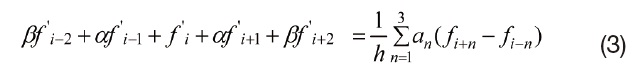
In order to maintain high order and high resolution for the time differential, Runge-Kutta’s 4th order scheme was used[8]. For the space differential, OHOC (Optimized High- Order Compact), the higher-order and high resolution scheme of 4th-order accuracy, was used[9]. The implicit method that uses the following 7 points was used to obtain the numerical differential of each physical property. For the case of α ≠ 0 and β = 0 or α ≠ 0 and β = 0, the tri-diagonal or penta-diagonal matrix was used to obtain the differential. Due to the characteristics of the central difference scheme, there occurred truncation errors and phase errors. In order to minimize such errors, the α, β and an coefficient proposed by Kim and Lee[9] was used.
With the OHOC scheme, it is possible to achieve high resolution for space, but it is impossible to exactly reproduce the characteristics of the wave propagation as with the upwind scheme. Due to these characteristics of the central difference scheme, the dissipation and diffusion errors are generated and they significantly affect the numerical stability. In this study, the Adaptive Nonlinear Artificial Dissipation model proposed by kim and Lee[10] was used to enhance numerical stability.
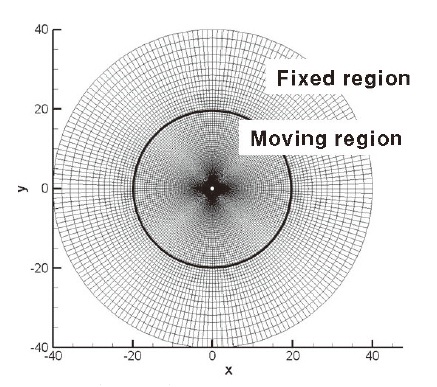
For mesh, we used O-type meshes according to the characteristics of the circular cylinder shape and concentrated them around the cylinder where the change of flow was expected to be large. As for the number of meshes, the meshes shown in Fig. 1 where 250x200 (50,000) meshes were employed and they were used, based on the computational results of the several mesh systems. The moving mesh was used based on the algebraic computation of the meshes that move along with moving cylinder surface within the zone 20 times the diameter. For other zones, fixed meshes were used.
When acoustic waves reach the boundary surface at subsonic flow, physical reflected waves and non-physical reflected waves that occur numerically are generated. While passing through the boundary, the physical reflected waves have long wavelength but they do not affect the numerical stability. However, the non-physical reflected waves have short wavelength and they generate unnecessary numerical waves due to the numerical differentiation at the boundary. This as a result causes numerical instability in the entire computational domain. Particularly, when the turbulent flow or vortexes pass through the boundary, highly nonphysical reflected waves occur. Generally, in order to inhibit non-physical reflection that occurs at the boundary, inflow and outflow conditions according to the eigenvalues are used. However, the characteristic boundary conditions are not sufficient enough to inhibit non-physical reflection. In this study, the zonal characteristic boundary conditions proposed by Sandberg and Sandham[11] were applied to minimize the effect of non-physical reflected waves on the
computational domain. The zonal characteristic boundary condition was developed on the basis of the general local characteristic boundary conditions, and it is easily applicable to the general characteristic boundary conditions.
In this study, the phenomenon of flow was analyzed depending on the magnitude of excitation frequency (
By analyzing the flow around a stationary cylinder, the natural Karman vortex shedding frequency, that is a dimensionless Strouhal number (
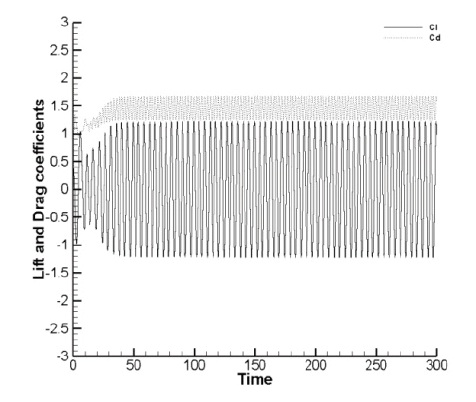
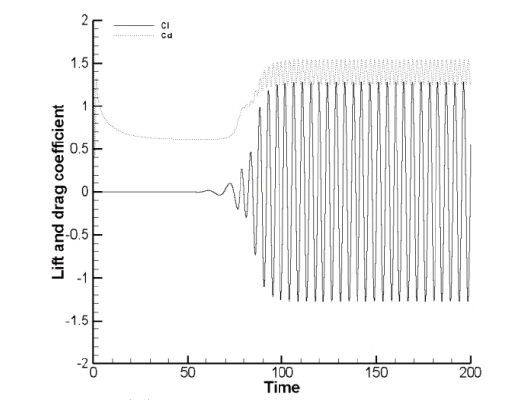
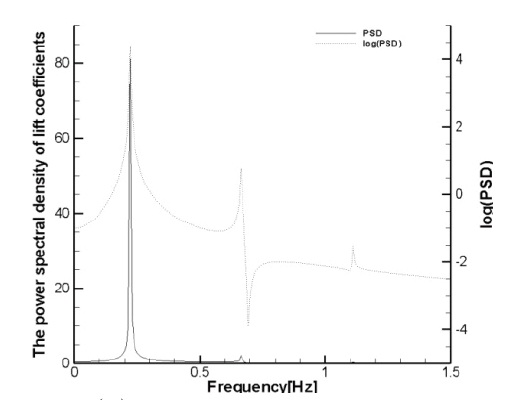
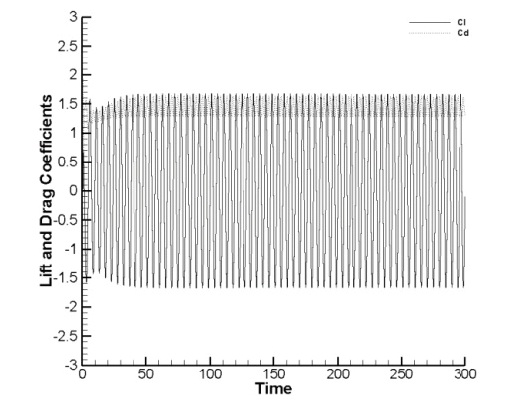
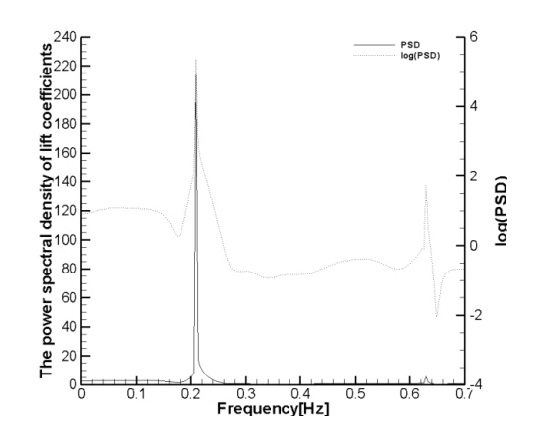
With respect to the changes in the lift and drag coefficients over time, it is seen that a periodic steady state was maintained and it is as shown in Fig. 2(a). Fig. 2(b) shows the
FFT analysis of the lift coefficient and it can be seen that the PSD was strong only at one point of the frequency. For the log (PSD), the
The excitation frequency of a circular cylinder was applied in the range of 0.16 ≤
number of the flow that is around the stationary cylinder.
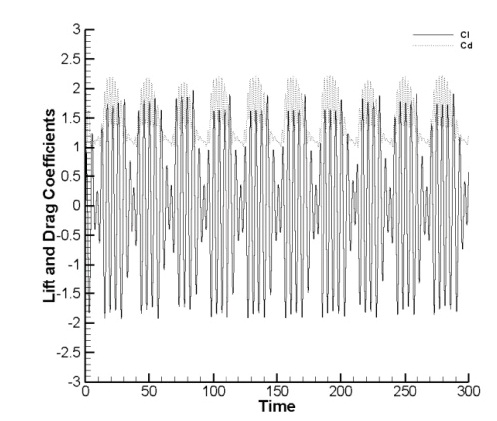
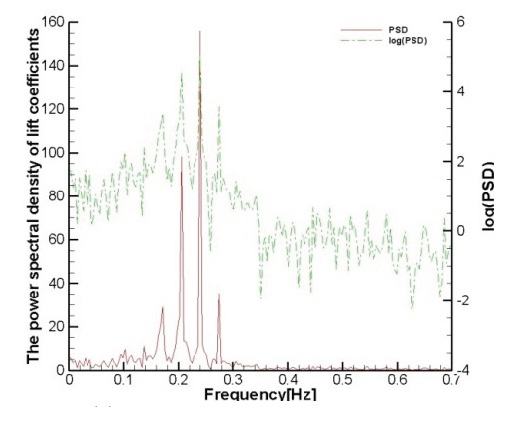
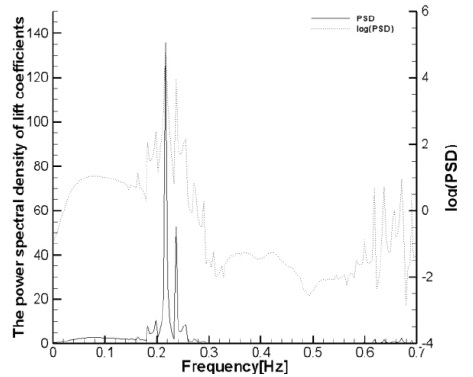
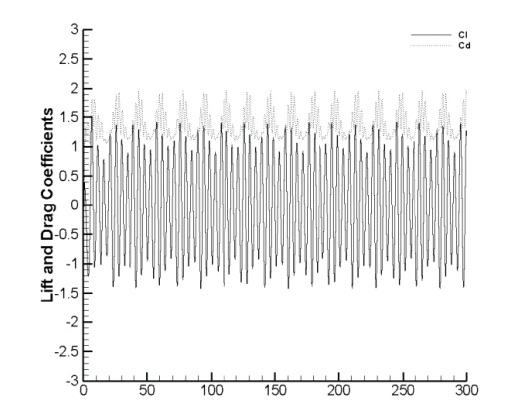
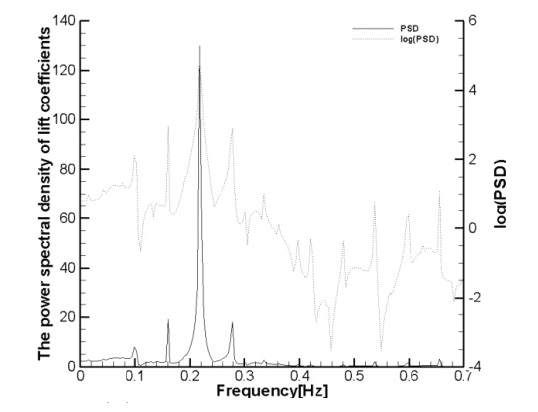
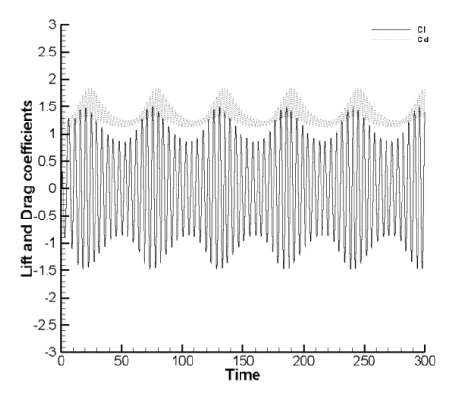
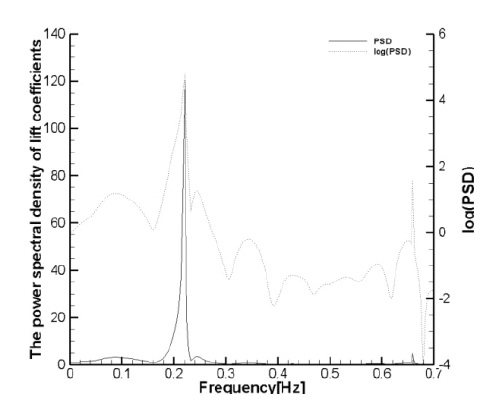
Fig. 3(a), Fig. 3(b), (e) and (f) show the non-lock-on phenomenon at an amplitude of 0.2D and the excitation frequencies were 0.16 and 0.24. It shows that two or more frequencies are mixed when the lift and the drag coefficients change and that there is a beat between the frequencies. Figs. 3(c) and (d) show the lock-on at the amplitude of 0.2 and the excitation frequency of 0.22. This is when Strouhal number of the cylinder agrees along with the excitation frequency.
When the lift and drag coefficients change, one primary oscillation frequency appears without the interference of other frequencies. It appears that the extreme value of PSD becomes very strong at one point frequency and log (PSD) also becomes strong at one point frequency without any other frequency disturbance. As shown in the PSD value, one strong extreme value happens to be larger compared to that at the fixed cylinder. In other words, the maximum lift coefficient also increases and this is due to the characteristic Strouhal frequency of the cylinder. The excitation frequency creates resonance and thus it increases the force applied to the cylinder.
Fig. 4(a) ~ (d) show the non-lock-on case of frequency of
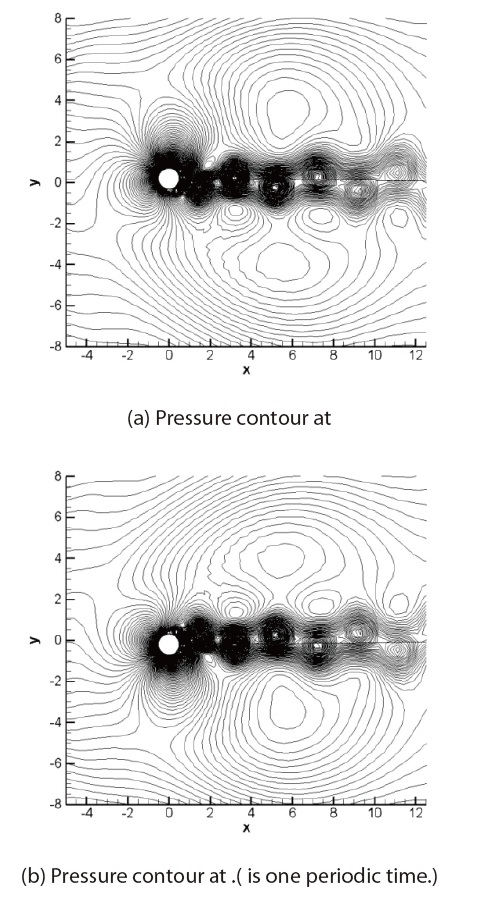
Figs. 5 (a) and (b) show that the lock-on phenomenon. In this the vortex shedding is shown during a cycle with the amplitude of 0.2D and the excitation frequency of 0.21. In Fig.5 of the case of lock-on, it is shown that the distance between vortices is regular respect to resonance. However, for the case of non-lock-on, the distance slightly changes and this is due to the influence of beat frequency. In order to show the irregularity between vortices that is caused by
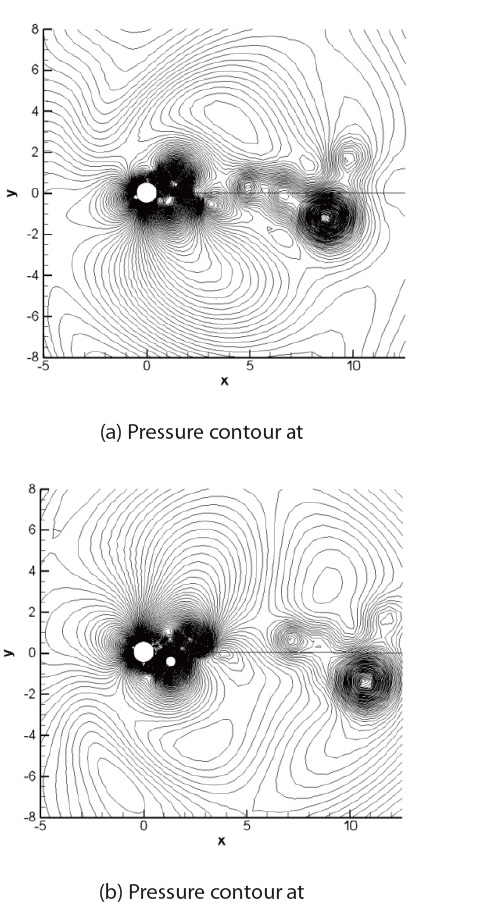
the beat frequency, the contour lines of pressure distribution during a cycle with the amplitude of 0.3 and the excitation frequencies of 0.23 are presented in the Figs. 6(a) and (b). The figures make the irregularity of the vortex distribution clearer.
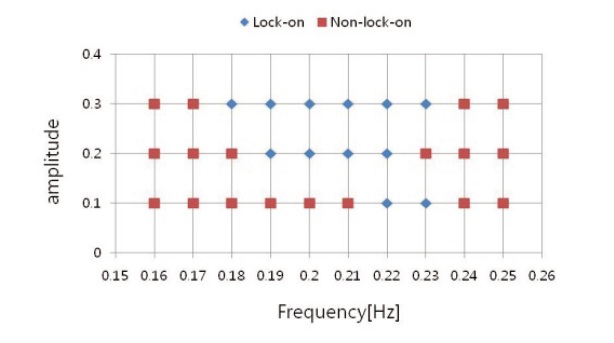
Fig. 7 shows that the lock-on zone and the non-lockon zone according to the amplitude and the excitation frequency. Fig.7t the lock-on zone becomes wider as the amplitude becomes larger. This phenomenon appears as the cylinder oscillation affects the fluid flow more, as the amplitude becomes larger.
This study numerically analyzed the flow around the two-dimensional circular cylinder which oscillated in the transverse direction. As for the governing equation, we used the two-dimensional unsteady compressible Navier-Stokes equation. For the space difference, we used OHOC scheme to ensure high-order and high-resolution accuracy. For the time difference, we used the 4th order Runge-Kutta’s scheme. Moreover, in order to suppress the nonlinear discontinuous wave that causes numerical instability, ANAD scheme was used for artificial dissipation. As for the boundary condition, the non-reflecting zonal characteristic boundary condition was used. This suppressed the unphysical reflected wave and the reflected wave that is generated by the vortex with high energy density when it passed through the boundary. The cylinder had the characteristic vortex shedding frequency and this was dependant on the Reynold’s number. When the oscillation frequency of the cylinder was excited at the characteristic vortex shedding frequency of the cylinder or at a similar range, the cylinder went into the lock-on condition. In this, one primary oscillation frequency was generated and the resonance was created to increase the amplitude of the lift. In the non-lock-on zone, two or more primary oscillation frequencies were generated by the difference between the excitation frequency and the natural vortex shedding frequency. There was a beat among these frequencies. It was confirmed that the lock-on zone increased as the excitation amplitude increased.