A ducted-fan type micro UAV is easy to operate and can be applied to various purposes because it does not need a runaway and is capable of hovering [1]. For this reason, the military has shown continued interest in ducted-fan UAVs. In particular, the United States army has actively developed and made advancing progresses in the research of ducted-fan UAV as part of FCS (Future Combat System) Class I program. A ducted-fan UAV is mobile and can be deployed rapidly, which makes it well-suited for a variety of missions such as reconnaissance and surveillance performed by soldiers at the platoon or squad level. Also, it is aerodynamically efficient because the lift generated by the duct can create a thrust force that is higher than the other VTOL micro UAVs, which have no duct and therefore no hovering flight mode. In the case of the ducted-fan type micro UAVs, its rotor is covered with duct which lowers the risks of rotor damage caused by tiny bugs and foreign object. Furthermore, it can be designed in a family of sizes from micro to medium and large classes, as well as be operated manually to perform numerous tasks such as reconnaissance and surveillance. Finally, the ductedfan type micro UAV was developed under an innovative operational concept of landing on small areas such as the roof of a building, and of preventing excessive fuel consumption during hover flight [2].
A ducted-fan UAV has very peculiar configurations and therefore, it is necessary to consider the exact dynamic modeling of this aircraft. The unstable flow due to the complicated design of the inner duct combined with static and dynamic instabilities makes the aircraft extremely hard to control. Dynamic instability is a unique feature of the VTOL UAVs. Nevertheless, flight control performances such as flight condition, airspeed, and altitude can be greatly enhanced through exact dynamic modeling of a basic air vehicle. Hence, it is vital to investigate the tendencies of aircraft and understand instability through the analysis of dynamic modeling before designing flight control systems.
This paper conducts a numerical analysis on mathematically modeled small scale ducted-fan UAV, with the purpose of analyzing the air vehicle’s static characteristics. The results of the numerical analysis are then compared with trim analysis based on wind tunnel test data. The error factors are investigated in detail, and flight characteristics based on modifi ed mathematical modeling is described for each subpart of the UAV.
2.1 Vehicle Confi guration and Coordinate System
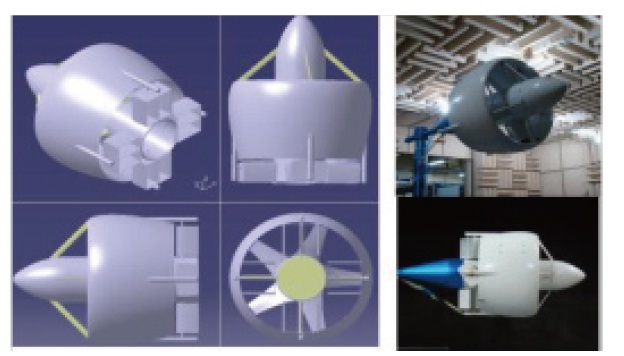
The CNU-ducted fan UAV shown in Fig. 1 is used for dynamic modeling. The maximum rpm of the CNU-ducted fan UAV is around 6,500 rpm. Th is micro UAV has 4 control vanes that can control all 3 conditions as well as the heaving motion. Four control surfaces are located at the end of the duct. Defl ections of each control surface range from -30° to +30°, providing enough power for the roll, pitch, and yaw controls.
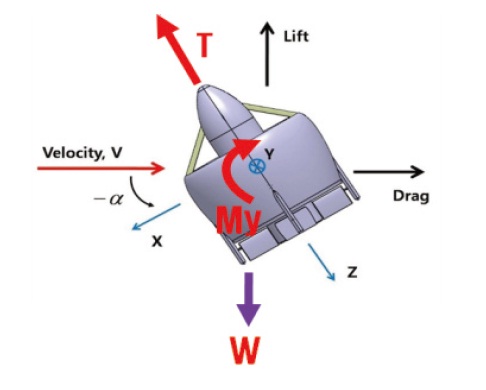
A coordinate system, which also depicts characteristics of helicopters is used because, it has similar dynamic features such as the thrust vector, anti-torque, gyroscopic coupling, and velocity that are induced by the main rotor. Pitch angle and angle of attack is zero at hovering fl ight: as the vehicle goes forward, it moves in the direction of the negative coordinates.
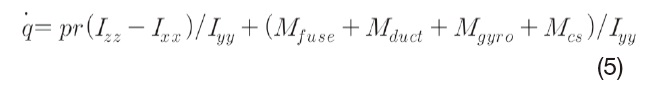
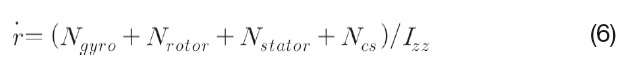
2.2 Nonlinear Dynamic Equations
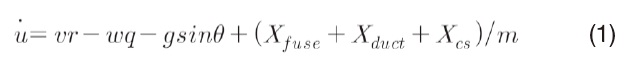
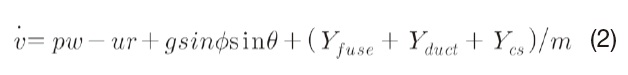
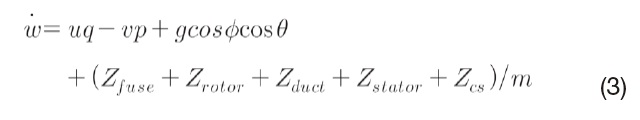
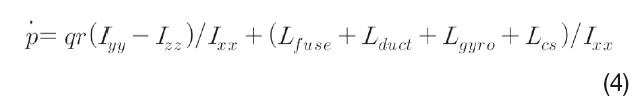
Six degree-of-freedom (6-DOF) nonlinear-equations of motion are expressed in terms of the force and moment acting on the vehicle, which can be written as follows:
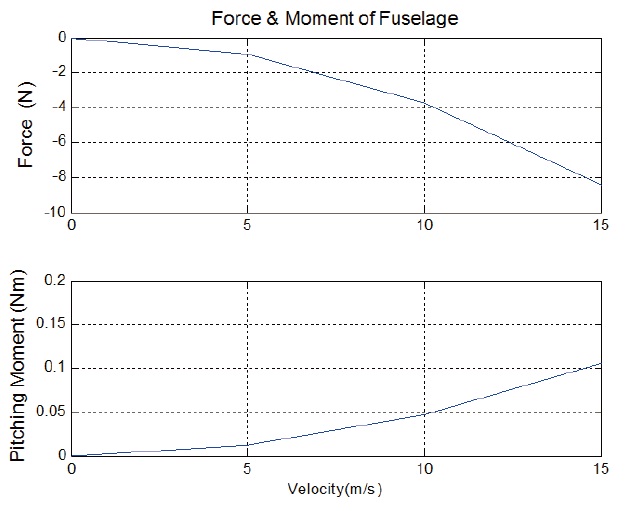
The force and moment caused by fuselage can be expressed as[3]:
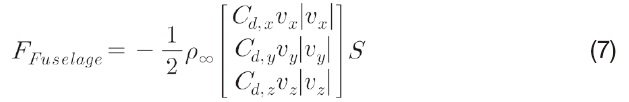
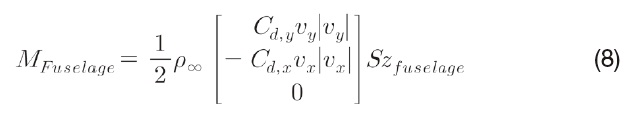
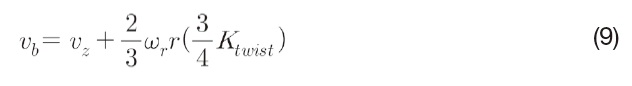
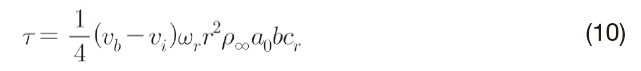
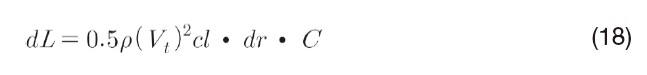
A stable pitch-up moment is generated by the distance between the center of gravity and the aerodynamic center. Because the aerodynamic center and the center of gravity of the vehicle have axis-symmetric confi gurations and are located on the z axis, the yaw moment is not generated. Th at is, the moment arm along the x- and y-axes is zero. The rotor modeling of the vehicle is based on the momentum theory and blade element theory applied to fl ight analysis of helicopters [4]. Twist angle of each blade gets lower toward the blade tip [5-6]. The main rotor system of conventional helicopters has swash-plate so that the thrust force can be either in the forward/backward or left/right directions, whereas in the case of the ducted-fan UAV, it has fi xed rotors located inside the duct. Th us, the force generated by the main rotor acts only on the z-axis. Considering the airspeed along the z-axis, the confi guration of the blades, the infl ow, and thrust of the rotor can be expressed as [7]:
where

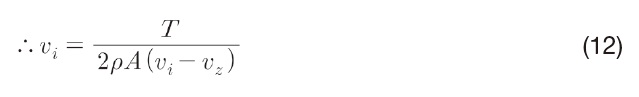
Eq. (12) can be generalized as
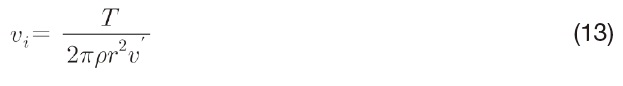
The induced velocity can be obtained using the zerofunction and the Newton-Raphson method.
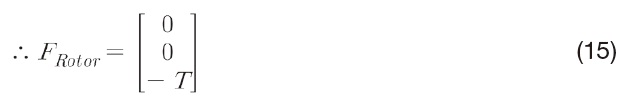
The thrust by rotor can be expressed in body-frame as:
Given


where ø, and
where
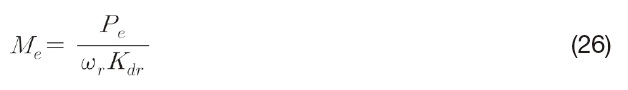
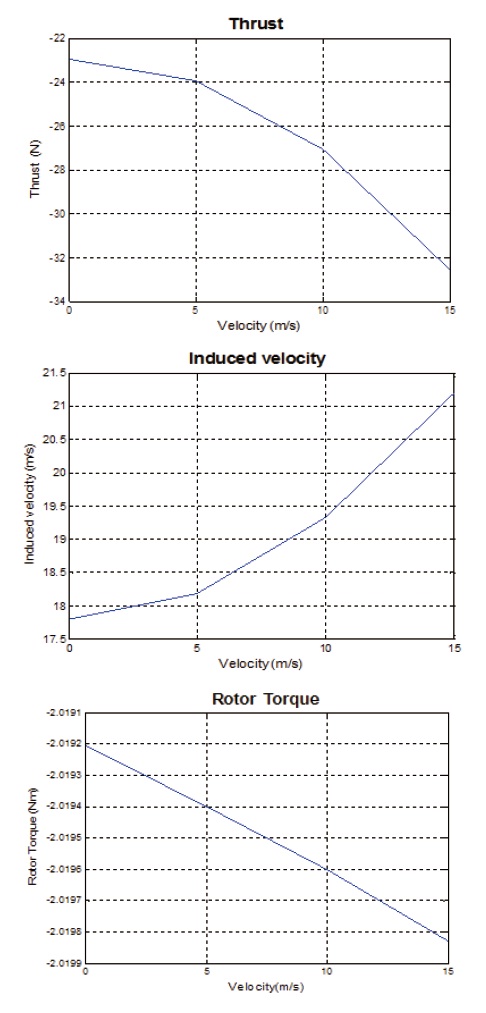
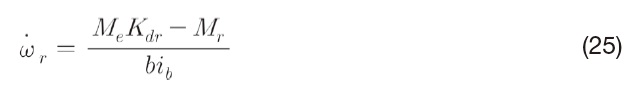
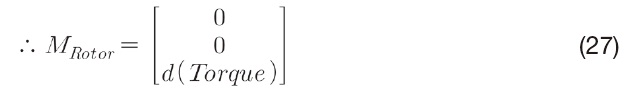
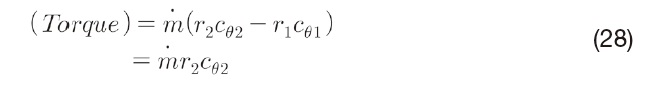
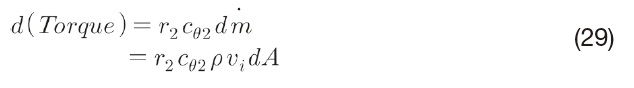
The moment applied to the vehicle is based on the above equations and is derived from the rotor/engine power, which can be expressed as Eq. (26). Since the rotor blades spin clockwise, they generate torque in a counter-clockwise direction [8].
In the model, 12 stators are placed inside the duct to nullify anti-torque and increase the thrust component along the z-axis. To build an accurate model of the stator, the direction of the flow relative to the stator must be specified [6]. The inflow angle is determined by the induced velocity (
where and denote the inflow swirl velocity and the outflow swirl velocity, respectively.
It is assumed that the airflow inside the duct is steady and incompressible based on the duct geometry. The angle of attack is zero in both the hovering and climbing flight modes, while it approaches the negative in cruise flight mode. The drag force generated by the duct in forward flight is called the momentum drag and can be expressed by using the mass flow of air travelling into the duct [9].
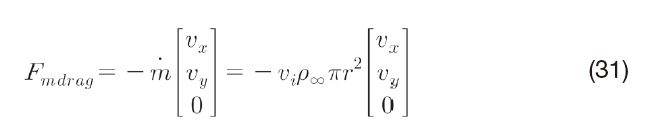
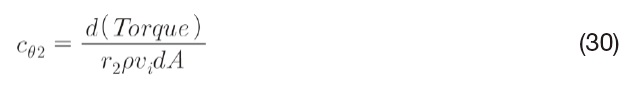
Because the free stream flows into the duct at higher velocity by the rotor over the duct lip, the aerodynamic force generated by the duct can be shown in terms of the momentum drag and the profile drag, which can be expressed as
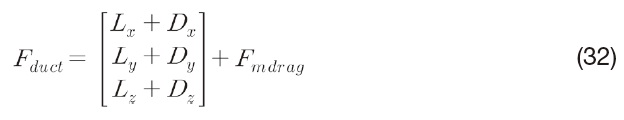
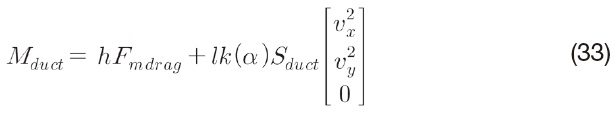
The moment acting on the duct is the sum of the distances multiplied by several forces, such as the lift and drag caused by the duct, momentum drag.
where
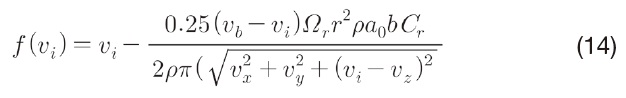
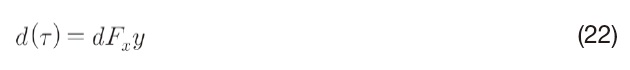
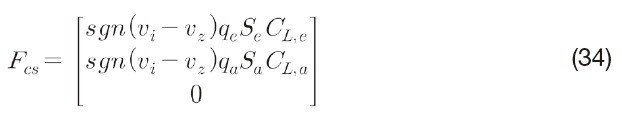
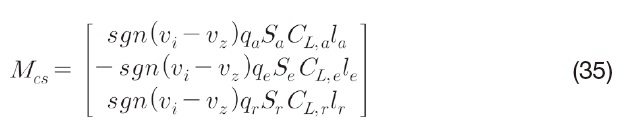
The control force can be produced by the control surfaces depending on the angle of attack, which is a function of the slipstream of the rotor and the deflection of the control surface. Also, NACA0012 airfoil is used as control flaps. The force and moment generated by the control flaps are given by
where
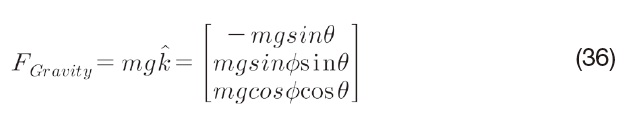
The gravity effects on the vehicle can be expressed as follows:
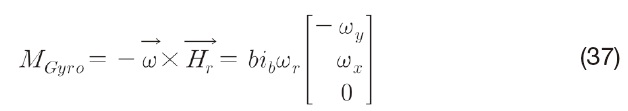
Finally, the rotation of the rotor generates gyroscopic moment. It is assumed that the rate of change of the rotor’s angular velocity is negligible. Thus, the gyroscopic moment can be written as follows:
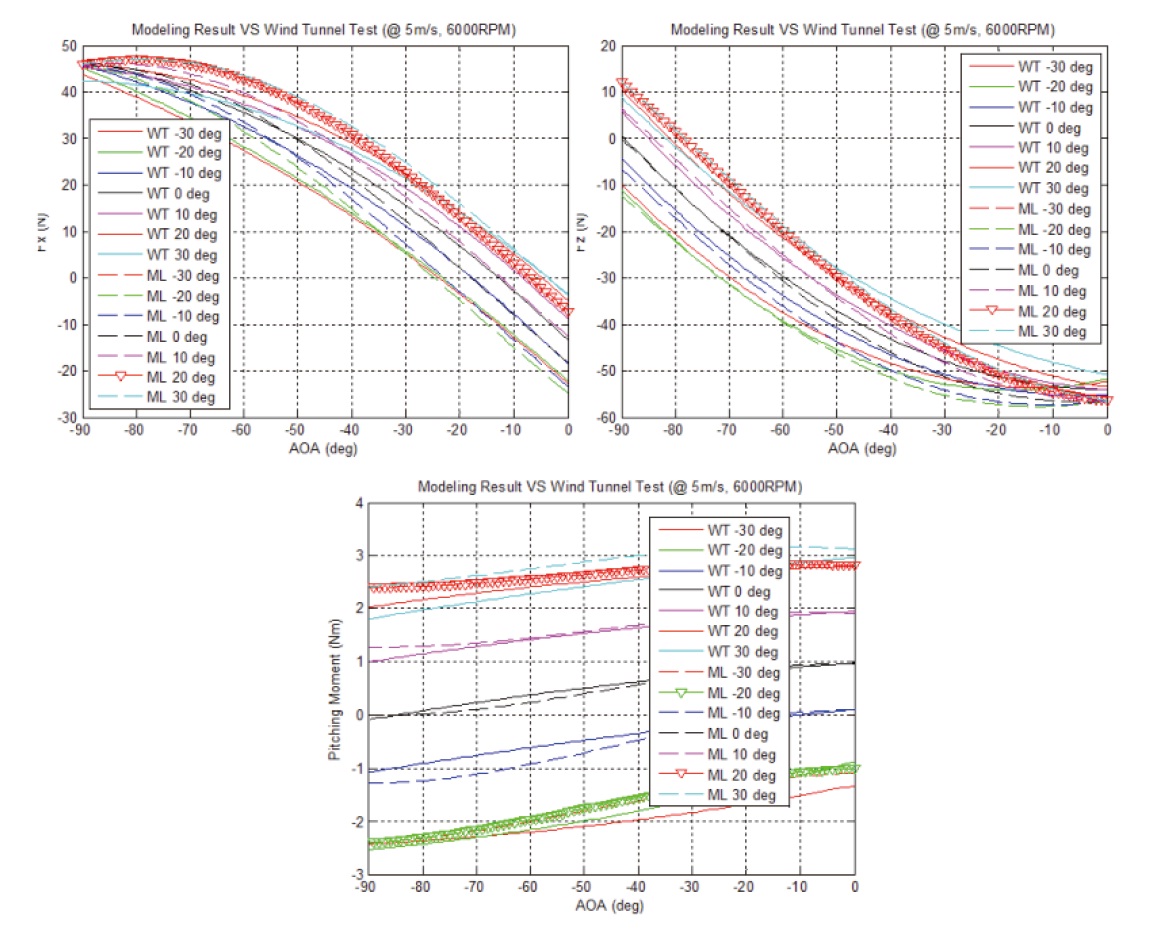
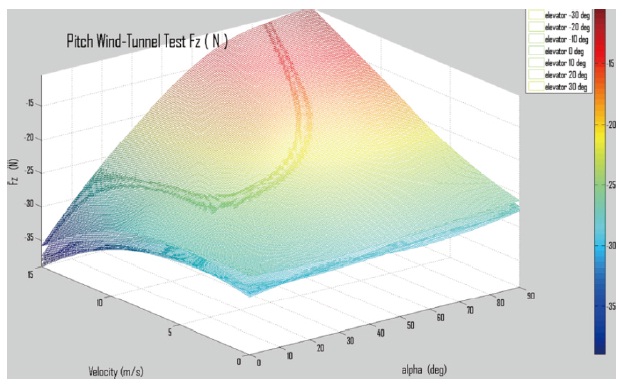
A wind tunnel test is conducted to measure the force and moment acting on the vehicle. The tests are performed to induce a wind tunnel velocity that ranges between 0m/s to 20m/s with increments of 5m/s; an angle of attack ranging between 0° to 90° with increments of 10° ; an elevator deflection angle ranging between -30° to 30° with increments of 10° ; and a rotational speed of 2,500, 4,000, and 4,500 rpm.
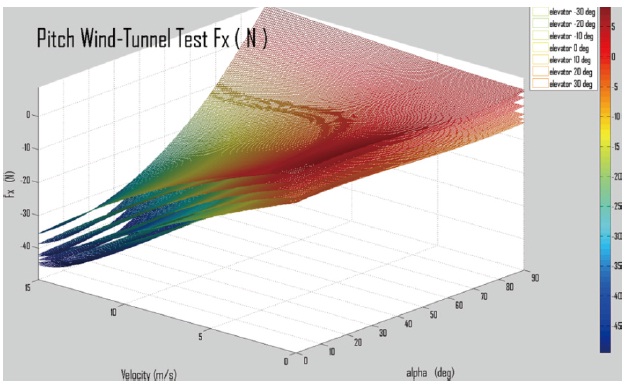
As seen in Fig.3, the sum of the x-components of the force represents the aerodynamic drag. The drag caused by the duct is the main factor of the x-axis force in the presence of crosswind, and its force increases with increasing velocity. It is measured at -47 N at 15 m/s and is decreased to 12 N at the maximum deflection angle of the control flap. The result also shows that the drag is close to zero in cruising flight.
Most of the z-component of force is caused by the rotor thrust and the thrust increments are induced by the stator. The rotor is rotating at 4500 rpm, where the thrust is measured 23 N. The induced velocity increases as wind speed increases. Also the increase in induced velocity causes an increase in thrust due to the stator hitting up to 38 N in total. The stators are located in such a way that it has a small angle of attach with respect to the inflow, so that they generate upward lift. Moreover, the result shows that the z-component of force decreases as wind speed increases given cruise flight mode.
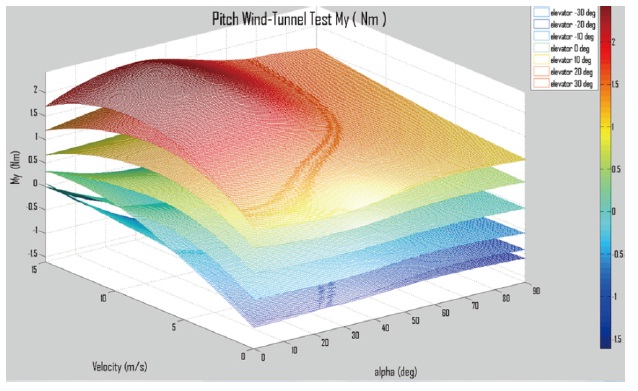
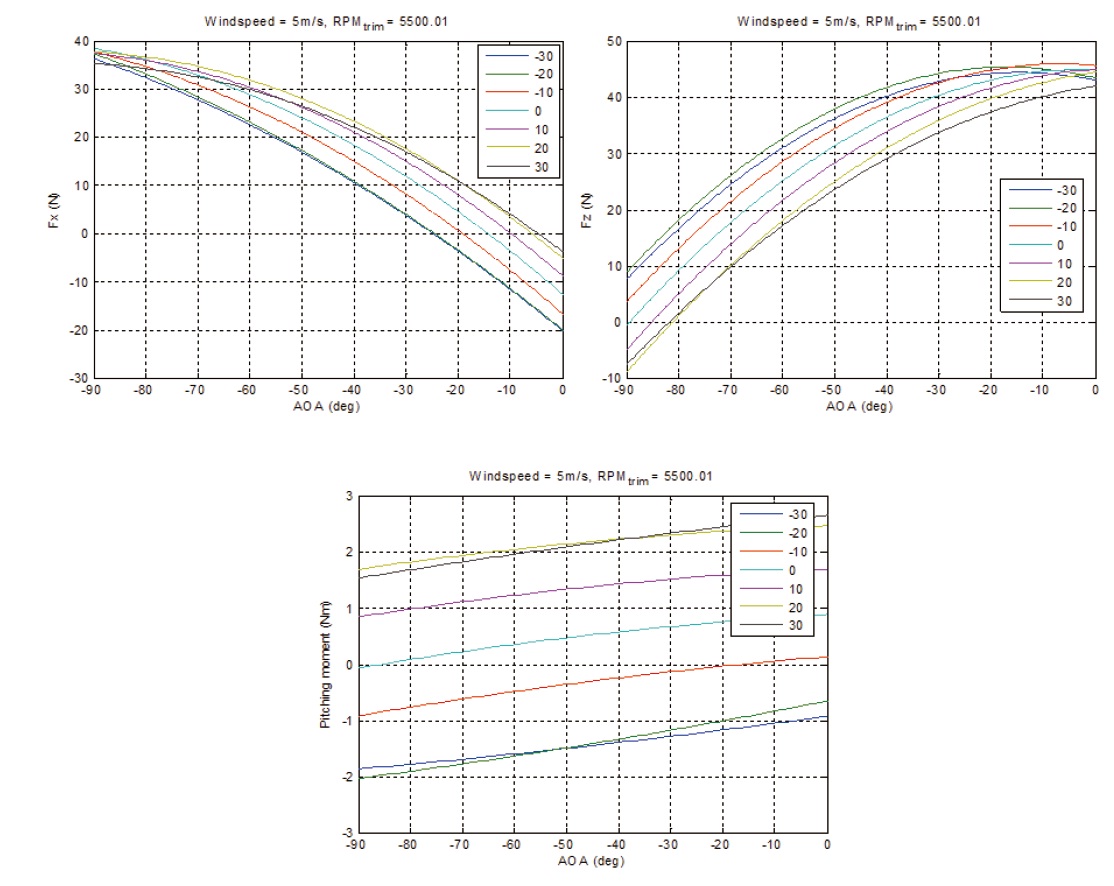
The pitching moment is depicted in Fig. 5. The aerodynamic center is estimated by analyzing the pitching moment
derived from the nonlinear dynamic equation and the data from the wind tunnel test. As a result, it can be observed that the estimated parameter is in good agreement with the result of the wind tunnel test’s data. Also, the pitching moment can be calculated by using the position of the center of pressure, and is approximated to reach a maximum of 0.6 Nm at 5 m/s and then decreases as the airspeed increases. The charge of the control surface deflection is defined as negative as the flight moves downward in cruise mode. A nose-up pitching moment can be produced by deflecting the control surfaces
upward.
The trim data is obtained by analyzing three-axis force and moment obtained from the wind tunnel test data as shown in Fig. 6. The x-component of forces increases in the positive direction as the drag force decreases during the transition of the flight mode from hover to cruise. Because the rotor thrust and duct lift play crucial roles, the z-component of forces decreases when the vehicle tilts from the downward to the forward direction of flight.
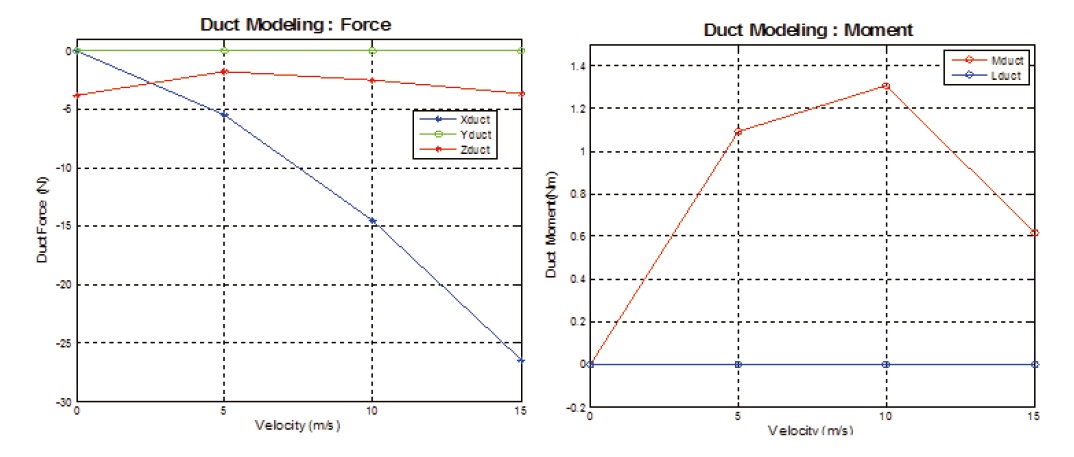
A negative pitching moment is applied to the air vehicle as it moves forward since the center of pressure of the duct is located beneath the center of gravity of the UAV, which is shown in Fig. 7. Also, the induced velocity, rotor thrust, and anti-torque are increasing with the airspeed as shown in Fig. 8.
Drag due to the duct is dominant along the direction of the x-axis and proportional to the airspeed. An additional increment of 5% due to the effect of the duct is shown in Fig. 9.
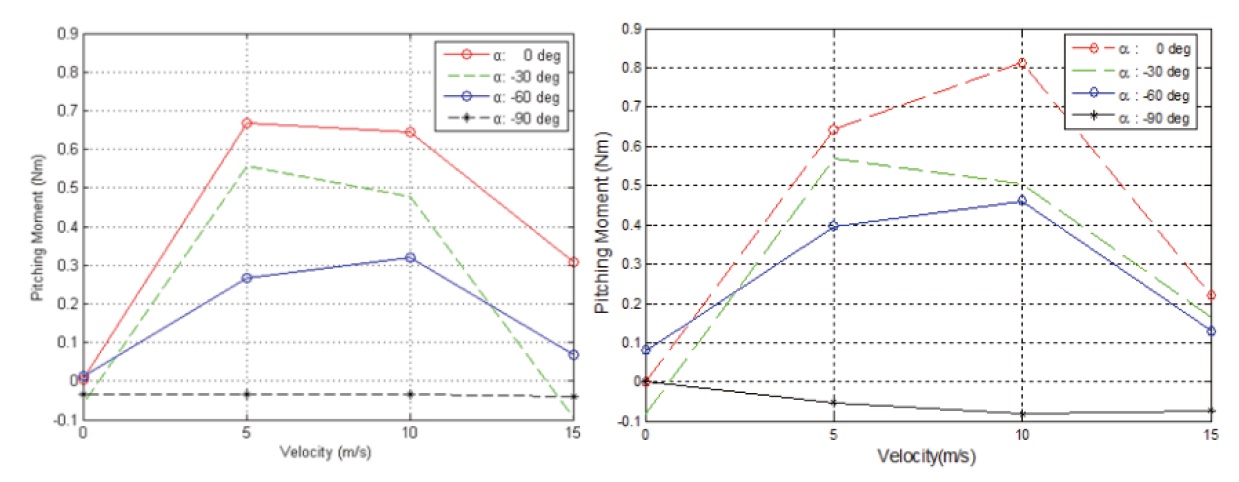
As the airspeed increases given the hover flight mode the pitching moment becomes more positive, which means that the vehicle has enough restoring momentum to maintain its hovering position. However, as the airspeed exceeds the critical airspeed, the drag from the duct has a more dominant effect and the pitching moment negative, which implies unstable pitching motion.
Fig. 11 shows the effects of the elevating control flaps on the longitudinal force and moment. It is noteworthy that when the angle of attack ranges between -20° to -30° , the downwash of the main rotor intertwines with the free stream and results in flow separation in the control flap. This implies that the the control effectiveness is reduced. Also, drag is reduced
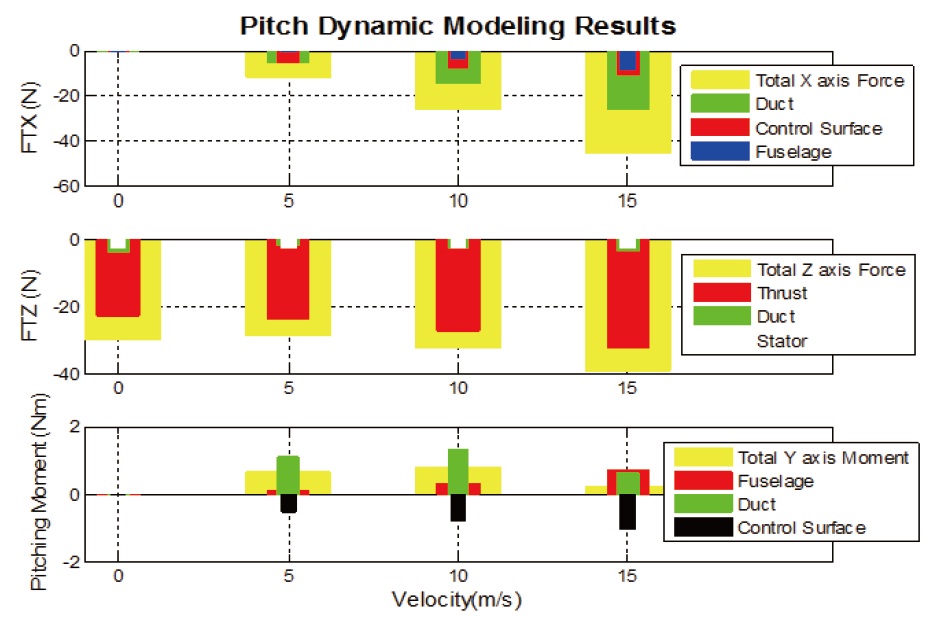
dramatically when the angle of attack ranges between -70° to -90° . So, the UAV can maintain most favorable lift to drag ratio within this defined attack angle range. Based on these results, contribution of each sub-module to the total force and moment are shown in Fig. 12.
The fuselage has positive pitching moment and drag whereas the duct has positive lip moment in low airspeeds
and negative pitching moment at higher airspeeds. Control flaps contribute negatively to the pitching moment since it is located at the lower end of the duct. The trim condition for longitudinal motion of the UAV is summarized in Table 1 with respect to the airspeed. Generally, it can be shown that the results of the numerical modeling are in accordance with the implications of the experiment data. Nevertheless, it should be noted that the modeling data show less pitch trim angles than those displayed by the wind tunnel data.
This paper derives a complete set of static/dynamic equations of motion, composed of fuselage, duct, main rotor, stator, control flaps, gravity, and gyroscopic effect. The longitudinal trim conditions are derived based on the mathematical model. Then, these results are compared with the results of the wind tunnel test, and the modeling errors are revised using the wind tunnel data. The effect of the duct becomes more dominant as the airspeed increases. Also, it is shown that the air vehicle displays best lift to drag ratio, when the angle of attack lies between 70 and 90. Moreover, the unstable pitching moment caused by the duct at high airspeeds is crucial for designing flight control systems. Finally, theanalysis provided insight into the importance of the distance from center of gravity to the center of pressure of the duct. The precise modeling and static analysis based
[Table 1.] Comparative Trim Analysis (Wind Tunnel vs Modeling)
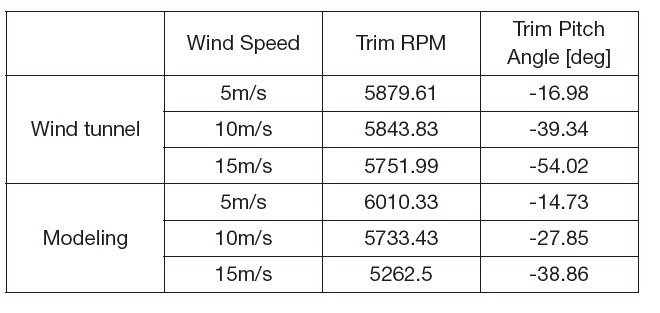
Comparative Trim Analysis (Wind Tunnel vs Modeling)
upon the results of this paper will be able to provide a basis for nonlinear simulations and flight control system designs.