Even with the advent of modern computational power and state-of-the-art solution technologies, a reliable aeroelastic analysis of helicopter rotors is still a challenging task due to the complex aerodynamic environment around the rotor disk and its strong interaction with the blade motions during the operation. One of the important features over the flow field is the blade vortex interaction (BVI), which generates the most annoying and intrusive noise from helicopter rotors [1]. The BVI is caused by the interaction between the rotor blades and their trailed wakes and this occurs mainly in low speed transition and maneuvering flights and causes significant noise and vibration problems. In order to understand the formation of vortex wakes and their interaction leading to noise and vibration, an international collaborative work, HART II [2], was conducted in 2001, followed by the earlier HART I [1]. Particularly, the goals of the tests were to measure the noise level, airloads, vortex wakes, and blade motions.
With the measured data set accumulated from the tests, a variety of correlation studies have been performed [3-12]. These range from low-order CSD (Comprehensive Structural Dynamics) methods [3-7], hybrid methods [8-9], and more sophisticated CSD/CFD (Computational Fluid Dynamics) coupled approaches [10-12]. Most CSD codes adopt a liftingline type aerodynamic model coupled with various levels of vortex wake representation, resulting in first-principle aeroelastic analysis solutions at a reasonable cost. This offers many advantages over other heavier computational methods. However, it is generally conceived that the CSD approaches alone lack critical accuracy, especially in the prediction of vibration, loads, and noise level of helicopter rotors. Therefore, a high resolution CFD solver is required in any form and should be combined with CSD codes in the evaluation of the rotor flow fields.
An interesting and alternative way for the aeroelastic analysis could be the “mechanical airloads” approach where the distribution of airloads along the span and azimuth of the rotor is prescribed using the favorable measurement data obtained from the wind tunnel or flight tests. Ormiston [13], Ho et al. [14], and Datta et al. [15] applied this method to examine the structural dynamic response of UH-60A rotor blades using the measured airloads data. This has originally been used to determine whether the possible sources of deficiencies resulted from either aerodynamic or structural discipline, in the prediction of aeroelastic responses. This technique is simple to apply and quite promising, however, the accurate measurement of air data around the rotor blades should be made priori and also available at the time of application. In case of HART II, only one radial location (87% radius) along the blade span was arranged to measure the pressure data and, hence, this would not be sufficient enough to cover the whole blade. Because of the limited data set for the HART II measurement, no prior attempt has been made to use the “mechanical airloads” approach.
In the present study, the accuracy of the CSD model on the estimation of blade aeroelastic responses and structural loads of the HART II rotor is assessed by adopting the “mechanical airloads” approach. Instead of using measured airloads whose data are scarce in the HART II case, computed airloads obtained using a three- dimensional compressible flow solver KFLOW are prescribed along the blade span and azimuth variations and replaced with the CSD lifting-line airloads. In cases where the computed airloads are used to prescribe the aerodynamic loads, the prediction capability of the CFD analysis is crucial for accurate and realistic analysis results and these should be comparable with the measurement records. In order to satisfy the requirement, a refined grid system having approximately 19.2 million calculation cells as well as higher-order time integration schemes are employed in the CFD analysis. In addition, the inboard region of the blades is modeled as closely as possible with the experimental test specimen of HART II blades.
There is no argument that a full CSD/CFD coupling is desirable in the end, however, this kind of intermediate approach should be necessarily performed to gain knowledge about different levels and categories specified at each discipline, separated between the aerodynamic and structural aspects, with an enhanced view of correlation. In this regard, this work can serve as a stepping stone toward higher fidelity but a computationally heavier CFD/CSD coupling approach. Numerous collections
Numerous collections of publications can be found in the official HART II web site [16] . Most of the research is focused on the aerodynamic and aeroacoustic aspects of the rotor, and there is clearly a lack of published efforts on the structural dynamic aspects of the HART II rotor. A few exceptions are Lim et al. [3], Lim [10], and Kumar et al. [6]. They used a single CSD code to validate their predictions. The present approach adopts two different comprehensive codes, DYMORE [17] and CAMRAD II [18], to systematically validate the structural dynamic responses, to cross check the analysis results, and hence to bridge the gap in the literature before more advanced CFD/CSD coupled aeroelastic analysis is performed.
The HART II test was conducted in the open-jet anechoic test chamber having an 8m x 6m cross-section in the German-Dutch wind tunnel (DNW). The rotor was in descent flight conditions with an advance ratio
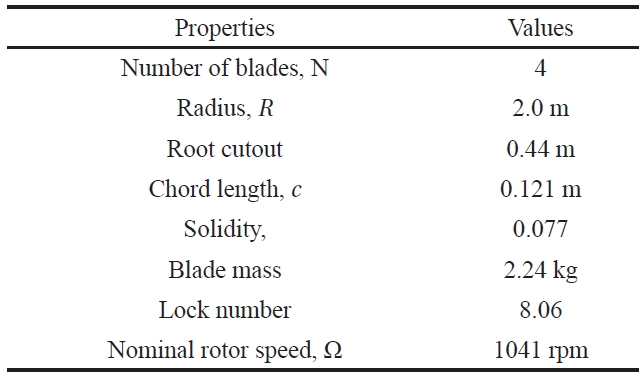
For the HART II rotor, 40% Mach-scaled models of the production BO-105 hingeless rotors were built and fabricated. The blades were dynamically scaled to match the natural frequencies of the first three flapping modes, the first two lag modes, and the first torsion mode of fullscale versions. The chord length was increased by 10% to compensate for the Reynolds number error of the scaled blades. The blades had a rectangular platform shape with -8 deg. linear pre-twist and 2.5 deg. pre-cone. The blades had a NACA23012 airfoil with a trailing-edge tab. The general properties of HART II blades are given in Table 1.
[Table 1.] General properties of the HART II rotor blades

General properties of the HART II rotor blades
The cross-section of blades was composed of the C-type spar, skin, and foam core. Both the skin and spar were made of glass fiber. The number 1 blade in the rotor system was designated as the reference blade and defined the rotor azimuth. Each blade was instrumented with six strain gauges: three for flap, two for lead-lag, and one for torsion, while the reference and opposite blades (numbered one and three) were equipped with a root pitch sensor. The pitch link loads were also measured with a strain gauge attached to the pitch links. The deflections of HART II blades were measured optically by using the SPR (Stereo Pattern Recognition) technique. To this purpose, 18 markers were distributed along the blade span and attached at both leading and trailing edges with equal spacing starting from a 22.8% radial location until the blade tip. The elastic blade motion was defined with respect to the rotor hub coordinate system. Both the flap and lead-lag motions were then obtained based at the quarter chord line from the measured set of data.
A three-dimensional compressible flow solver called KFLOW is used to obtain the computational fluid dynamics (CFD) airloads around the HART II rotor. The KFLOW [19] is a parallelized multi-block structured, Navier-Stokes solver and is capable of computing time-accurate moving body problems by employing a CHIMERA overlapping grid system. An accurate 2nd-order dual-time stepping method combined with the diagonalized alternating-direction implicit (DADI) method is used to advance the solution in the time domain. The inviscid flux is calculated using the 5th order Weighted Essentially Non-Oscillatory (WENO) scheme and the central differencing is used to obtain the gradients of the viscous flux. The k-ω Wilkox-Durbin (WD+) along with Spalart-Allmaras models are used for the turbulence models. It should be mentioned that, taking into account the HART II test conditions where viscous boundary layers over the blades were well attached, the viscous terms in the original KFLOW solver were turned off for efficient computations. Characteristic boundary conditions using the Riemann invariant are applied at the far field boundary, whereas a noslip or slip condition is applied at the solid wall of the blade.
In the aeroelastic simulation of a rotor system, the elastic blade deformations lead to changes in grid cell volumes, necessitating rigorous enforcement of the GCL (Geometric Conservation Law) [20], which states that the increase of a moving cell must be equal to the sum of the variations along the surfaces that enclose the volume. The GCL is applied to meet the conservative relations of the surfaces and volumes of the control cells in a moving grid system. The measured blade motion data taken from the HART II experiment are imposed on the blade movement at each time step. The converged solution at each physical time step is updated using a modified volume calculated from the GCL.
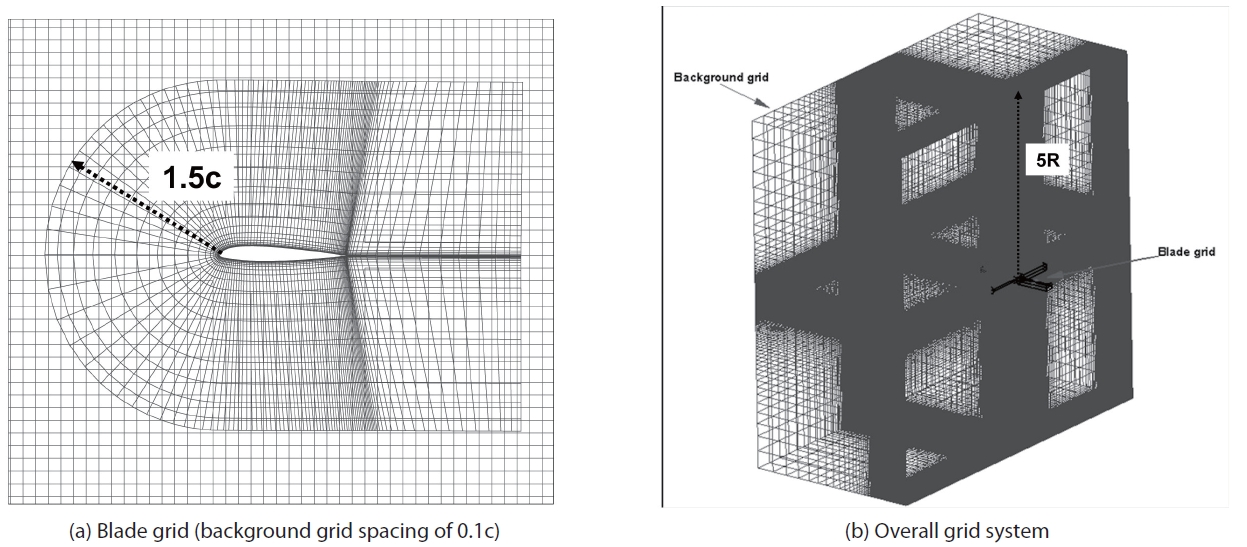
A moving overlapped Chimera grid system with two different types of grids (blade grid and background grid) is employed for the computation. Figure 1 presents a close-up view of the C-type grid around the blade as well as a perspective view of the grid system for the whole computational domain of the HART II blades. The blade grids extend 1.5 times that of the chord length c away from the blade surface in all directions. In order to capture the bladevortex interaction adequately, the body grids are clustered near the leading edge, trailing edge, and blade tip regions. They are also clustered in the normal direction near the wall of the boundary. The background grids consist of an inner region that extends 8 chord lengths above, 8 chord lengths below from the rotor disk plane, and 2 chord lengths away from the blade tip. This inner region has uniform spacing in all directions. The farfield boundary extends 5 times larger than the blade radius R from the rotor hub. The background grid spacing is chosen as 0.1c, after a series of grid sensitivity studies [19].
Two different CSD codes are used to gain confidence and double-check the analysis results. A nonlinear flexible multibody dynamics code DYMORE [17] and a comprehensive aeroelastic analysis code CAMRAD II [18] are employed for this purpose. Each of the CSD codes is briefly described in this section.
2.3.1 DYMORE
DYMORE is a nonlinear flexible multibody dynamics analysis code that includes rigid bodies, rigid/elastic joints, and elastic bodies such as beams, plates, and shells to model and deal with a rotor system having complex topologies and geometries. It uses a geometrically exact beam theory [21] for the representation of the elastic blade. For the aerodynamic forces and moments, a two-dimensional airfoil theory with an airfoil table look-up is used along with a finite-state dynamic inflow model [22]. This inflow model is an intermediate level of the wake representation compared with the more sophisticated free wake methods. To improve the rotor wake modeling capability, Roget [23] incorporated a time marching free vortex wake method, called the UM free wake model [24], into DYMORE.
The UM free wake analysis is based on a potential flow with the vorticity being concentrated on a finite number of vortex filaments. The motion of a point on a vortex filament is described by the motion of Lagrangian fluid markers as:
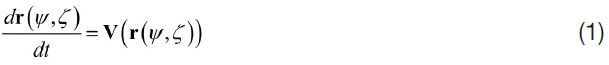
where r is the position vector of the point on the vortex filament and V is the local fluid velocity at the point r. In addition,
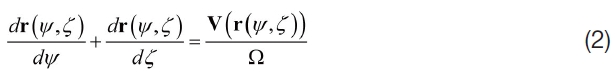
where Ω is the rotational speed. The left-hand-side of Eq. (2) is a one-dimensional wave equation. The complexity of the problem comes from the right-hand-side term, which is highly nonlinear. In order to solve Eq. (2), the domain (
The trailed near wake is also taken into account to improve the accuracy of the solution. The near wake consists of a series of vortex filaments trailing behind the blades for a given angular distance. The trailed vortices comprise the near wakes, which are assumed to be planar with a fixed angular distance. The tip vortex that constitutes the free wake extends beyond the near wake with the strength equal to the maximum bound circulation along the blade. The strength of the blade bound vorticity is determined from the induced velocity at the control points.
The computational parameters used for the analysis of free wake require careful investigation before practical use. A total of 150 markers are used for the tip vortex wake while the number of near wake segments is 3. In addition, the azimuthal step size Δ
2.3.1 CAMRAD II
CAMRAD II is a comprehensive aeromechanical analysis code that is characterized by multibody dynamics, nonlinear finite elements, and various levels of rotorcraft aerodynamics [18]. For structural analysis, the blade motion consists of the sum of rigid body motion and elastic deformation. Rigid body motion describes the motion of one end of a beam element, and elastic motion is measured relative to the rigid motion. The beam elements are represented by three translational (axial, flap, and lead-lag) and three corresponding rotational degrees of freedom (DOF) that results in a fifteen DOF for each beam element [18].
The aerodynamic model used in CAMRAD II is based on a lifting-line theory combined with steady two-dimensional airfoil characteristics and the vortex wake. In addition, attached-flow unsteady aerodynamics along with various dynamic stall models is implemented in CAMRAD II. For the vortex wake model, free wake geometry is used to compute the non-uniform induced inflow distribution around the rotor disk. The formation of the tip vortices is modeled using a simple rolled-up wake model or a multiple trailer with the consolidation model [25]. The rolled-up wake model is based on the feature that a tip vortex forms at the blade tip. Both single and dual peak models are available taking into account the distribution of bound circulation peaks along the blade span. Single-peak model is used in the present study considering the fact that the free stream velocities in the HART II experiment are relatively low (
The distribution of airloads over the rotor disk is first computed by the CFD solver, KFLOW, using the standard grid system where the background grid spacing is 0.1c, while the time step increment is set to 0.1 degrees along the azimuth. The measured blade motion data are fed into the CFD analysis to take into account the effect of elastic deformation regarding the blades. In parallel, both CAMRAD II and DYMORE predictions using their own lifting-line aerodynamic models are carried out to obtain the blade deflections and structural loads. Next, the CFD airloads data are computed and then prescribed along the span and azimuth of the blades by replacing the lifting-line airloads in the CSD analyses. Finally, the resulting blade deflections and structural loads are compared with the HART II measurement data. Only the baseline (BL) case of the HART II rotor is considered in this study.
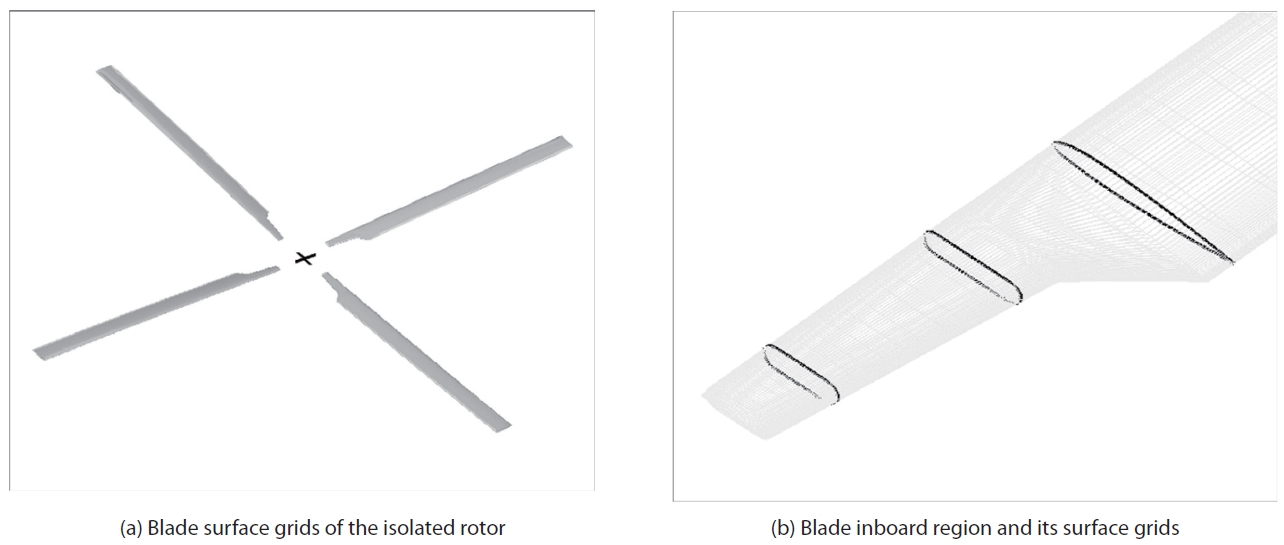
The flow field around the HART II rotor is descretized using two different grid systems: blade grid and background grid, as depicted in Fig. 1. The number of cells used for the calculation has a dimension of 169 x 97 x 21 (chordwise, spanwise, and normal) in the blade grid system, while the background grid has a uniform spacing of 0.1 chords in the region around the blades. Approximately 19.2 million cells including both the blade and background grids are used to model the HART II rotor. In addition to the main blade region that starts from a 22% radial location until the blade tip, the inboard region, covering 10% to 22% of the radial locations, has newly been modeled as closely as possible with the CAD (Computer Aided Design) drawings given in the HART II website. The inboard region has rectangular section shapes having an outer width of 44 mm and an outer height of 16 mm with rounded corners [26]. Figure 2 shows the perspective view of the isolated rotor system and a closeup view of the surface grids distributed over the inboard, transition, and main regions of the blade.
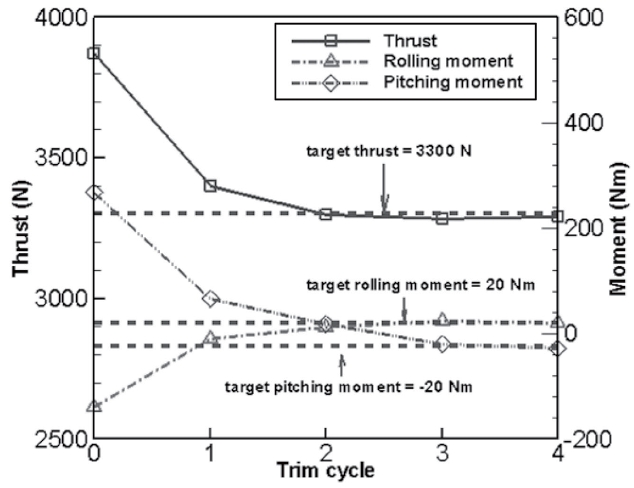
The target conditions for all the trim variables should be met before the correlation is made against the measurement data. The trim targets specified are 3300 N, 20 N-m, and -20
N-m, respectively, for thrust, rolling, and pitching moments [16]. The rolling and pitching moments are defined as positive when the advancing side goes down and when the nose-up motion is induced. Figure 3 presents the change of trim values for the thrust, rolling and pitching moments with respect to the advancement of trim cycles. One trim cycle consists of 2 revolutions of the rotor blade: three quarters for calculation of derivatives and the remaining quarters for solution iteration. As can be seen in the plot, converged solutions are achieved overall after roughly four cycles of trim iteration are proceeded. With the matched trim values, the pitch control settings for the blades are obtained as: 2.51o, 1.39o, -1.16o for collective (
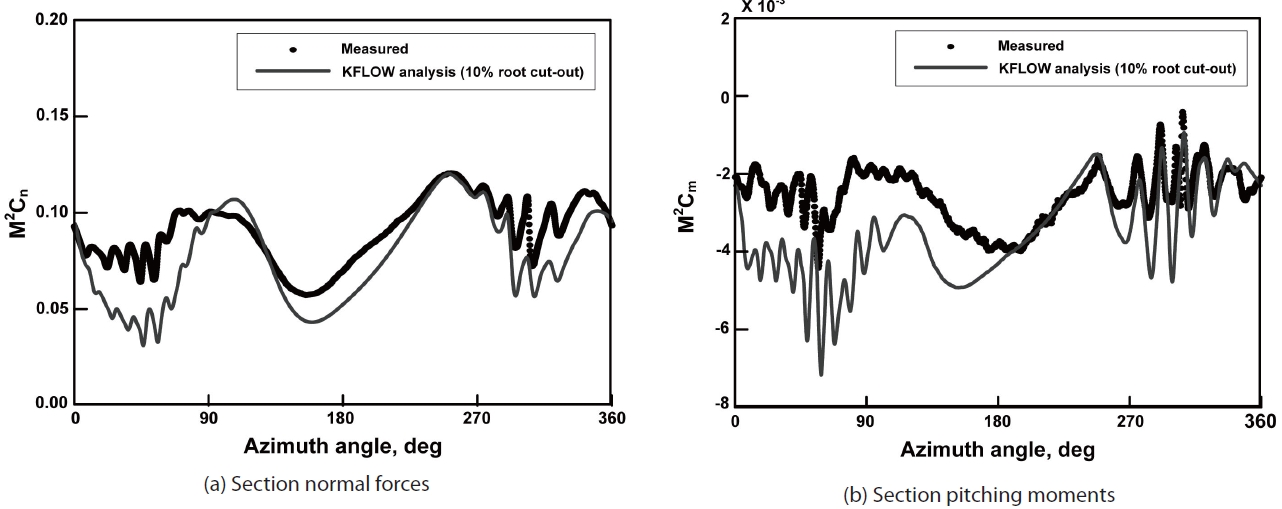
Figure 4 demonstrates the comparison of the nondimensionalised section normal force coefficient, M2Cn, and the pitching moment coefficient, M2Cm, at an 87% blade radial station between the KFLOW predictions and measurement data, where M is the flow Mach number. The black dotted circles denote the measured data while the blue continuous lines correspond to the KFLOW analysis results. It is seen that there is a slight under estimation of section airloads compared with the measured data, but in general, a good correlation is obtained in terms of both the magnitude and phase of the time history solutions. Particularly, the BVI events at either the advancing or retreating side are captured reasonably well by the current CFD analysis.
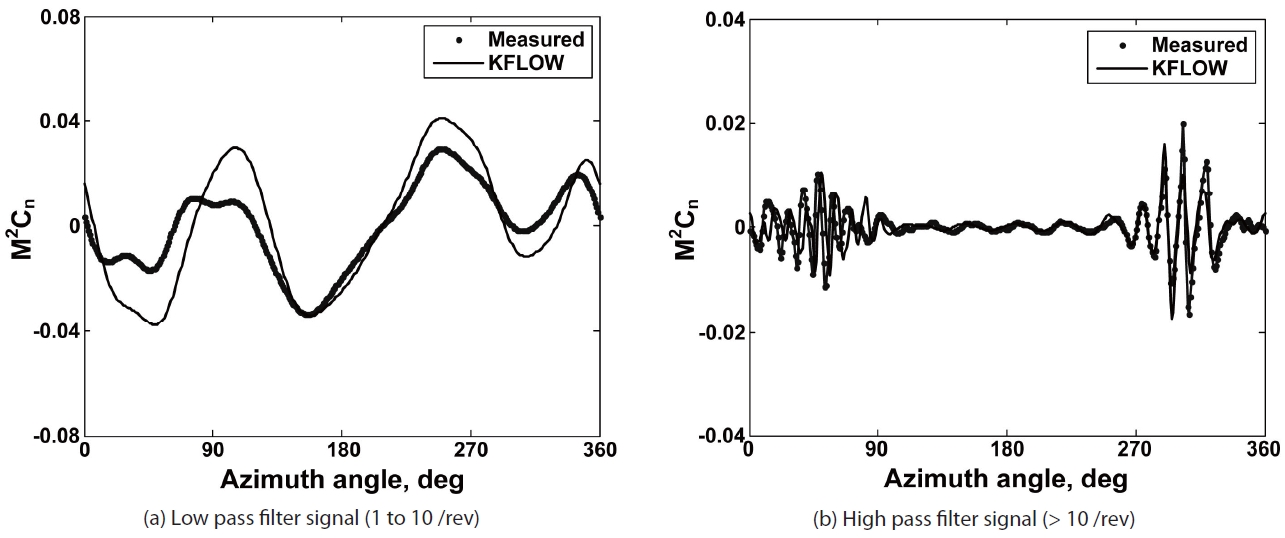
In Fig. 5, all airload signals are processed into a low pass
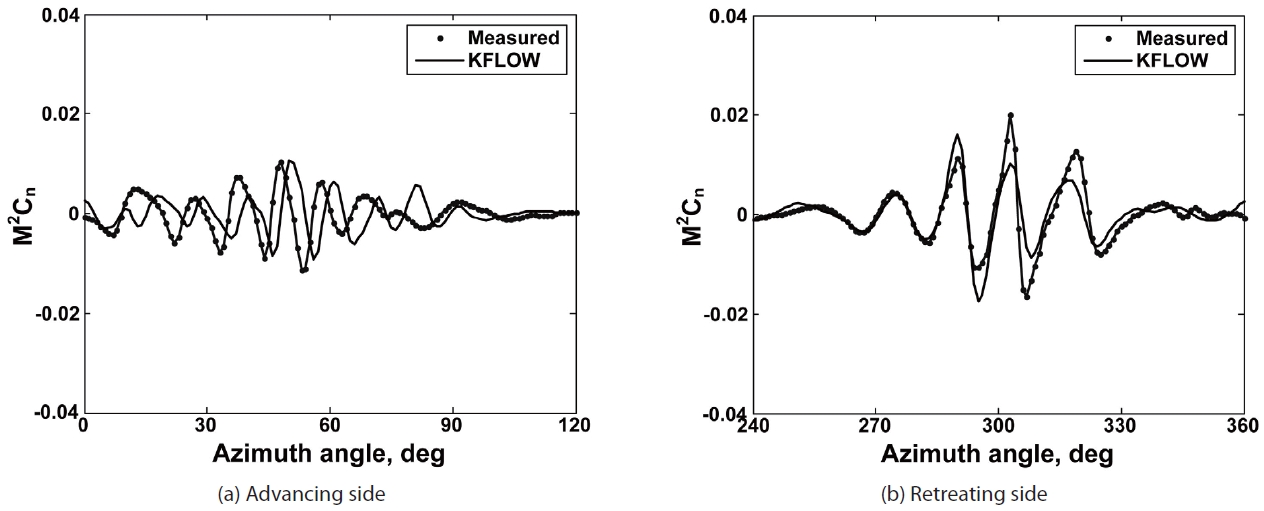
filter signal (1 to 10/rev) and a high pass filter signal (larger than 10/rev). The low frequency signals in the airloads are mainly associated with structural responses and blade control inputs, while the high frequency signals represent the BVI-induced loadings. A 3/rev behavior of section airloads is clearly seen from the low frequency signals. The phase is correctly matched but the peak-to-peak magnitudes are overestimated by the KFLOW analysis. Figure 6 shows an enlarged view of the high pass filter signal in the azimuthal scale at the advancing and retreating sides of the rotor. In the advancing side, the peak-to-peak values are matched well, however, a slight phase shift is noticed over most of the BVI loadings. Compared with the CFD results, one or two BVI loading signals are missed in the measured data. This might be related with the larger time step size in the HART II measurement data: the measured airloads data have a time resolution of 0.176° while the KFLOW has 0.1° resolution. Whereas in the retreating side, an excellent correlation is
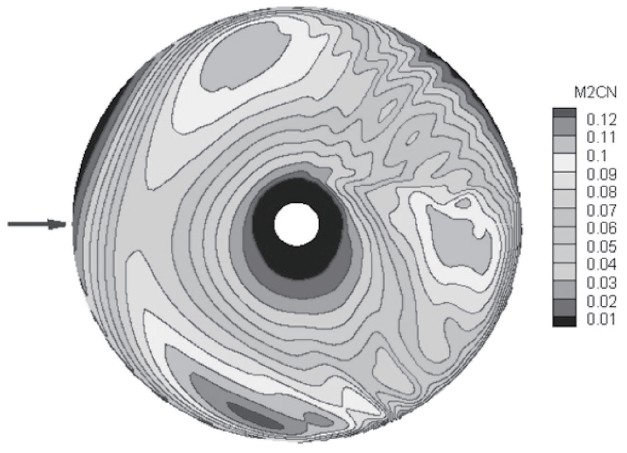
obtained in terms of the number of BVI oscillations and phase angles, in spite of the slight under prediction of the magnitudes. A finer grid system along with a fixed-frame fuselage model may improve the correlation. But, overall, the correlation made at 87% radial station is regarded as acceptable. In the next section, the computed KFLOW airloads are transferred to each of the CSD codes to prescribe the aerodynamic loads (mechanical airloads) over the rotor blades. Figure 7 illustrates the distribution of the section normal forces M2Cn over the entire rotor disk. The 3/rev loading characteristics as well as the BVI oscillations at the advancing and retreating sides are observed by the contour plot.
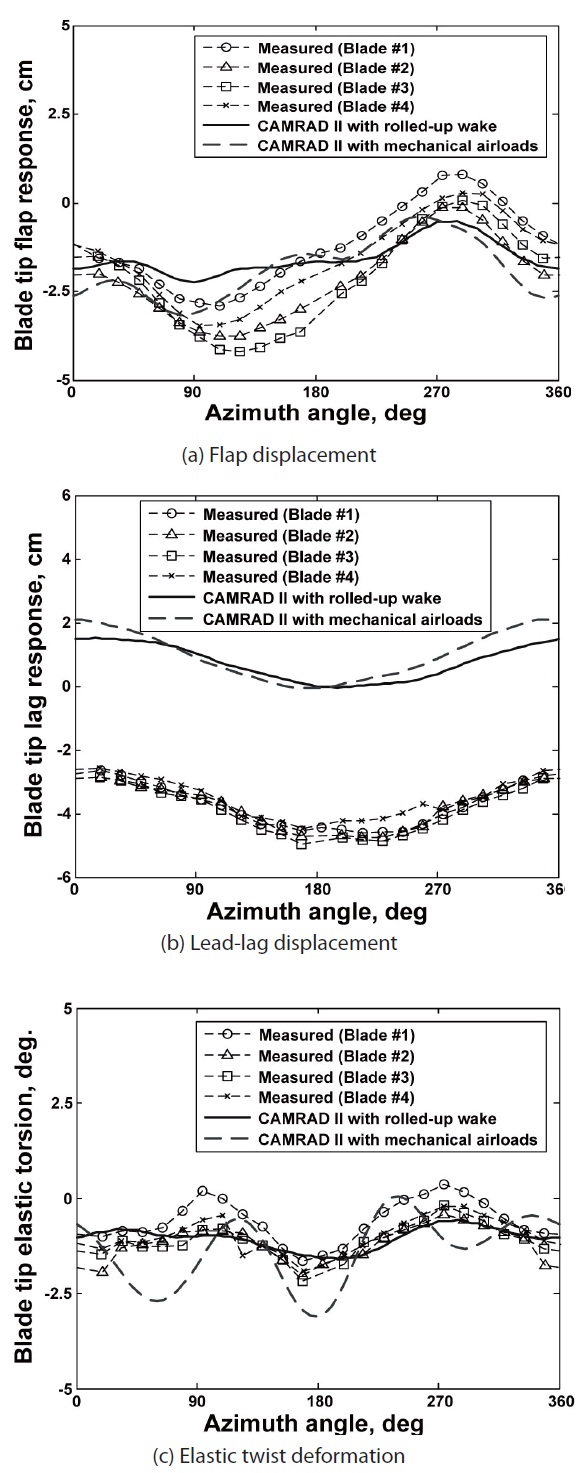
Figure 8 shows the comparison for the time variation of flap, lead-lag, and torsion deformation at the blade tip, respectively, between the measured data and the computed results by CAMRAD II for the BL case. For the CAMRAD II predictions, either the stand-alone computation with a rolled-up free wake model or the combined computation with mechanical airloads is employed. The blade deflections are measured at 24 azimuth positions in increments of 15o. In order to attain a comprehensive correlation, the measured deflections for all four blades are presented together. It is noted that the experimental data exhibits significant bladeto- blade dissimilarities. The sign conventions of the blade deflections are defined as positive when the blade undergoes flap-up, lag-back, and nose-up motions, respectively. The flap deflections are obtained by removing the pre-cone angles from the vertical displacements, while the elastic torsion is obtained by subtracting the pitch control inputs and pre-twist angles from the total geometric pitch angle [7].
As is demonstrated in Fig. 8, the CAMRAD II results with the rolled-up wake model show a reasonable correlation with measured values for all the elastic deflections, except reduced peak-to-peak magnitudes in flap and elastic torsion and a constant offset amounting 1/3 of the chords
in the lead-lag deflection. This constant offset has also been observed by other researchers [6,10]. It is seen that the mechanical airloads analysis improves the correlation, by increasing the peak-to-peak magnitudes of blade deflections. Figure 9 presents the comparison of deflections
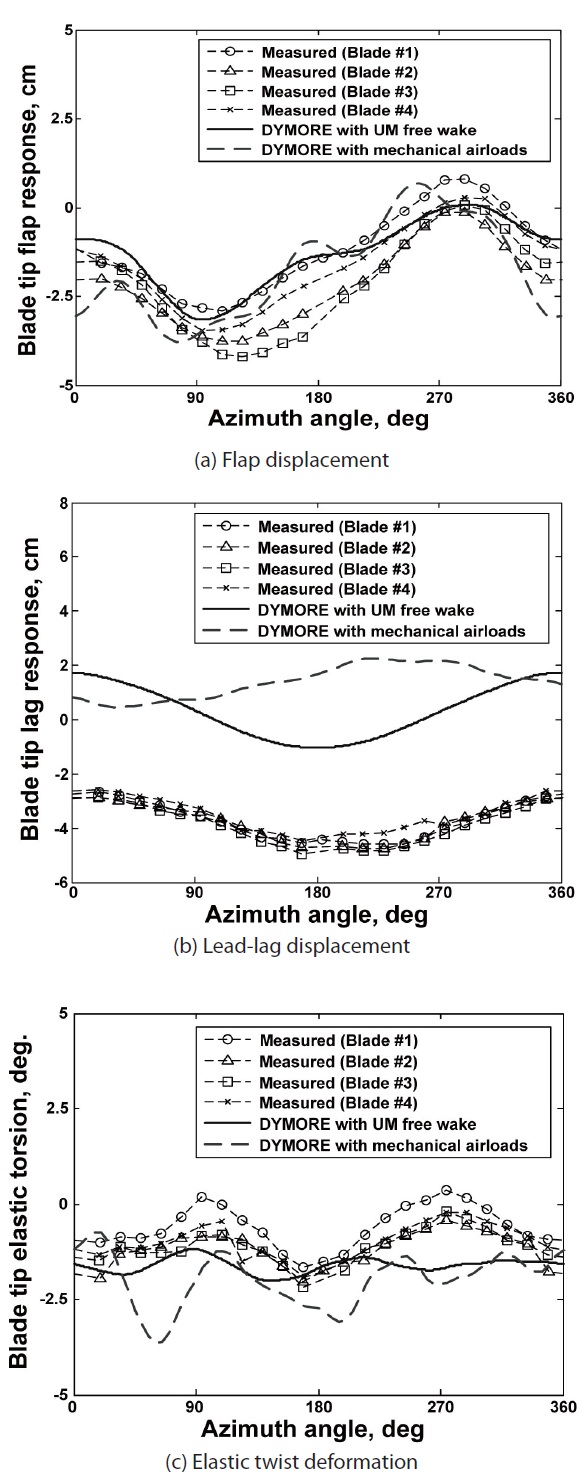
made using the DYMORE with the internal aerodynamic model and the prescribed airloads computed by KFLOW. The correlation against measured data is generally good for the DYMORE predictions with internal aerodynamics, while the mechanical airloads analysis demonstrates more oscillatory behavior than that with other methods. The phase shift problem encountered in the mechanical airloads solution on lead-lag deflections is unclear at this moment, and requires further investigation in the future.
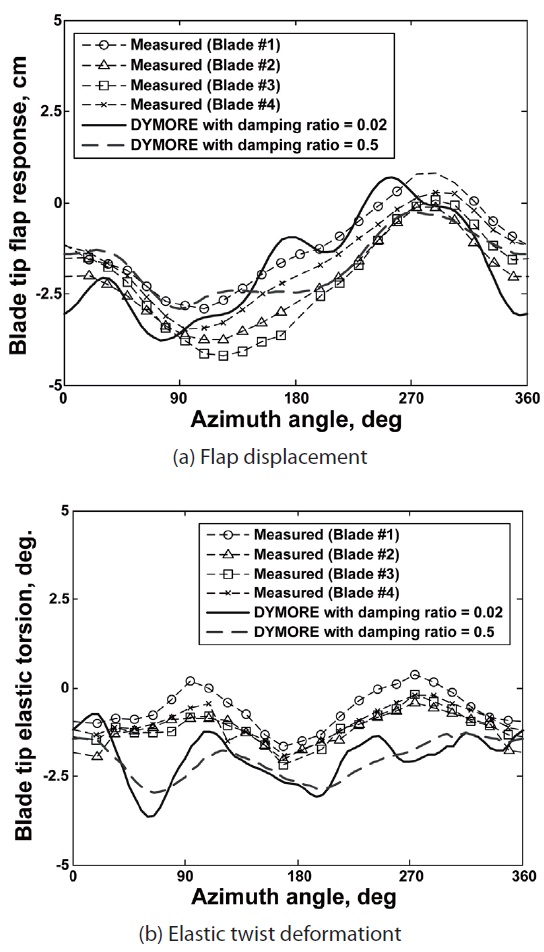
The larger oscillatory behavior in the mechanical airloads solution is due to the fact that no adequate amount of damping is present in the analysis system. In conventional aeroelastic analysis, a necessary amount of damping is supplied from an external aerodynamic model. A parametric investigation is carried out to identify the effect of damping on the blade motion of the HART II rotor. Figure 10 presents the influence of damping on the flap and elastic twist deformation at the blade tip obtained using DYMORE, where the damping ratios are varied from 0.02 to 0.5. It should be mentioned that the
damping coefficients amounting 0.5 are not at all impractical in the motion of helicopter blades, with a view that the flap mode is highly damped [27]. As is illustrated in Fig. 10, the oscillatory response becomes flattened with the increase of
damping, and a better correlation in terms of peak-to-peak magnitudes is obtained with a damping ratio of 0.5.
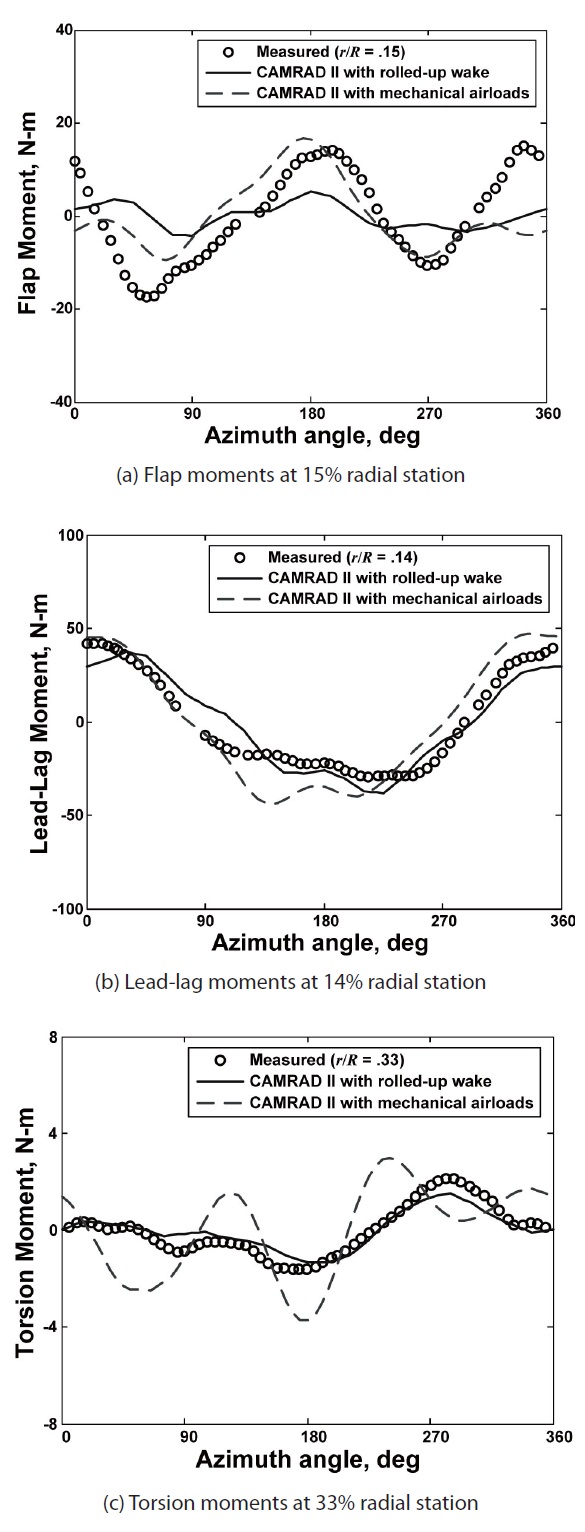
To measure structural loads, a total of six strain gauges are attached to the inboard region of the blades. In this study, each of 15%, 14%, and 33% blade radial stations is chosen for the comparison of flap bending, lag bending,
and torsion moments, respectively. It should be noted that the mean values of the structural moments were removed from the original test data and thus only the 1/rev and higher harmonic components were compared with each other [10]. It is defined as positive when the blades are bent up (flap bending), when the blades bent toward the leading-edge (lead-lag bending), and when the pitch-up motion occurs (torsion moment), respectively.
Figure 11 shows the comparison of the flap bending, lead-lag bending, and torsion moments at specified radial locations obtained by the CAMRAD II with either the internal aerodynamics or mechanical airloads, against the measurement data. The correlation is acceptable for the internal CAMRAD II predictions on lead-lag bending and torsion moments, while the correlation is poor for the flap bending moments. The mechanical airloads approach greatly improves the flap bending moment predictions in terms of the magnitude and phase of the solution, whereas it significantly deteriorates the torsion moment correlation. Like in the elastic deflections, more oscillatory behavior is indicated in the torsion moments with the mechanical airloads analysis.
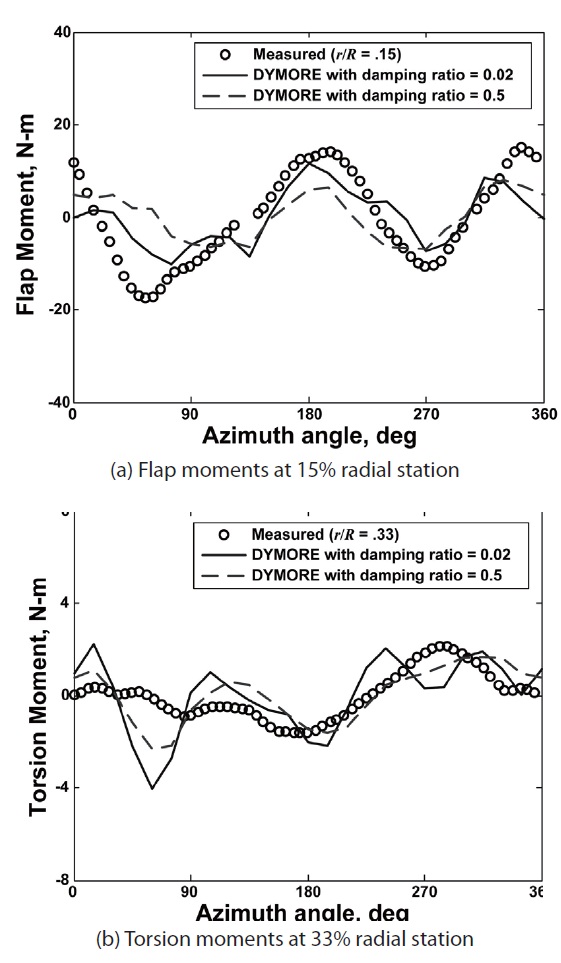
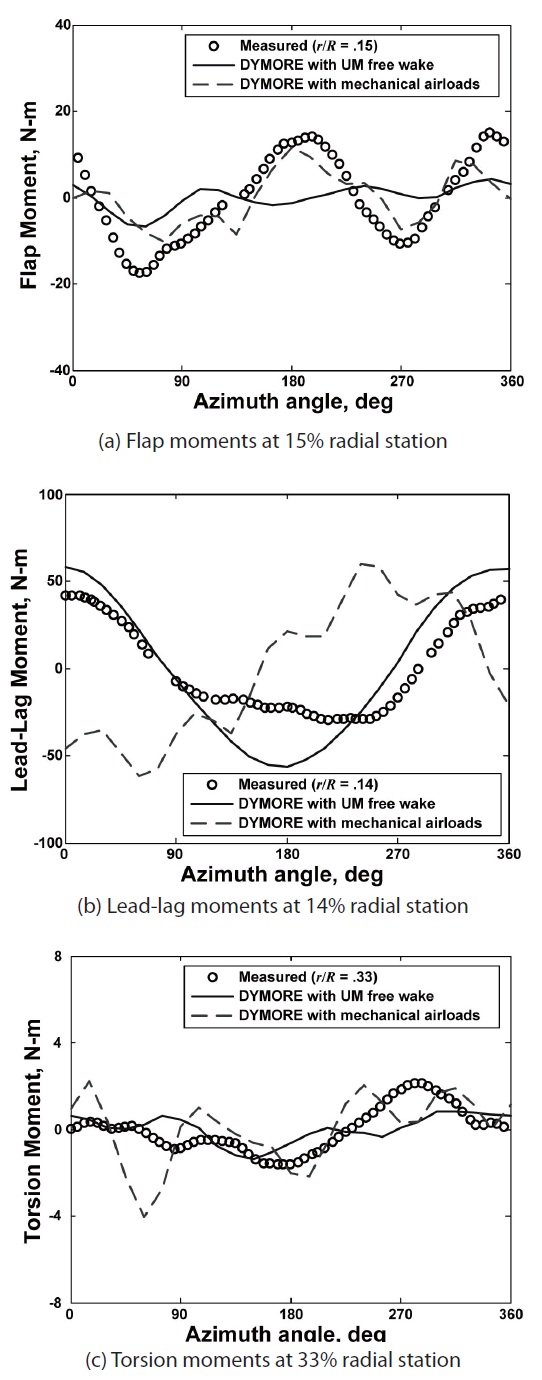
Figure 12 shows the DYMORE predictions with internal aerodynamics and prescribed airloads against the measured structural loads. As in the CAMRAD II results, an excellent correlation is obtained by the mechanical airloads method for the flap bending moments, while the lead-lag bending and torsion moments show poor correlation against the measured data. It is indicated that the lead-lag bending moment predictions by DYMORE shows unrealistically large oscillatory behavior along the time scale. The reason is unclear at this moment. Once again, a wavier response is noticed in the torsion moment predictions when the mechanical airloads method is used. In a way, to fix this problem and also to identify the effect of damping on structural loads, the damping ratios are arbitrarily varied as 0.02 to 0.5. The results are presented in Fig. 13. A mixed response is obtained: with the damping ratio of 0.5, the peak-to-peak magnitudes are substantially reduced, thereby degrading the correlation for flap bending but improving the correlation for torsion moments, as compared with the measured data.
In this work, the accuracy of the CSD model on blade aeroelastic responses and structural loads of the HART II rotor was assessed by combining CSD and CFD methods in the form of mechanical airloads. Two different CSD codes,
CAMRAD II and DYMORE, were employed to systematically validate the structural dynamic responses and double check the analysis results. For the mechanical airloads analysis, computed airloads by a three-dimensional compressible flow solver KFLOW were prescribed over the rotor blades and replaced with the CSD lifting-line airloads. To enhance the computation, the inboard region of the blades was modeled as closely as possible with the original HART II rotor. A good correlation of airloads at 87% span location was obtained by the CFD computation. The predicted results on blade elastic deflections using the prescribed airloads revealed more oscillatory behavior than those by lifting-line methods, but this became fixed and a better correlation was achieved with the inclusion of artificial damping into the rotor system. It was observed that a significant improvement of flap bending moments was obtained using the prescribed airloads method. However, torsion moment predictions demonstrated less satisfactory results compared with isolated comprehensive analysis. The fully coupled CFD/ CSD approach was suggested to be employed for a more improved correlation.