Lewin (1966) reported that germanium (Ge) was toxic to diatoms. Subsequently, this element (as GeO2) has had an important role in the laboratory culture of marine algae. Accordingly, researchers will typically use 5-10 mg L-1 of GeO2 in their medium to prevent growth of diatoms during initial stages of algal isolation (e.g., McLachlan 1973, Garbary et al. 2004). The basis for this use is that Ge and silica (Si) are chemically very similar, and Ge inhibits deposition of Si into the frustule of the diatoms (Chiappino et al. 1977). This application of GeO2 has proven effective in the culture of red and green algae (e.g., Garbary and Tam 1989, Scrosati et al. 1994), and only in very high concentrations (20-30 mg L-1 GeO2) is there any inhibition of red algal growth (Tatewaki and Mizuno 1979). It has long been known, however, that brown algae have negative responses to GeO2. West (unpublished, see Parker 1969) first noticed the inhibition of brown algae in the presence of Ge, and McLachlan et al. (1971) later reported growth asabnormalities in
The mechanism of Ge toxicity for brown algae is unknown. While species of Phaeophyceae may contain Si (Parker 1969), this is no more than the concentration in seawater. In addition, the omission of Si from the growth media for brown algae has no apparent deleterious effects (McLachlan 1977). Thus the physiological basis for Ge toxicity in brown algae is unlikely to be similar to that in diatoms, and Shea and Chopin (2007) even reported positive growth responses of low concentrations of GeO2 on
>
Experimental material and culturing
Embryos were measured using a calibrated Olympus BH2 microscope (Olympus Optical Co., Ltd., Tokyo, Japan) at 200× or 400× magnification. Ten or 15 embryos from each condition were measured for embryo length (top of embryo, excluding hairs, to tip of rhizoid), embryo diameter, and rhizoid tip diameter. In addition, the number of apical hairs was counted. The apical hairs usually appeared in 6-7 days old embryos and were counted at 7-8 days AF.
>
FM4-64-staining of membranes
Membrane aggregations were stained in embryos (22-24 h AF) with 5 μM of FM4-64 [N-(3-triethylammonium- propyl)-4-(6-(4-(diethylamino)phenyl)hexatrienyl) pyridinium dibromide] (Invitrogen, Burlington, ON, Canada) for 30 min (Belanger and Quatrano 2000, Bolte et al. 2004, Hadley et al. 2006). The stain was prepared from the stock solution (10 mM in dimethyl sulfoxide [DMSO]) and diluted in seawater. The embryos were observed by Nikon Microphot FXA microscope (Nikon, Tokyo, Japan) as described by Belanger and Quatrano (2000).
Images from both transmitted light and epifluorescence microscopy were captured using the CCD SPOT2 camera system (Diagnostic Instruments, Sterling Heights, MI, USA) mounted on the Nikon Microphot FXA microscope.
>
Pulse amplitude modulated (PAM) fluorometry
Fluorescence measurements of
From the rapid light curves (RLC) of photosynthesis we calculated relative electron transport rate (rETRmax), photosynthetic efficiency (αETR) and light saturation (
The photosynthesis experiment was repeated using a different collection from the same site. Based on the similarity of results in the two runs, we only report on the one for which the morphometric data was collected.
Ten-days old attached embryos were resuspended and concentrated by centrifugation (500
Photosynthetic data were analyzed using a general linear model (GLM) procedure of SYSTAT version 9 (SPSS Inc., Chicago, IL, USA) to determine if significant differences occurred among treatments and times for
>
Changes in embryo morphogenesis
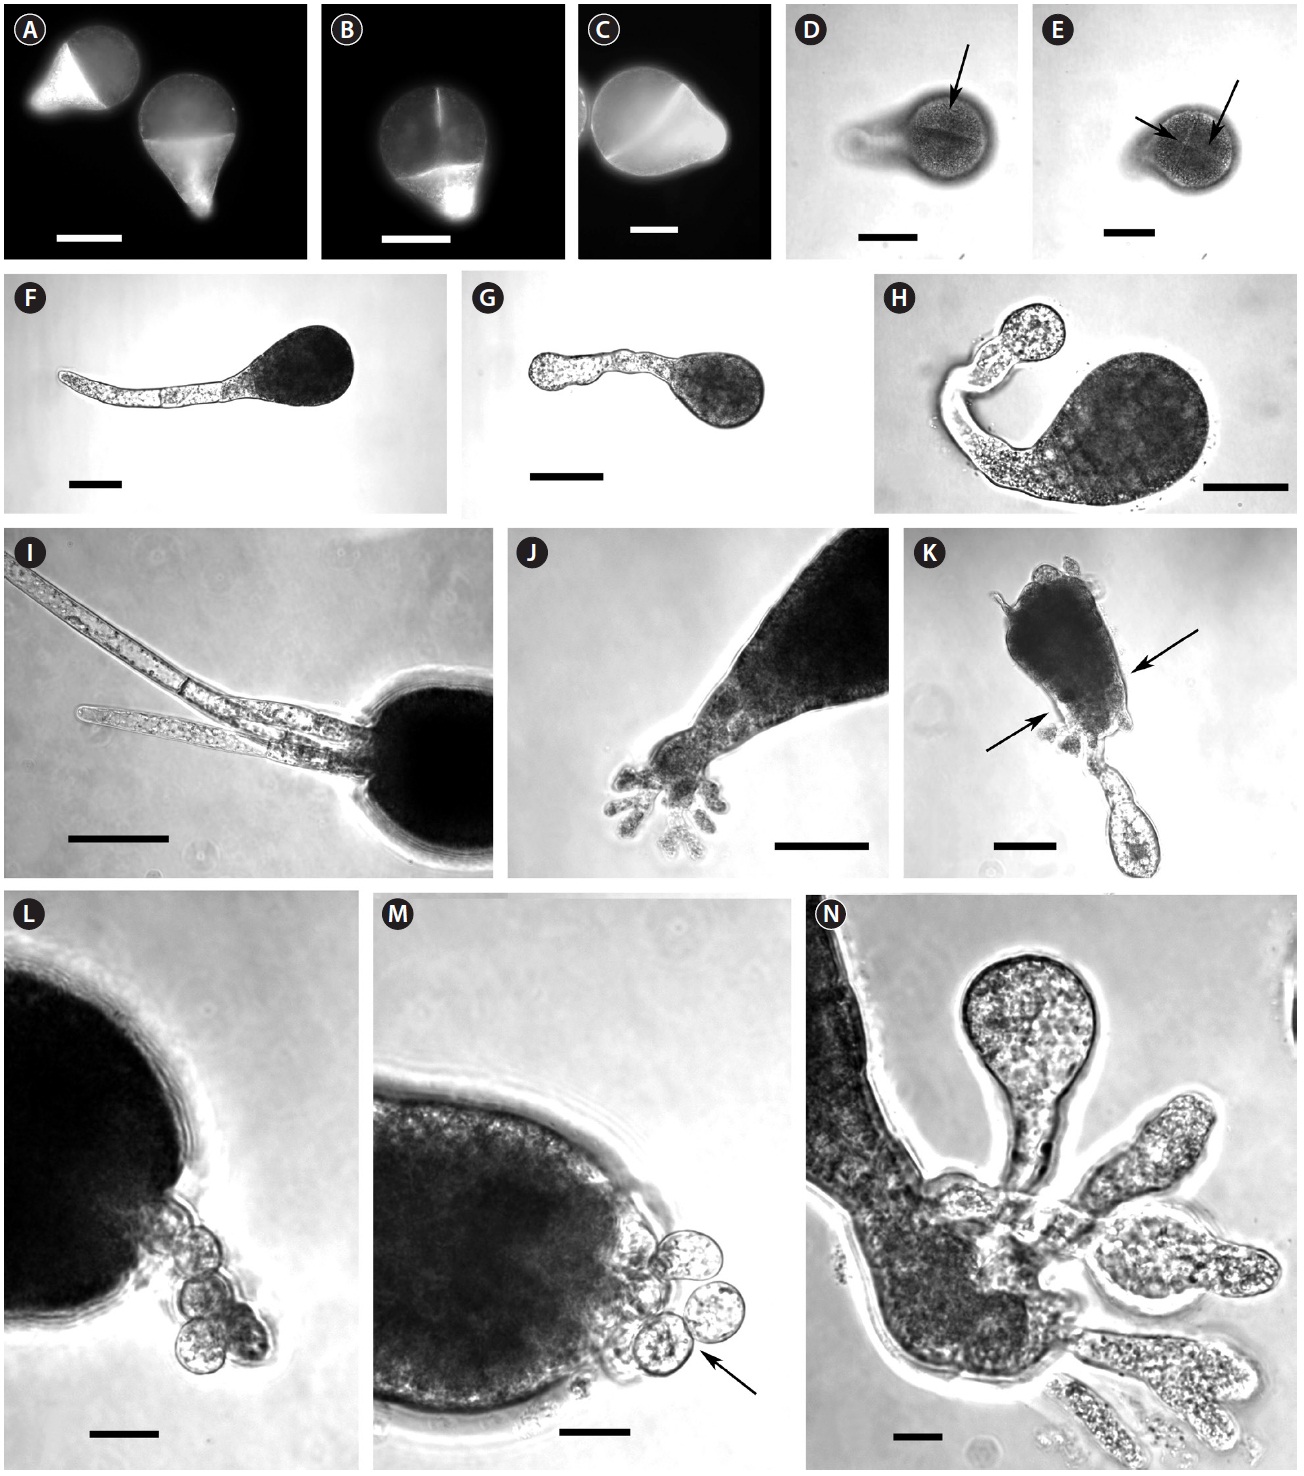
GeO2 at 5 mg L-1 altered the growth and morphogenesis of
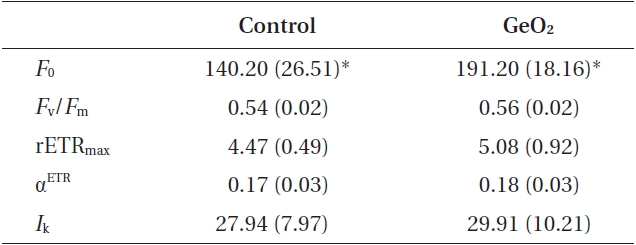
By 3-4 days AF conspicuous morphological differences developed. Ge-treated embryos were smaller, and had wider diameter rhizoid tips (Table 1), which looked inflated (Fig. 1G & H). Differences in rhizoid morphology were particularly apparent, as control embryos had attenuated tips (Fig. 1F). Many of the Ge-treated embryos also had curved rhizoids (Fig. 1H). Whole 5 days AF embryos were significantly longer than those in Ge (Table 1). This size difference was largely a function of rhizoid elongation as there was no difference in embryo ‘body’ length (i.e.,
[Table 1.] Characteristics of control and GeO2 treated embryos of Fucus vesiculosus
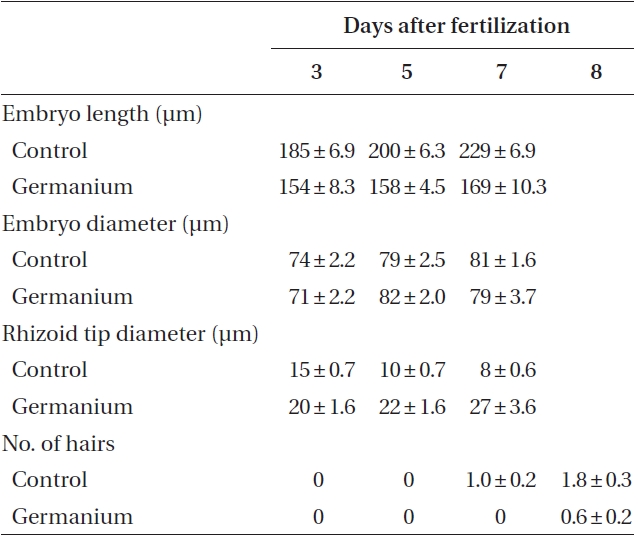
Characteristics of control and GeO2 treated embryos of Fucus vesiculosus
the non-rhizoidal portion). All of these metrics were significantly different between control and treatment conditions (Student’s t-test, p < 0.01).
At 7-8 days AF most control embryos had developed conspicuous up to 3 apical hairs (Fig. 1I). The hairs were up to six cells long, and cells were regularly cylindrical. The rhizoids were often highly branched and often developed a rhizoidal pad (Fig. 1J). The Ge-treated embryos were often misshapen with irregular outlines (Fig. 1K). These embryos were often fragile, and tended to break near the base of the ‘body’ part of the embryo (Fig. 1K). The apical hairs in Ge-treated embryos were sometimes absent, but always highly deformed. The cells in a given filament were spheroidal, and poorly aligned (Fig. 1L & M), sometimes appearing as a cell cluster at the embryo apex. The rhizoids showed the same inflated structures as previously (Fig. 1K & N). The tips of rhizoids were fragile and sometimes burst following resuspension (by gentle pipetting), which was never observed in control embryos. The number of rhizoid branches was reduced in Ge-treated embryos; however, some embryos did have a more usual number of, albeit deformed, rhizoid tips (Fig. 1N).
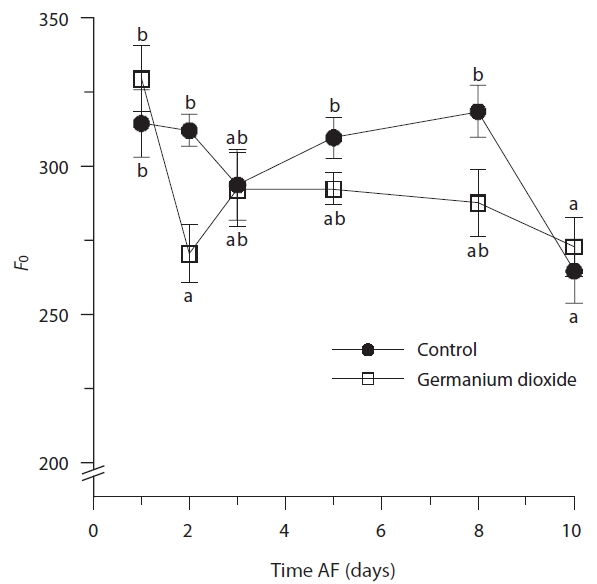
Photosynthetic characteristics in embryos developing in seawater alone and in seawater supplement with 5 mg L-1 GeO2 were measured over the first 10 days AF. The controls differed significantly from Ge-treated embryos
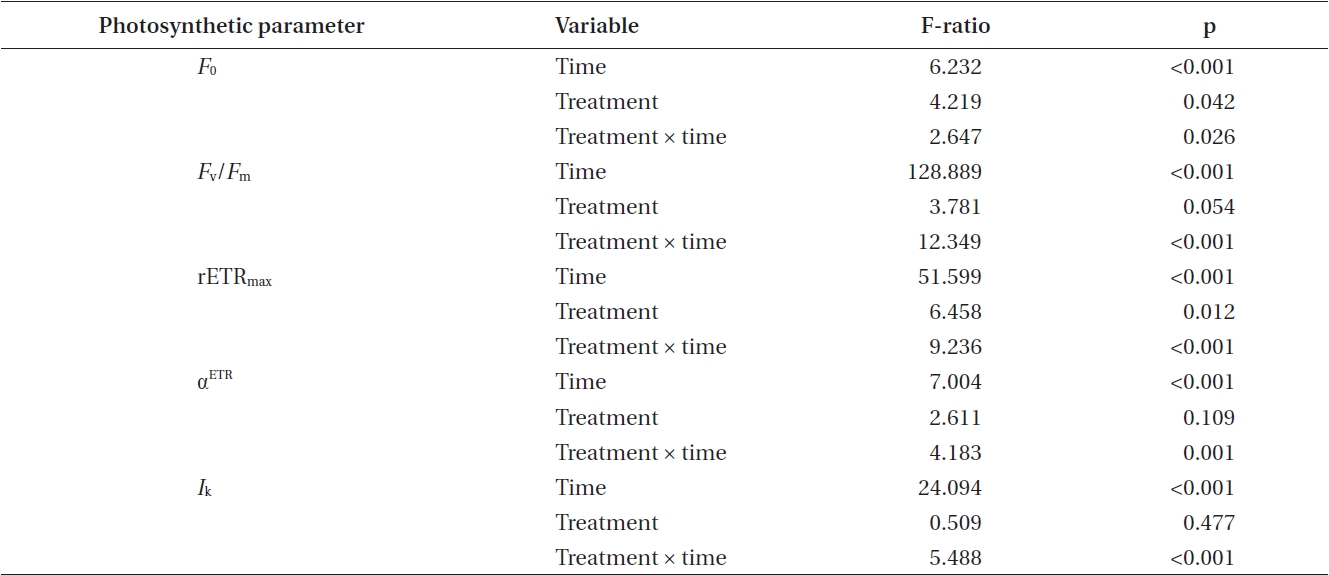
[Table 2.] Summary of ANOVA results for two-way analyses of photosynthetic data shown in Figs 2-6

Summary of ANOVA results for two-way analyses of photosynthetic data shown in Figs 2-6
in their minimum fluorescence (Table 2) and generally showed higher levels of
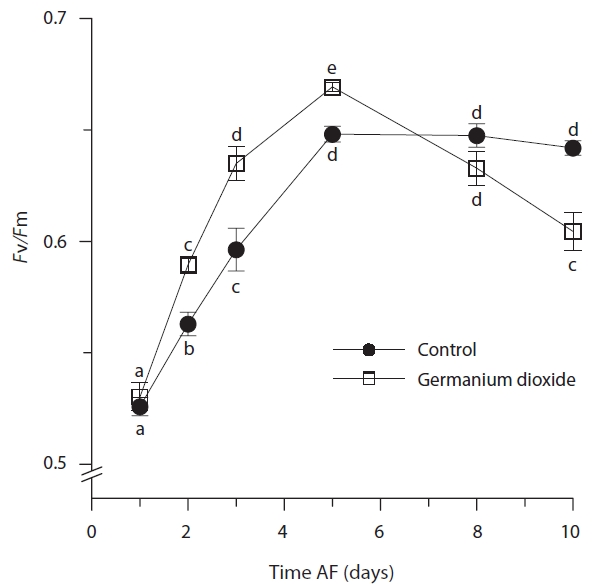
While the ANOVA suggested no significant overall difference between treatments for maximum quantum yield
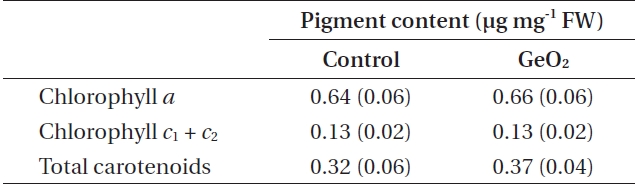
Photosynthetic pigment content in 10 days after fertilization and GeO2 treated embryos of Fucus vesiculosus
(Table 2), this is confounded by the differences attributable to time and the highly significant time × treatment interation. The
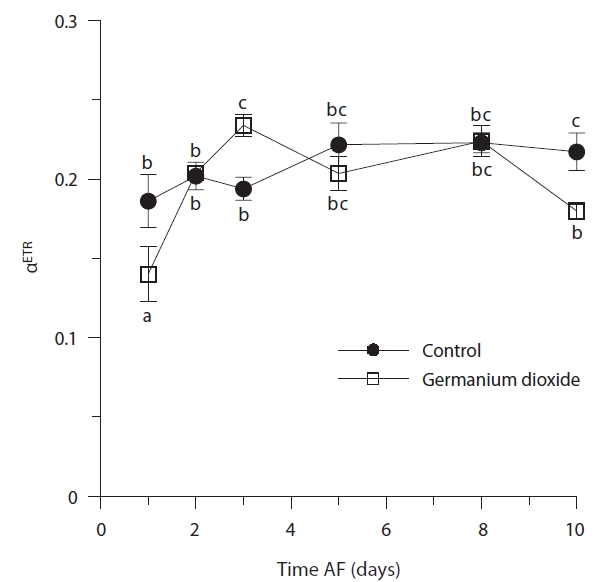
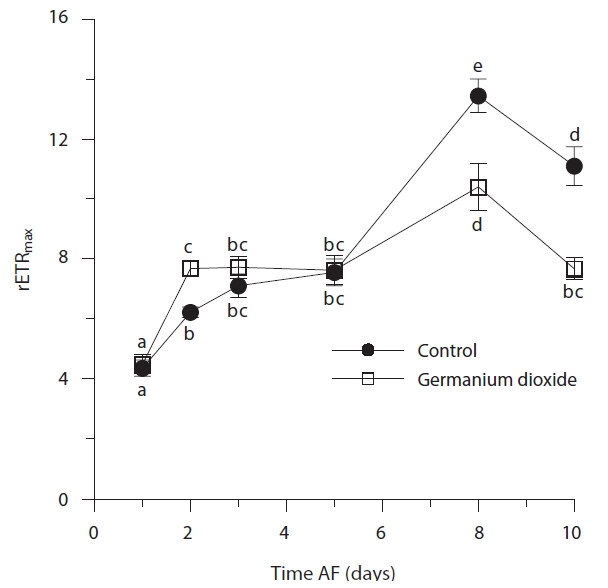
Time, treatment and the time × treatment interaction were all significant for rETRmax (Table 2, Fig. 4). The maximum value of rETRmax was about 13.5 in 8 days control embryos. Higher values for rETRmax were evident at the end of the experiment when controls were over 30% higher than Ge-treated embryos. Photosynthetic efficiency (αETR) in both control and experimental embryos remained relatively stable during the whole experiment, fluctuating slightly between 0.18-0.22 (Fig. 5). While time and treatment × time interaction were significant factors, there was no overall difference between Ge and control embryos (Table 2).
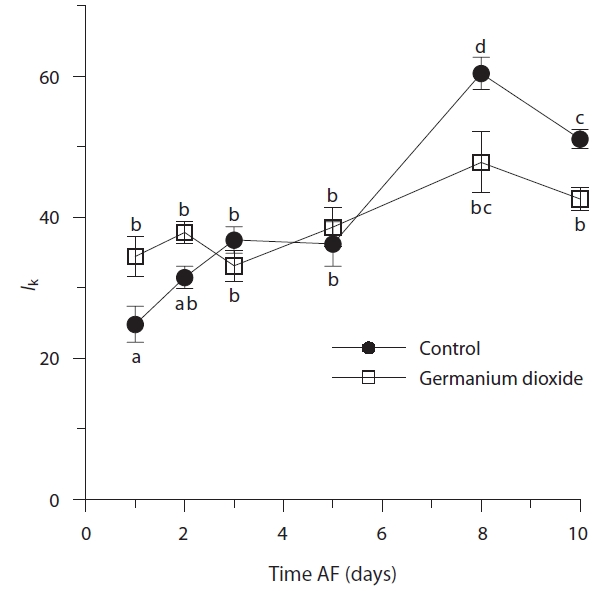
After 24 h, control and Ge-treated embryos had different optimal light intensities (
The rhizoid cells of control and Ge-treated two-celled embryos were significantly differed in minimum fluorescence:

Comparison of photosynthetic parameters in rhizoid cells of control and GeO2 treated 2-celled embryos of Fucus vesiculosus
Many aspects of germanium toxicity were manifest as abnormalities of
Yang (1993) observed morphological changes in Ge-treated cells of brown algae. He showed that Ge altered cell wall structure in fucoid embryos, particularly in the rhizoid region; this is consistent with our data. The wall looseness and disorganized arrangement of fibrils in the rhizoid tips might be a direct effect of Ge on the cell wall (Yang 1993), but these symptoms also point to cytoskeletal malfunction. In fucoid algae the cell wall organization and function is regulated by F-actin (Bisgrove and Kropf 2001
Another hypothesis for how GeO2 affects cell walls of brown algae is the substitution for other elements with similar chemical properties to Ge. In diatoms, Ge toxicity can be reduced by the addition of Si to the growth medium (Lewin 1966), although McLachlan et al. (1971) pointed out that this was not the case with fucoids. In our case, Ge was also not less toxic even when Si (as SiO2) was added to the medium in double the concentration of added Ge (data not shown). Although this does not rule out the possibility that Si-dependent processes have no role in Ge toxicity, inhibitory effects of GeO2 may not always be based on Si substitution.
A possible mechanism for Ge toxicity comes from higher plants where Ge leads to increased root branching and leaf necrosis (Skok 1957, McIlrath and Skok 1966). Ge may partially substitute for boron (B), where it affects cell permeability, structural integrity of cell membranes and cell wall formation (McIlrath and Skok 1966, Cakmak et al. 1995). Boron resembles Si in physical and chemical properties, although unlike Si, which is not essential for most plants, B is almost universally required. Boron is normally absorbed by plants as undissociated boric acid, and it accumulates in both the cytoplasm and cell walls (Dembitsky et al. 2002, Bassil et al. 2004). Free and complex forms of accumulated borate occur in different seaweeds, including green, red and brown algae. Unlike other algae, brown algae contain considerable B in diverse B-containing compounds, including complexes with mannitol, laminarin, and alginic acid (Chuda et al. 1997, Dembitsky et al. 2002). If Ge can also substitute for B in brown algae, that might explain their increased sensitivity to GeO2 compared with green or red algae (Tatewaki and Mizuno 1979). Both B and Ge can form complex compounds with other membrane and cell wall components such as phenols (Cakmak et al. 1995), and brown algae have high contents of phenolic compounds (Schoenwaelder 2002, 2008). Phenolics play a critical role in early development of fucoids participating in cell wall formation, zygote adhesion to the substratum and polar axis formation (Schoenwaelder and Wiencke 2000, Bisgrove and Kropf 2001
Our observations on the development of the photosynthetic apparatus in fucoid embryos are consistent with the previous investigations of this process carried out with similar (Lamote et al. 2003, Kim et al. 2006, Kim and Garbary 2009) or other methods (McLachlan and Bidwell 1978, Major and Davison 1998, Tarakhovskaya and Maslov 2005). Kim et al. (2006) had similar results with another fucoid,
There were no conspicuous changes in
While maximum quantum yield and rETRmax significantly increased in Ge-treated embryos during the first 5 days AF, at the same time, total growth was reduced and highly abnormal. This seems counterintuitive; however, Lewin (1966) showed that GeO2, though extremely deleterious for diatoms, had no negative influence on energy metabolism of the cells, and even at 400 mg L-1 GeO2, cell respiration did not decrease. Shea and Chopin (2007) also reported that low concentrations of GeO2 (up to 0.5 mg L-1) might sometimes have a slightly positive effect on growth of brown algae. After 5 days,
The developmental abnormalities of