검색 전체 메뉴
PDF
맨 위로
OA 학술지
Constraining the Mass Loss Geometry of Beta Lyrae
  • 비영리 CC BY-NC
  • 비영리 CC BY-NC
ABSTRACT
Constraining the Mass Loss Geometry of Beta Lyrae
KEYWORD
binaries , jet-driven mass loss , accretion disk , beta Lyrae , mass transfer , hot spot
  • 1. INTRODUCTION

    Beta Lyrae is an eclipsing, semi-detached, binary star system. The primary star is a B6-8 II giant that is losing material through Roche lobe overflow. The secondary, B0.5 V main sequence star is surrounded by an opaque ac-cretion disk created by the mass transfer process (Hubeny& Plavec 1991). Bipolar outflows have also been detected in the system (Harmanec et al. 1996, Hoffman et al. 1998). A ‘hot spot,’ due to the mass stream impacting the edge of the disk, has been theorized to exist but light curves of the system have not revealed its existence.

    Recent work by Ak et al. (2007) and Zhao et al. (2008) support our current understanding of the beta Lyrae sys-tem.Interferometric images of the system clearly show the disk and primary star as separate objects (Zhao et al.2008), and the results of an analysis of a larger number of spectra are consistent with the presence of a disk and bipolar outflows (Ak et al. 2007).

    Since the system’s two stars are hot, gas in the outflows and disk is at least partially ionized. Therefore, the sys-tem’s observed polarization is due to electron scattering. This process retains geometric information about the scattering region. Consequently, polarimetry can be used to probe the geometric structure of the disk and outflows to determine whether the theorized hot spot exists, since it would create a disruption in the otherwise smooth structure of the disk edge. Polarimetry can also help con-strain the location of the source of the bipolar outflows.

    2. OBSERVATIONS

    Three spectropolarimetric data sets were used in this study. The first data set was originally published in Ap-penzeller& Hiltner (1967) and taken between 1964 and 1966. The second set of observations was taken with the Flower and Cook Observatory (FCO)’s photoelastic modulating polarimeter instrument between 1987 and 1992. The last consists of 6 years of new and recalibrat-ed observations taken with the University of Wisconsin’s Half-Wave Spectropolarimeter (HPOL) between 1992 and 1998, a portion of which was originally published in Hoff-man et al. (1998).

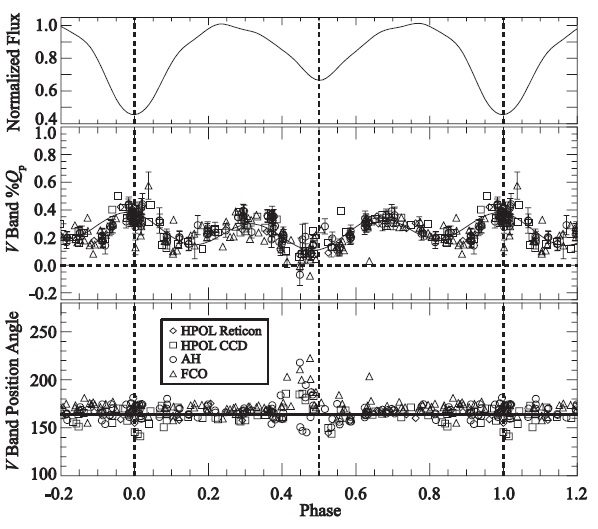
    Each data set has been corrected for interstellar polar-ization effects and rotated to the average position angle of 164o. This places the majority of the polarimetric varia-tions in the new projected %q direction, while the %u po-larization averages to zero. Only the projected %q data are presented here.

    The phase for each observation was calculated using the ephemeris

    TPRI = JD2408247.966 + 12.91378E + 3.87196 x 10⁻⁶E2

    where E is the total number of orbits since the primary eclipse that occurred at JD 2408247.966 (Harmanec & Scholz 1993).

    3. V BAND RESULTS

    The %q plot (Fig. 1) shows three main morphologi-cal features. First, there is a maximum in polarization at primary eclipse when the primary star, a major source of unpolarized light, is being eclipsed by the disk. This re-duction in the total unpolarized light causes the percent-age of observed polarized light to increase. The second feature is local maxima at the quadrature phases due to light scattering off the disk edge. The third feature is a

    secondary eclipse in polarized light that occurs before the secondary eclipse in total light (phase 0.483 compared to phase 0.5). It has a corresponding position angle rotation away from 164?. A position angle of 164? is consistent with the system’s axis on the sky and indicates the V band light is being polarized in the system’s disk while the rotation away from 164? implies something is different about the scattering process at phase 0.483. Therefore, we have in-terpreted this feature as evidence of a hot spot on disk edge.

    At phase 0.483, the primary star has already begun its eclipse of the disk and the mass stream should lead the loser as it moves across the edge of the disk (Lubow & Shu 1975). The polarized secondary eclipse should thus oc-cur when the area disrupted by the hot spot and eclipsed by the primary star is maximized. Simple estimates for the size of the hot spot can be made using this new in-formation. Assuming the orbits are circular and the hot spot’s height is the same as that of the disk edge, a simple geometric analysis of the polarized light curve gives an estimated maximum hot spot width of approximately 30 solar radii (roughly equal to the disk radius). A simi-lar analysis of the position angle rotation yields a larger estimate. A third estimate utilizes a simple model of the polarized flux of the system. Assuming the polarization of the disk is uniform across the disk edge, this model pro-duces an estimate similar to the geometric analysis of the polarized light curve (about 30 solar radii). Full modeling of the polarized light curves will also help to better con-strain the hot spot size.

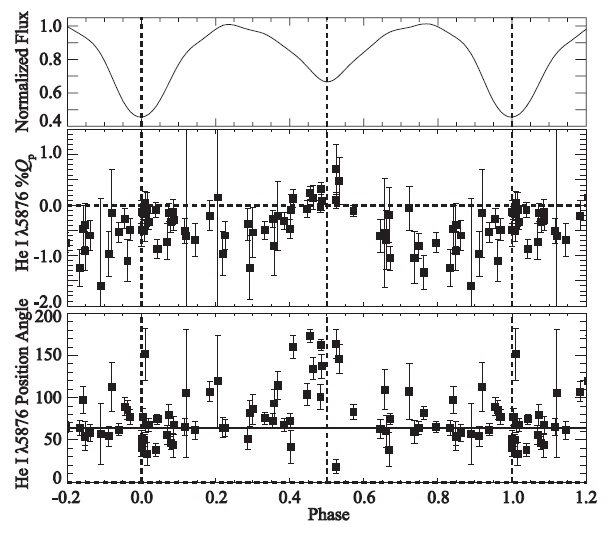
    4. HE I (5,876 A) LINE RESULTS

    The He I (5,876 A) line is polarized at a position angle (64?) perpendicular to the V band polarization and has both a primary and secondary eclipse (Fig. 2) in the pro-jected %q. This suggests that the primary scattering re-gion is associated with the bipolar jets and is located close to the plane of the system. The eclipses are also centered on phases 0.0 and 0.5. This is possible if the bipolar out-flows do not originate from the hotspot, but rather from a location within the disk near the mass-gaining star. However, future observations with better signal-to-noise and improved phase coverage will allow for stronger con-straints on the source of the bipolar outflows.

    5. FUTURE WORK

    Full results of this study, including BVRI band polari-metric analysis, will be presented in an upcoming paper (Lomax et al. 2011).

    Long-term periodic behavior has been detected in the beta Lyrae system (Harmanec et al. 1996). However, due to the uneven time coverage of our combined data set, advanced period-finding techniques are required to find such periodicity in the polarization results.

참고문헌
  • 1. Ak H, Chadima P, Harmanec P, Demicran O, Yang S 2007 New findings supporting the presence of a thick disc and bipolar jets in the β Lyrae system. [A&A] Vol.463 P.233-241 google cross ref
  • 2. Appenzeller I, Hiltner WA 1967 True polarization curves for beta Lyrae. [AJ] Vol.149 P.353-362 google cross ref
  • 3. Harmanec P, Morand F, Bonneau D, Jiang Y, Yang S 1996 Jet-like structures in β Lyrae. Results of optical interferom-etry spectroscopy and photometry. [A&A] Vol.312 P.879-896 google
  • 4. Harmanec P, Scholz G 1993 Orbital elements of beta Lyrae after the first 100 years of investigation. [A&A] Vol.279 P.131-147 google
  • 5. Hoffman JL, Nordsieck KH, Fox GK 1998 Spectropolarimetric evi-dence for a bipolar flow in beta Lyrae. [AJ] Vol.115 P.1576-1591 google cross ref
  • 6. Hubeny I, Plavec MJ 1991 Can a disk model explain beta Lyrae? [AJ] Vol.102 P.1156-1170 google cross ref
  • 7. Lomax JR, Hoffman JL, Elias NM, Bastien FA, Holenstein BD 2011 Geometrical constraints on the hot spot and bipo-lar outflows in beta Lyrae ApJ submitted. google
  • 8. Lubow SH, Shu FH 1975 Gas dynamics of semidetached bina-ries. [AJ] Vol.198 P.383-405 google cross ref
  • 9. Zhao M, Gies D, Monnier JD, Thureau N, Pedretti E 2008 First resolved images of the eclipsing and interacting bi-nary β Lyrae. [ApJ] Vol.684 P.L95-L98 google cross ref
OAK XML 통계
이미지 / 테이블
  • [ Fig. 1. ]  V band polarization of beta Lyrae. From top: normalized Fourier fit V band light curve (Harmanec et al. 1996), projected %q curve, and position angle (degrees) versus phase. The solid curve in the middle panel represents a Fourier fit to the data. The solid line in the bottom panel represents the average position angle of 164?.
    V band polarization of beta Lyrae. From top: normalized Fourier fit V band light curve (Harmanec et al. 1996), projected %q curve, and position angle (degrees) versus phase. The solid curve in the middle panel represents a Fourier fit to the data. The solid line in the bottom panel represents the average position angle of 164?.
  • [ Fig. 2. ]  He I (5,876 A) line polarization of beta Lyrae. From top: normalized Fourier fit V band light curve (Harmanec et al. 1996), projected %q curve, and position angle (degrees) versus phase. Only HPOL charge-coupled device data are represented here. The solid line in the bottom panel represents the average position angle of 64?.
    He I (5,876 A) line polarization of beta Lyrae. From top: normalized Fourier fit V band light curve (Harmanec et al. 1996), projected %q curve, and position angle (degrees) versus phase. Only HPOL charge-coupled device data are represented here. The solid line in the bottom panel represents the average position angle of 64?.
(우)06579 서울시 서초구 반포대로 201(반포동)
Tel. 02-537-6389 | Fax. 02-590-0571 | 문의 : oak2014@korea.kr
Copyright(c) National Library of Korea. All rights reserved.