Among the most active OB stars are those in high-mass X-ray binary (HMXB) systems, in which interaction of the massive-star wind with a close compact companion?ei-ther a neutron star or black hole?produces hard ( > 10 keV) X-ray emission with characteristic, regular modula-tion over the orbital period. In recent years a small subset of such HMXB’s have been found also to be γ-ray sources, with energies up to ~10 GeV observed by orbiting γ-ray observatories like Fermi, and very-high-energies (VHE) of over a TeV (1012 eV) seen by ground-based Cerenkov telescopes like High Energy Stereoscopic System (HESS), Very Energetic Radiation Imaging Telescope Array System (VERITAS), and Magic. For the one case, known as B 1259-63, in which observed radio pulses show the companion to be a pulsar, the γ-ray emission seems best explained by a pulsar wind shock (PWS) model, wherein the interac-tion of the relativistic pulsar wind with the dense wind of the massive-star produces strong shocks that accelerate electrons to VHE, with inverse-Compton scattering of the stellar light by these high-energy electrons then produc-ing VHE γ-rays. For the other γ-ray binaries, pulses have not been detected, and the nature of the companion, and the applicability of the PWS model, are less clear.
An alternative MicroQuasar (MQ) model instead pos-its that accretion of circumstellar and/or wind material from the massive star onto the companion?assumed now to be either a black hole or a weakly magnetized neutron star?powers a jet of either relativistic protons, which in-teract with stellar wind protons to produce pions that quickly decay into γ-rays, or relativistic pair plasma, which inverse Compton scatters stellar photons to γ-rays. Okazaki et al. (2011) used smoothed particle hydrody-namics (SPH) simulations to examine both the PWS and MQ models, applying them respectively for two systems,
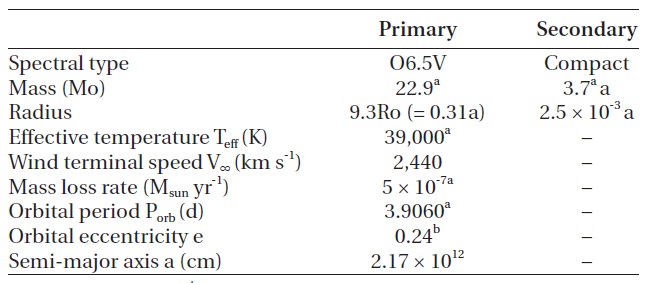
[Table 1.] Model parameters for LS 5039.

Model parameters for LS 5039.
B 1259-63 and LSI +61 303, in which the massive star is a Be star. In such Be binary systems, the compact com-panion can interact with the Be star’s low-density polar wind, and with the dense equatorial disk that arises from orbital ejection, or decretion, from the rapidly rotating star; modeling both types of interaction is key to under-standing their high-energy emission.
In the paper here, we apply the same SPH code to a MQ model for the TeV-binary LS 5039, for which the (non-pulsing) compact companion is in a moderately eccentric (e ~0.24), 3.9-day orbit around a massive, non-Be prima-ry star of spectral type O6.5V (see Table 1 for full param-eters). This builds on our previous study (Okazaki et al. 2008b) to account now for wind acceleration, instead of just assuming a constant wind speed. A key result is that the orbital variation of the three dimensional (3-D) SPH accretion rate of the stellar wind flow onto the compact companion follows very closely the analytic Bondi-Hoyle-Lyttleton (BHL) rate that depends on the wind speed and orbital separation at each phase (see right panel of Fig. 1). Assuming the mass accretion translates promptly into jet power and thus γ-ray emission, we then apply this re-sult to derive predicted light curves at both the GeV ener-gies observed by Fermi and the TeV energies observed by HESS. For the former, we find that assuming GeV γ-ray emission tracks closely the BHL accretion rate gives di-rectly a quite good fit to the Fermi lightcurve (Abdo et al. 2009, see left panel of Fig. 2 below). But for the latter case one must also account for the attenuation of emitted TeV γ-rays by photon-photon interaction with the optical and UV radiation of the massive star. When this is included, then the predicted TeV lightcurve also closely matches the HESS observations (Aharonian et al. 2006, see right panel of Fig. 2 below).
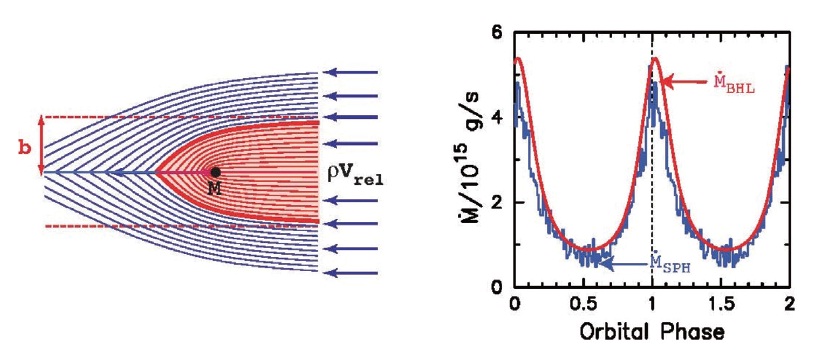
To provide a physical context for modeling accretion in LS 5039, it is helpful first to review briefly the basic scaling for accretion of an incoming flow onto a gravitating body, as analyzed in pioneering studies by BHL (see Edgar 2004, for references and a modern review). The left panel of Fig. 1 illustrates the basic model. An initially laminar flow with density ρ and relative speed Vrel is focused by the gravity of a mass M onto the downstream side of the flow sym-metry axis, whereupon the velocity component normal to the axis is cancelled by collisions among the streams from different azimuths. Material with initial impact pa-rameter equal to a critical value b ≡ 2 GM/V2 ?now typi-cally dubbed the BHL radius, and highlighted by the (red) heavy curve in Fig. 1?arrives on the axis a distance b from the mass, with a parallel flow energy V2/2 just equal to the gravitational binding energy GM/b. Since all material with an impact < b (i.e. within the shaded area) should thus have negative total axial energy, it should be even-tually accreted onto the central object. This leads to a simple BHL formula for the expected mass accretion rate,
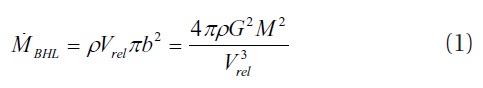
to be accreted onto

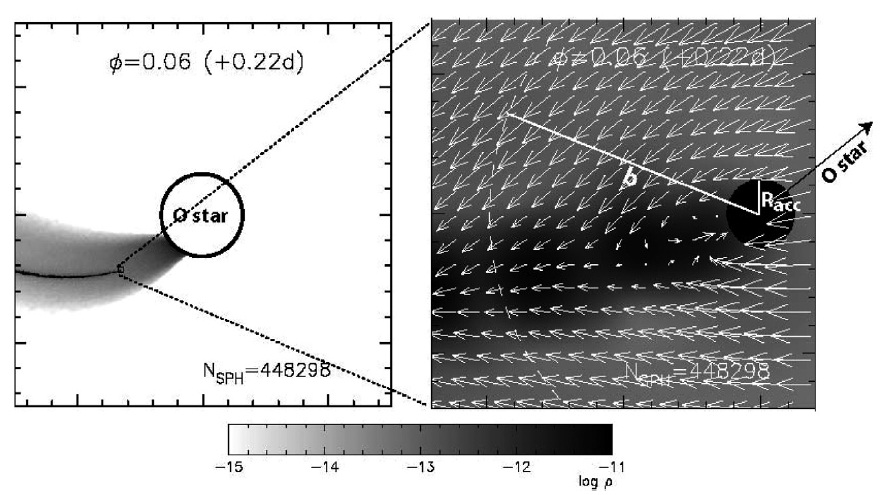
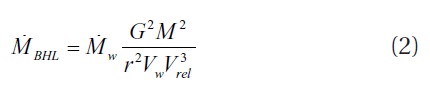
, as outlined here by the bold (red) curve that bounds the lightly shaded region representing accreting material. Right: orbital phase variation of the mass-accretion rate from 3-D SPH simulations (blue), compared to the analytic BHL formula from Eq. (2) (red) assuming the parameters given in Table 1.
In a binary system like LS 5039 there arise additional effects from orbital motion and the associated coriolis terms. But if we ignore these and other complexities, we can use Eq. (1) to estimate how the accretion rate should change as a result of the changes in binary separation r over the system’s elliptical orbit,
where
w ≡ 4
For the LS 5039 system parameters given in Table 1, the smooth (red) curve in the right panel of Fig. 1 plots the orbital phase variation of this analytically predicted BHL-wind-accretion rate. A principal result of this paper is that this is in remarkably close agreement with the jagged (blue) curve, representing the corresponding accretion rate from full, 3-D SPH simulations, the details of which we discuss next.
The SPH code used here is based on a version originally developed by Benz et al. (1990) and Bate et al. (1995), with recent extensions to model interacting binaries by Oka-zaki et al. (2008a). It uses a variable smoothing length and integrates the SPH equations with the standard cubic-spline kernel using individual time steps for each particle. The artificial viscosity parameters are set to standard val-ues of αSPH = 1 and βSPH = 2. In the implementation here, the O-star wind is modeled by an ensemble of isothermal gas particles of negligible mass, while the compact object is represented by a sink particle of mass
For the system parameters listed in Table 1, Fig. 3 il-lustrates the nature of the accretion in these SPH simu-lations, using a time snapshot near periastron, with phase φ = 0.06. The left panel shows the overall, orbitally deflected wind stream that flows radially away from the O-star toward the companion, along with the narrow, dense, gravitationally focused wind-stream in its wake. The right panel zooms in on this wake on a scale within a BHL accretion radius of the companion, as denoted by the dashed white circle arc. The white arrows show that, within the portions of this dense focal stream wake near-est the companion, the flow becomes directed toward the black sphere with assumed accretion radius Racc.
Averaged over some detailed variations, the overall process of accretion in this fully 3-D SPH simulation is thus remarkably similar to the simple laminar flow pic-ture illustrated in the left panel of Fig. 1. The right panel of Fig. 1 shows moreover that the SPH accretion rate?av-eraged over a phase interval 0.01 to smooth over rapid fluctuations?also agrees remarkably well with the simple BHL rate given by Eq. (2).
4. ACCRETION-POWERED GAMMA-RAY EMISSION
In a microquasar model, the accretion onto the com-pact companion powers a jet of high-energy protons.
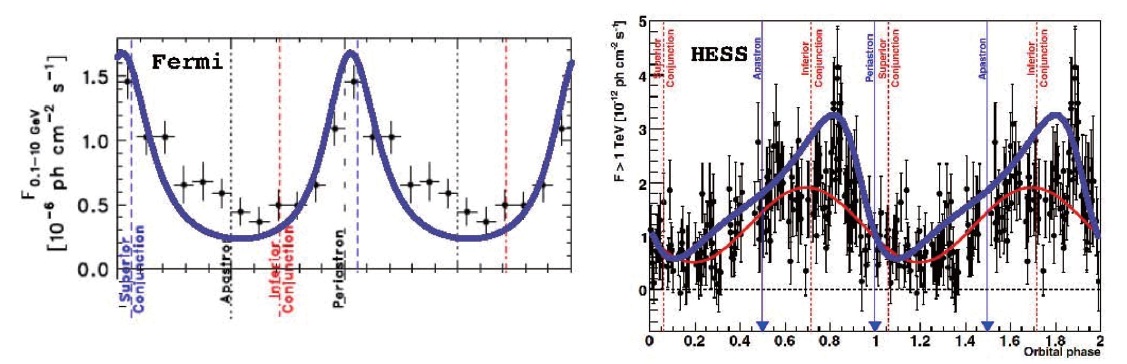
Since the jet acceleration occurs on a scale of a few tens of compact companion radii, it seems reasonable to pos-tulate that jet-wind interaction and the resulting γ-ray emission could promptly track the accretion rate. The left panel of Fig. 2 compares the Fermi lightcurve for LS 5039 at energies 0.1-10 GeV with a simple emission model that scales directly with the BHL accretion rate. The model fits the data quite well, reproducing both the roughly factor five variation range of observed γ-rays, as well as the ob-served flux peak at a phase very near periastron.1
By contrast, the right panel of Fig. 2 shows that the TeV γ-rays observed from LS 5039 by HESS peak well before periastron, toward the phase associated with inferior conjunction, with the flux minimum occurring just after periastron, near the phase for superior conjunction. These phase shifts in the peak and minimum can be ex-plained by accounting for the attenuation of the γ-ray rays through photon-photon interaction with the radiation from the O-star. For TeV γ-rays, the geometric mean of the energies of the γ-rays and stellar UV/optical photons exceeds twice the rest-mass-energy of electrons, thus al-lowing photon-photon production of electron/positron pairs. The thick (blue) curve in Fig. 2 shows that a simple model combining a BHL-rate emission with such photon-photon attenuation does indeed match the HESS data very well. In contrast, for GeV energy γ-rays the geometric mean with stellar UV/optical light generally falls below the electron mass-energy, and so the Fermi lightcurve is unaffected by such attenuation.
Since the cross section for photon-photon is highest near the thresh-hold of about ~1 TeV, a pure attenuation model predicts that spectrum should be hardest during the superior conjunction phase of minimum flux and maximum attenuation. However, plots of the photon in-dex for TeV observations by HESS show just the opposite, with the minimum flux corresponding to the softest spec-trum. We are currently investigating whether this can be explained by accounting for the progressive softening of γ-rays during a cascade of absorption and reemission as-sociated with pair production and annihilation.
1If instead of an eccentricity e = 0.24, we use the larger value e = 0.35 suggested by Casares et al. (2005), the amplitude of orbital variation in mass accretion rate then becomes stronger than this factor five γ-ray variation observed by Fermi.

![LS 5039 light curves at energies 0.1-10 GeV observed by Fermi (Abdo et al. 2009, left), and at energies above 1 TeV observed by HESS (Aharonian et al. 2006, right), plotted vs. orbital phase, and compared against the model results based on Bondi-Hoyle-Lyttleton accretion, shown as heavy solid (blue) curves (The light [red] curve represents the best-fit sinusoid for the HESS data).](http://oak.go.kr/repository/journal/11214/OJOOBS_2012_v29n1_51_f002.jpg)