The Navy Optical Interferometer (NOI), formerly the Navy Prototype Optical Interferometer (NPOI), is a joint project of the Naval Research Laboratory (NRL), and the United States Naval Observatory (USNO) in coopera-tion with Lowell Observatory, located at Anderson Mesa near Flagstaff, Arizona. For further instrument details see Armstrong et al. (1998) and for details regarding NOI’s ob-servations and data reductions see Hummel et al. (2003),and the references therein.
Optical interferometry offers a method of directly de-termining stellar diameters, the morphology of Hα emis-sion regions, and astrometric orbital parameters that gov-ern the interactions of binary systems. The fundamental observed quantity for the NOI is the squared visibility (V2, Armstrong et al. 1998), which is the Fourier transform of the source brightness distribution (see Thompson et al. 2001 for an introduction to interferometry). After detect-ing interference fringes from a binary star an orbit may be fit (Pan et al. 1993). With the orbit, the visibility data from all observations can be used to fit for the magnitude dif-ferences of the binary system in question (Hummel et al.2003). Results of this technique as applied to the binary stars Phi Herculis, Beta Lyrae and Algol are reviewed in this work.
2. RESOLUTION OF SINGLE-LINED SPECTRO-SCOPIC BINARIES: Φ HERCULIS
Φ Herculis (HD 145389, HR 6023) is a mercury-man-ganese (HgMn) star, showing a wide variety of spectral abundance anomalies with both depletions and enhance-ments (Adelman et al. 2004). Aikman (1976) identified Φ Her as a single-lined spectroscopic binary. The secondary component avoided detection until NOI observations be-came available beginning in 1998. These interferometric observations lead to the identification of the spectral type of the secondary. Identification of the secondary’s spec-tral type enables a better understanding of the chemical abundances of the primary.
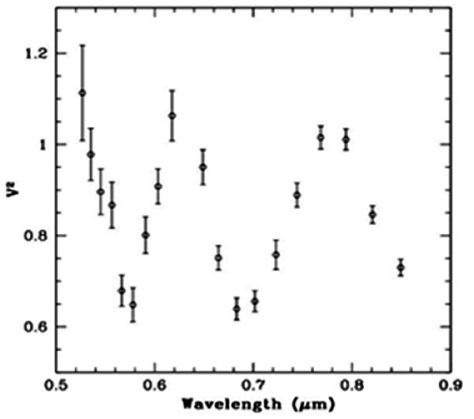
In Fig. 1 the calibrated V2 data shows the cosine wave signature of a binary source (Michelson 1920) as seen with an interferometer. As described in Pan et al. (1993) and Hummel et al. (2003), a fit for the binary parameters was applied and a measure of the magnitude difference of the secondary relative to the primary was found. With the assumption that both stars are on the main sequence and with the determination of the magnitude differences, 2.57 in the V band and 2.39 in the R band, a prediction of the secondary’s spectral type as A8 V was found. This spectral type was verified spectroscopically with follow up observations utilizing Dominion Astrophysical Ob-servatory (DAO) spectra (Zavala et al. 2007). An indepen-dent confirmation of the secondary spectral type was also made by Dworetsky & Willatt (2006).
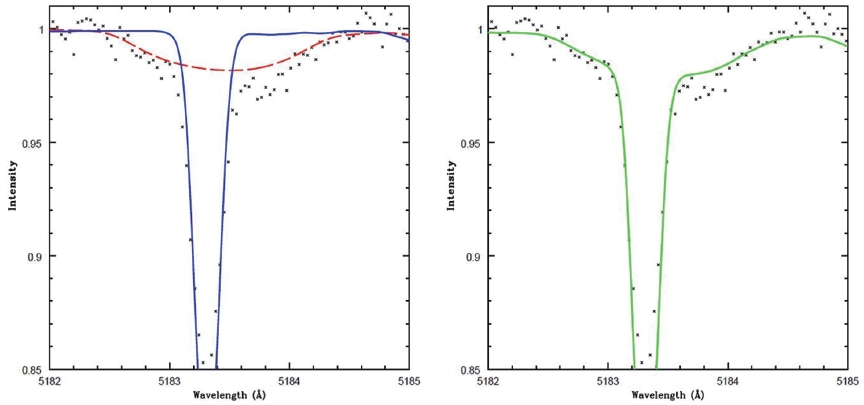
Fig. 2 illustrates how the synthetic spectra of the com-ponents, constrained by the brightness ratio from the NOI, accurately represent the observed spectra. In the right panel of Fig. 2 the DAO spectra are shown with an overlay of the summed synthetic spectra for both Φ Her A and B. In the left panel of Fig. 2 the DAO observed spectra is overlaid on individual normalized synthetic spectra for Φ Her A and B.
3. HΑ EMISSION IMAGING AND ORBIT DETER-MINATION: Β LYRAE
β Lyrae is an interacting eclipsing binary system con-sisting of a ~3 solar mass B6-8II star which has filled its Roche lobe and a ~13 solar mass early B star, which is completely obscured and hidden within a thick accretion disk (Harmanec 2002). In 2002 the NOI observed β Lyrae as part of an experiment to detect the binarity of this sys-tem and the Hα emission associated with the accretion stream. NOI data from this experiment is presented along with images indicating the position of the Hα emitting regions relative to the continuum photo-center as a func-tion of orbital phase, providing a means for analyzing the Hα morphology (Schmitt et al. 2009).
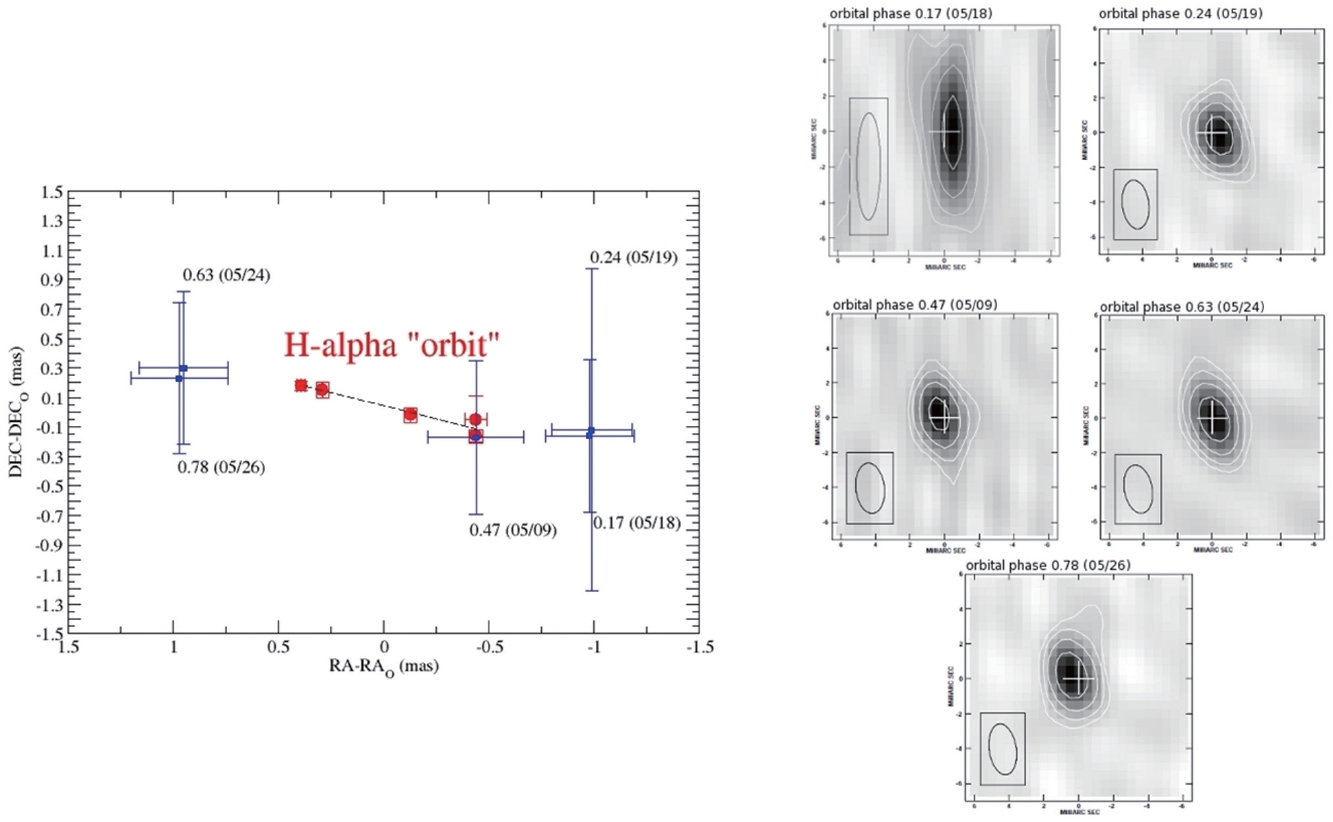
In Fig. 3 (left panel) the position of the Hα emission is plotted relative to the continuum photo-center for the five nights of data. The orbit of the Hα emission is also plotted by fitting a line to the data points with an orbital solution found to be oriented along a position angle of 248.8 ± 1.7?. Using parameters derived by Harmanec et al. (1996), Linnell (2000), and Harmanec (2002), the or-bits of the Hα and continuum photo-centers were fit and converted to positions in the sky using the inclination de-
rived by Linnell et al. (1998). One important observation-al result is the Hα semi-major axis was observed to be less than the continuum semi-major axis, providing evidence that the NOI was effectively imaging the orbit of this sys-tem. This is due to the Hα emission originating within the disk of the more massive star, and the continuum photo-center being located nearer the less massive star (Schmitt et al. 2009). These Hα images each correspond to a differ-ent night and are organized in order of increasing orbital phase and are also shown with the correct orbital orienta-tion.
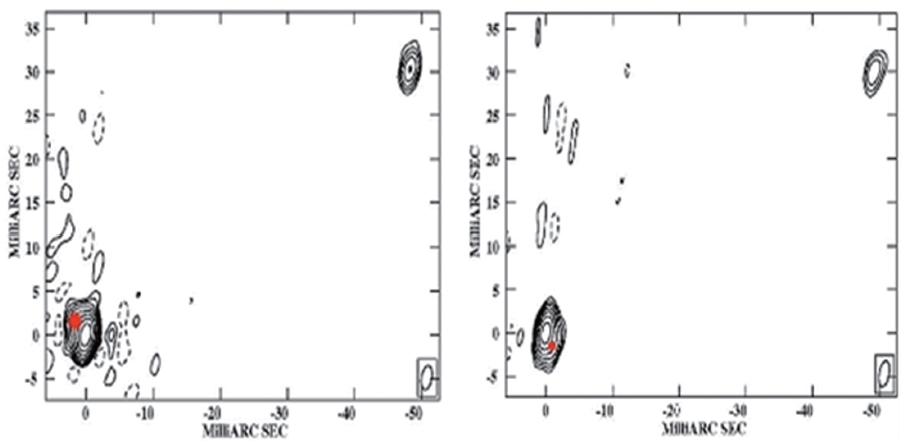
4. DIRECT DETERMINATION OF ORBITAL PA-RAMETERS: ALGOL
Algol is the prototype for a well-known class of eclips-ing binaries. The Algol system is a hierarchical triple sys-tem (close binary Algol A-B and triple Algol AB-C) and is well summarized by Soderhjelm (1980). Speckle (Labeyrie et al. 1974) and optical (Pan et al. 1993) interferometry re-solved the orbit of the AB-C component, but the ascend-ing node of these orbits differed by 180° from that used in the High Precision PARallaxCOllectingSatellite (HIPPAR-COS) double star solution (Lindegren et al. 1997). As Algol is 1 of 12 radio stars used to link the HIPPARCOS optical reference frame to the International Celestial Reference System (ICRS, Kovalevsky et al. 1997), a resolution of this 180° ambiguity was needed to reconcile the time-variable systematic offset of the photo-center between the HIP-PARCOS orbital orientation and the interferometric ori-entation.
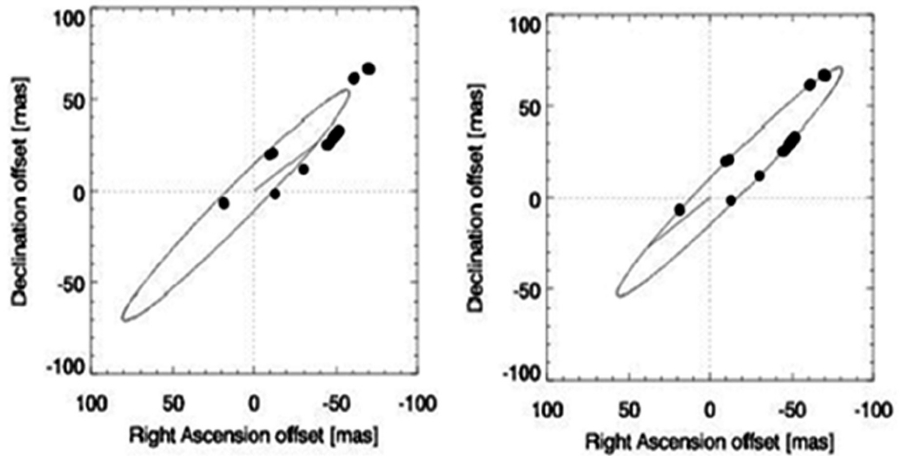
Interferometric observations using the NOI have re-sulted in the first resolved images of the triple system, as seen in Figs. 4 and 5. These observations have led to an unambiguous determination that the close pair orbit (A-B) is retrograde and nearly orthogonal to the plane of the wide (AB-C) orbit (Zavala et al. 2010). The improve-ments made to the AB-C orbital plane orientation have removed the time-variable systematic offset expected
between the orbit used in the HIPPARCOS solution and the results of Pan et al. (1993) and Csizmadia et al. (2009). NOI observations have also led to the first directly mea-sured magnitude differences for the three stars in Algol. Estimates made in previous studies were performed by modeling photometric light curve and spectroscopic data and spanned more than one magnitude, from 3.92 ± 0.88 (Richards et al. 1988) to 2.71 ± 0.15 (Kim 1989). The NOI directly measured V band magnitude difference favored a magnitude less than 3 (Zavala et al. 2010).
NOI magnitude differences help to constrain results obtained by modeling photometric light curves and spec-troscopic data by adding directly measured Δ-magnitude results. Due to the NOIs capability of directly measur-ing position angles and magnitude differences in close binaries, further observations of double and triple star systems will also benefit from the directly measured fun-damental parameters that govern these dynamic stellar systems.