As the study on the Sun-Earth system has become active, the variability of the Sun at various time scales is attracting more attentions (Pulkkinen et al. 1999, Chang 2007, Petrovay 2010, Ternullo 2010, Kim & Chang 2011). Around a maximum of sunspot number, coronal mass ejections and powerful explosions on the solar surface, flares, occur more frequently. The enormous energy generated by those phenomena causes significant troubles in telecommunication, power supply, satellite operation, etc., by disturbing the Earth’s magnetic field. Monitoring the solar activity by continuous observations of sunspots is basic and most important to predict a change in the space environment.
The sunspot number has long been the only index representing the solar cycle and has been used in a number of studies on the solar cycle (Usoskin 2008). For example, in the field of solar physics, the sunspot number is used for prediction of the solar cycle, studying constraints on the solar dynamo model, reconstruction of the solar irradiance, etc. For the Sun-Earth system, the sunspot number is a basis for input data of the Sun in the study of long-term change of the Earth climate, and plays a role of proxy for the geomagnetic storm which influences the magnetosphere and ionosphere of the Earth (Lockwood 2003, Solanki et al. 2004, Wang 2004).
Basically, the sunspot number is recorded based on the equation suggested by Wolf at the Zurich Observatory in 1849 (Letfus 2000, Vaquero 2007). An observed sunspot number is defined by multiplying the number of observed sunspot groups,
Sunspot number data called the international relative Sunspot number (IRSN) had been obtained and published by the Zurich Observatory and are now published by the Sunspot Index Data Center. Since January 1981 when the Zurich Observatory decided not to continue their observations for the sunspot number, the Royal Observatory of Belgium has been operating the Sunspot Index Data Center which is also known as the World Data Center for the Sunspot Index. To keep the consistency and continuity with the data from the Zurich Observatory, they use the Locarno Observatory as the reference station which is one of the major branches of the Zurich Observatory. In 2000, reorganized and expanded by gaining the qualification of Regional Warning Center of the International Space Environment Service, the Sunspot Index Data Center had become the Solar Influences Data analysis Center (SIDC; Berghmans et al. 2005). Receiving data monthly from the observing stations throughout the world, the SIDC calculates IRSN,
Major changes in the data production of sunspot number, appeared after their moving to the SIDC system in 1981, are as follows. First, the manual process was replaced by an automatic process using computers. It was an effort to make the process more objective which, otherwise, could be somewhat subjective. Second, in addition to the introduction of the computerized process, they are also collecting as many data sets as possible from the observing stations all over the world for objective measurements of the sunspot number. In the past, only the data from a single major station were used and the other stations provided supplementary data which were used in the case that the major data were not available. But now, a statistical reliability has been ensured by using the average of data from a number of observing stations. In the averaging process, since observations are not free from experiences or interpretations of observers, performances of telescopes, observing methods, or atmospheric conditions including weather, the data from each observatory are corrected by a correction factor K to compensate those biases. Typical value of this factor is between 0.4 and 1.7, and each observatory is supposed to show self-consistent values. For example, the correction factor of the Locarno Observatory as the reference station is 0.6 to the old value of Wolf (Vanlommel et al. 2004). This means that the sunspot numbers recorded by Wolf are systematically 0.6 times smaller than those observed and recorded at the Locarno Observatory. It is essential for an observatory to keep their correction factor constant in order to secure a high quality of data. Considering the correction factors, it seems that the current sunspot numbers recorded by the SIDC have no systematic error compared to the Zurich numbers (Vanlommel et al. 2004, Berghmans et al. 2006, Clette et al. 2007). Third, they are expanding their efforts of collecting more data sets to as many regions throughout the world as possible, out from the supplementary stations mostly located in Europe and some parts in Asia. In 2003, 86 observatories in 29 countries were providing data, among which about 57% are located in the continent of Europe and 10 observatories are in Asia (Clette et al. 2007). Locations of the sunspot observatories are becoming more diverse although they are not completely free from the tradition yet. In addition to this, there is one important aspect to be mentioned. In the whole input data set, only 34% is from professional observatories and the remaining 66% is produced by amateur observers (Clette et al. 2007). While an observer has a duty of observing more than 10 times per month, regularly and constantly, and has to follow the rule of quantifying a personal K factor, it should be noted that this area is where amateur observers can make a contribution.
In South Korea, sunspot observations have been performed at the head quarter of the Korea Astronomy and Space Science Institute (KASI) in Daejeon since 1987 using the 20 cm refracting telescope which was once installed at the Sobaeksan Observatory (Sim et al. 1990, Sim & Park 1992, Sim 1997, Kim et al. 2003). Running the observations mostly before noon in the days with cloud amount less than 4/10, they record the results using the traditional method of sketching. The correction factors reported by the KASI show a somewhat large variation between 0.57 and 1.09 in the period from 1987 to 2001 (Kim et al. 2003).
In this paper, we report the solar image data photographed at the ButterStar Observatory at the Dongducheon High School in 1965 days during the entire period from October 16, 2002 to December 31, 2011. Main features of our sunspot number data reported in this paper are as follows. First of all, the sunspot numbers in this paper were calculated from photographic observations. We used digital cameras for an easy automation as an effort to obtain objective results. Second, the observed data were averaged after analyzed by several different persons. Following the principle of the IRSN calculation system, to avoid any dependence on a specific observer, we defined the sunspot number of the ButterStar Observatory as the average of independent results derived by different observers belonging to the ButterStar Observatory. This is also to reduce any difference in personal skills such as classification of sunspot groups which may exist in our situation with an observatory at a high school where the student observers cannot continue their observations longer than three years. Third, our continuous observations covering one solar maximum (cycle 23) through to the next solar maximum (cycle 24) enabled a study on detailed characteristics of sunspots at different phases in the solar cycle. We expect to be able to study the evolution of sunspots by their sizes and types, and their movements at different latitudes. Fourth, we opened up new possibilities that even the small telescopes installed at most elementary, middle, or high schools in Korea can work for observations of the Sun and provide real-time imaging data. There was no independent site in Korea so far who provides solar observing data, while some observatories in the world publish the data from their daily solar observations. But the sunspot data produced at the ButterStar Observatory are published in real time through the website1.
This paper is organized as follows. In Section 2, we introduce the ButterStar Observatory and the statistics of our observations. The correction factor determined by observations and the process of calculating the relative sunspot number are discussed in Section 3, and our results regarding the north-south asymmetry are presented in Section 4. Finally, the paper concludes in Section 5.
1http://www.butterstar.net
2. BUTTERSTAR OBSERVATORY AND OBSERVATION
The ButterStar Observatory is located at 127?03? 41.3? E and 37?54? 08? N, and at an altitude of 108 m. We used a 4-inch refracting telescope (SWT-102, f9) on the Vixen Sphinx equtorial mount installed on the rooftop of the Dongducheon High School. The telescope was equipped with the Nikon Coolpix 990 and E4500 digital cameras. The Pentax XL28 mm lens was used to zoom in and take the entire face of the Sun in a single frame and Pentax XL5.2 mm was used for zoomed images of sunspots. For a solar filter, we used the AstroSolar density 5 (for direct visual use) filter by Baader in Germany which reduces the intensity of sunlight by 1/100,000. In addition, an adapter between the telescope and the cameras, a shutter release for the cameras, a blackout shade, a memory card (CF-II card), etc. were used.
The morning hours are best for solar observations since the atmosphere becomes unstable in the afternoon by the radiative heat from the ground. We photographed the Sun between 12:30 and 13:00 every day except too cloudy days, however, since we were not able to run regular observations during the work hours. During the 10 or 20 minute observing time per day, about 100 images were taken to minimize the effect of seeing which changed even within a few minutes. The f-number and shutter speed were adjusted considering the atmospheric conditions (e.g., seeing and cloud amount) at each observation. Photographs were taken in almost every clear day including holidays, and we made attempts even in cloudy days by waiting for the Sun to be positioned behind a thinner cloud. A cloud amount of 0 to 2.4, which corresponds to a clear day, has little effect on the image quality. In a partly cloudy day with a cloud amount of 3 to 5, the image quality is decided by the amount of cloud around the Sun at the moment of taking the photograph. It is hard to expect an image with a high quality in a cloudy day with a cloud amount larger than 5, compared to a clear day. Also the photographs in those days are dark overall since the clouds cover more than a half of the sky. Thus the exposure needs to be adjusted appropriately, but it is not easy to take a picture of the Sun behind a cloud. In a day with a cloud amount larger than 7.5, the Sun looks red almost hidden behind a cloud and it is difficult to get exact focus. It is recommended to find the exact f-ratio by increasing the exposure time in such a day with a cloud amount larger than 7.5. Among the solar photographs taken as described above, we select the clearest images in the best focus for the sunspot analysis. The analysis in this paper includes the image data from 1,792 days out of the whole data set of 1,965 days from October 16, 2002 to December 31, 2011.
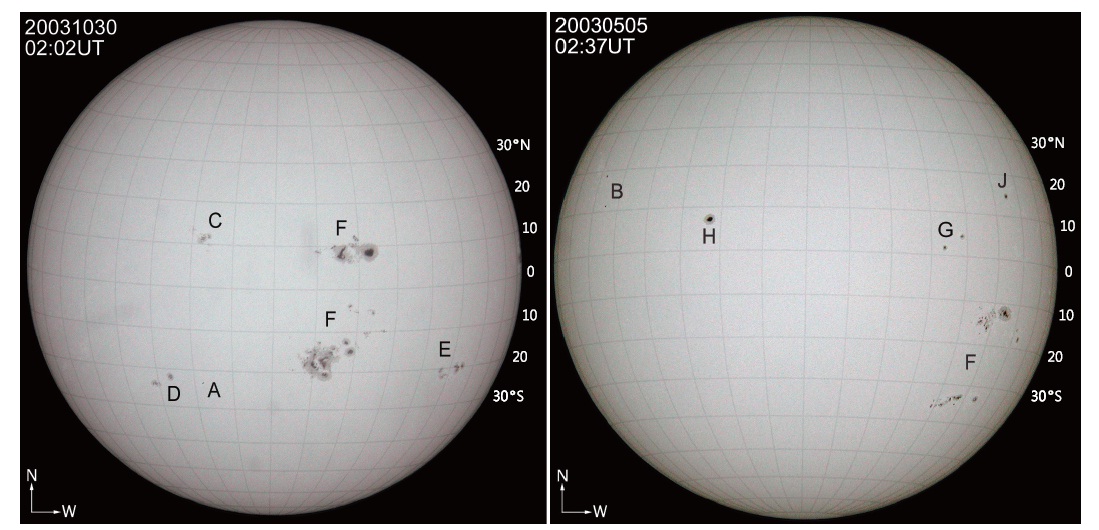
To determine the latitude and longitude of a sunspot appeared in a photograph, we compare the observed images with the Michelson Doppler imager images, which are real-time photographic data of the Sun accessible at the website of Solar and Heliospheric Observatory2, and match the orientation of the rotation axis of the Sun. Then, the latitude of each sunspot group is determined using the Stony-Hurst Net which shows the equator of the Sun. Fig. 1 is an example of the observed Sun and the Stony-Hurst Net, overlapped to determine the latitudes of the sunspot groups. As seen in Fig. 1, when it is near to the solar maximum, the number and scale of sunspots are large and their distribution is mostly around ±15?. On the other hand, at the solar
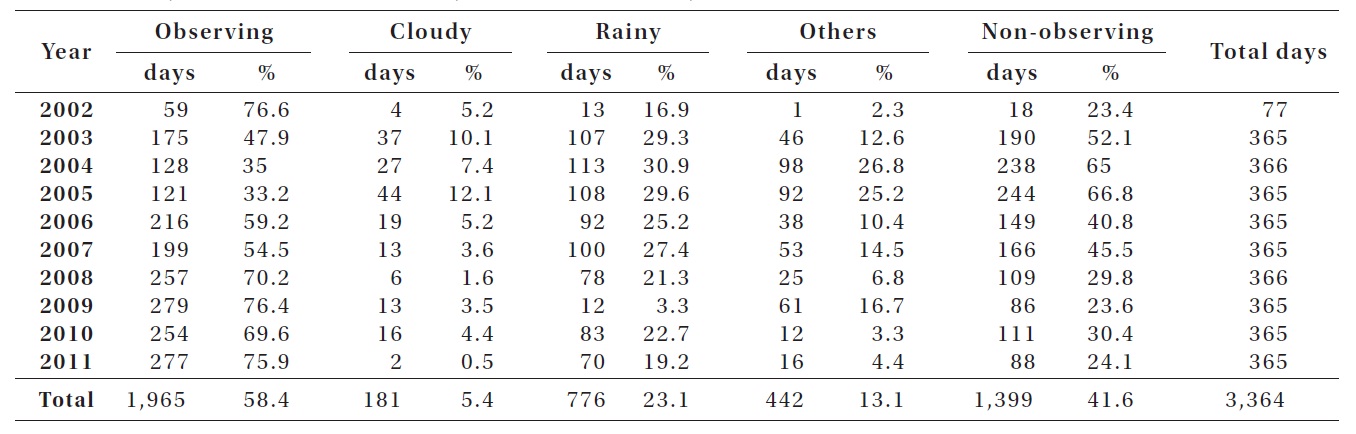
[Table 1.] Yearly statistics of the observed days and non-observed days.

Yearly statistics of the observed days and non-observed days.
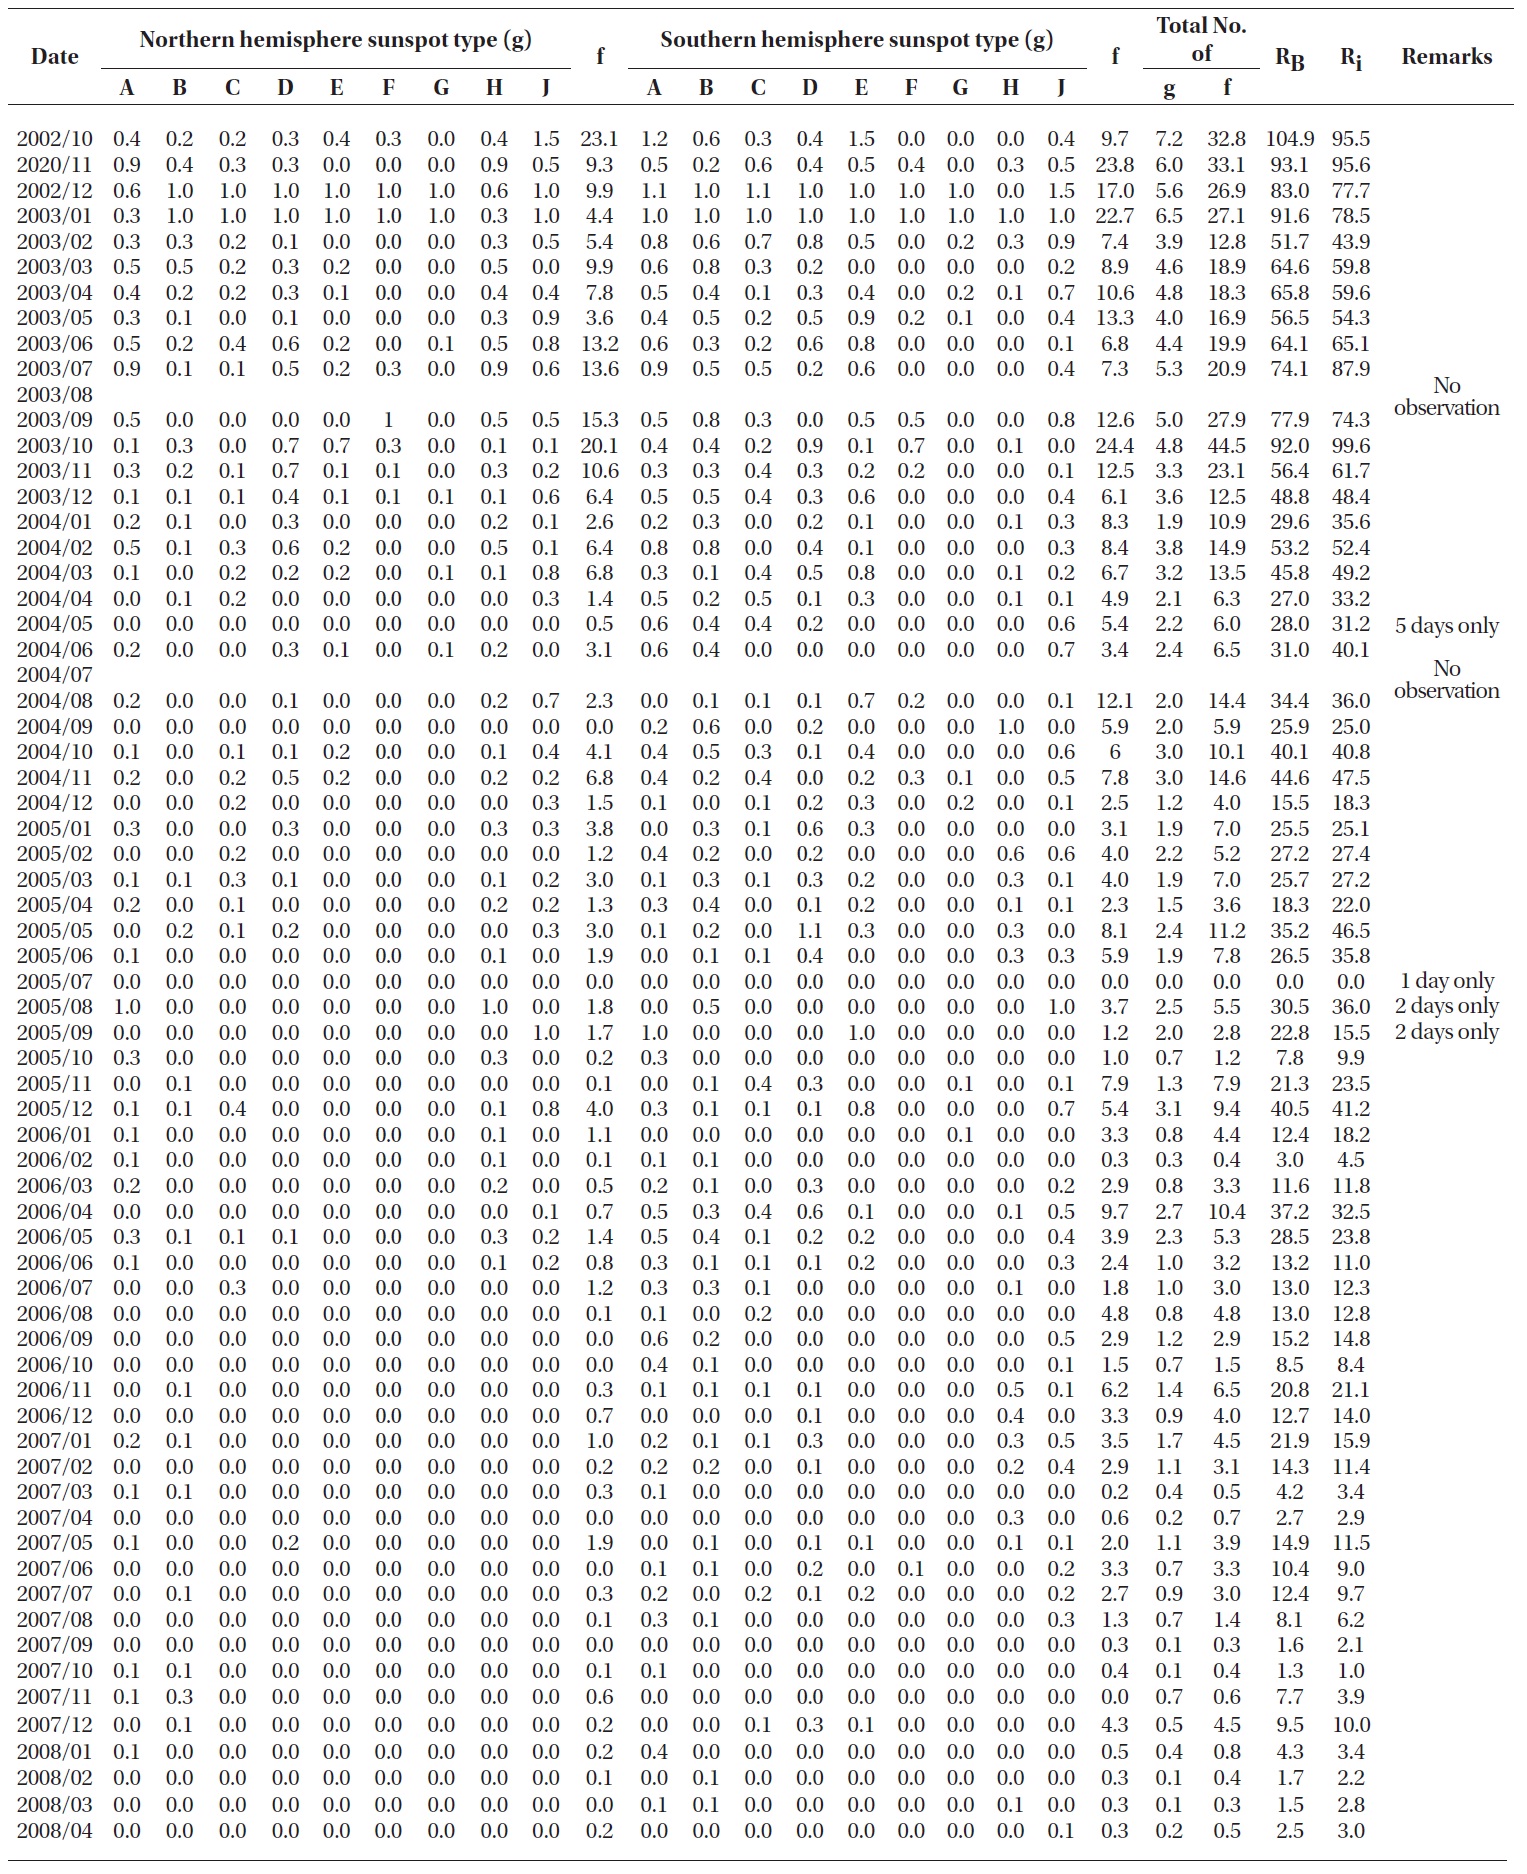
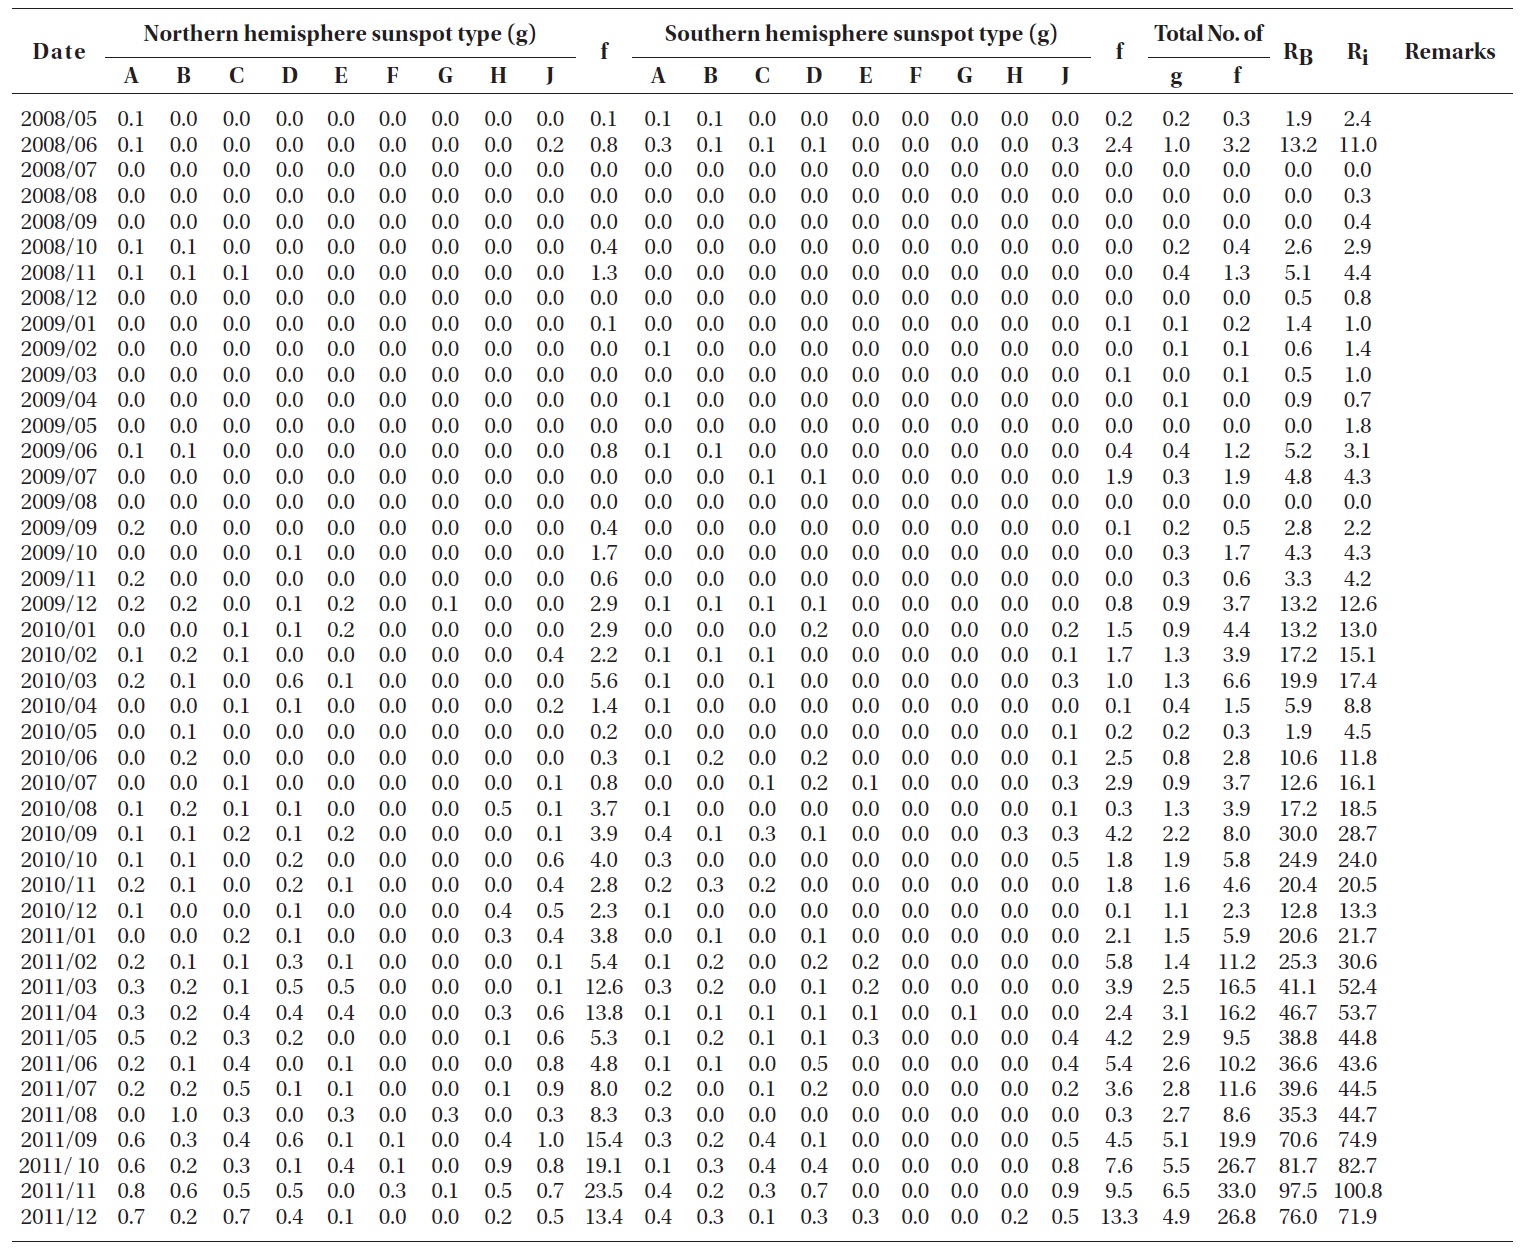
minimum, the number of sunspots is small in general and there is even a period with no sunspot at all for several days. In this case, relatively more sunspots move to the equator and there is no sunspot at high latitudes. Thus such a latitudinal distribution of sunspots can be used to determine whether the sunspots are in their maximum or minimum (Chang 2011). Table 1 shows yearly statistics of the observed days and non-observed days. Only the days of successful observations, photographs from which are included in the actual analysis data, are counted as the observed days. Table 2 presents monthly statistics of the sunspot observation. The first column is for year and month at the observation. The second to 11th columns and the 12th to 21st columns are for the observed results of sunspots in the northern hemisphere and the southern hemisphere, respectively. We present the numbers of observed sunspot groups separately in 9 classification groups following the Z?rich classification rule. The f values in the 11th and 21st columns are the numbers of isolated sunspots, and the 22nd and 23rd columns are for the total numbers of sunspot groups (g) and sunspots (f),

Monthly statistics of the sunspot observation. The first column is for year and month at the observation. The second to 11th columns and the 12th to 21st columns are for the observed results of sunspots in the northern hemisphere and the southern hemisphere, respectively. The f values in the 11th and 21st columns are the numbers of isolated sunspots, and the 22nd and 23rd columns are for the total numbers of sunspot groups (g) and sunspots (f), respectively, which are observed in both hemispheres of the Sun in that month. The table presents the monthly sunspot numbers (Ri) in the 24th column, which are calculated by R = 10g f, and the monthly IRSN in the 25th column for comparison.
(Continued)
respectively, which are observed in both hemispheres of the Sun in that month. The table presents the monthly sunspot numbers (RB) in the 24th column, which are calculated by R = 10g f, and the monthly IRSN in the 25th column for comparison. The months in which no observation was done or the number of observed days is significantly small are flagged in the remark column.
2http://sohowww.nascom.nasa.gov/data/realtime-images.html
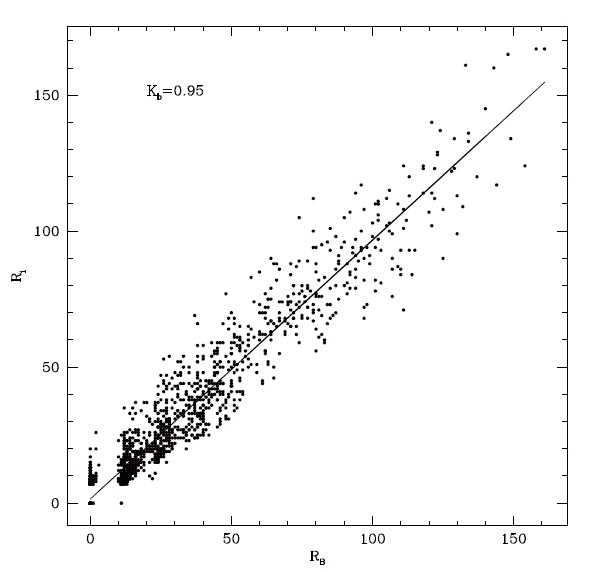
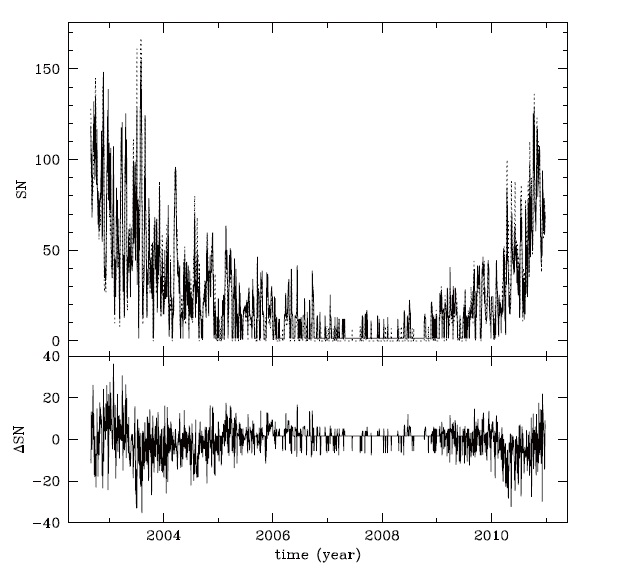
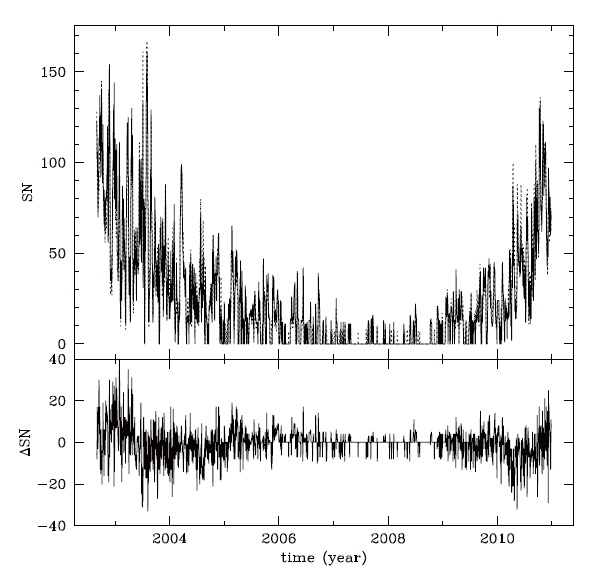
The daily number of sunspots (RB) observed at the ButterStar Observatory is represented as a function of time in comparison with the daily IRSN (Ri) in Fig. 2. In the upper panel, the solid line is for the daily sunspot number of the ButterStar Observatory (RB) and the dashed line is for the daily IRSN (Ri). It should be noted that the observed sunspot number (RB) is calculated by RB = 10g f. The lower panel shows RB - Ri. Solar cycle 23 started in May 1996, passed through its maximum in March 2000, and ended in December 2008, and solar cycle 24 started in December 2008 (Kane 2002). In the period with a large number of sunspots, uncertainties are thought to be relatively large owing to the large number of sunspots. Fig. 3 shows the relationship between the daily sunspot number of the ButterStar Observatory (RB) observed from October 2002 to December 2011 and the daily IRSN (Ri). By the linear least square method, the correction factor Kb is calculated to be 0.9519 with a standard deviation of 0.006. By comparison, the correction factors reported by the Korea Astronomy and
Space Science Institute were between 0.57 and 1.09 from 1987 to 2001 (Kim et al. 2003).
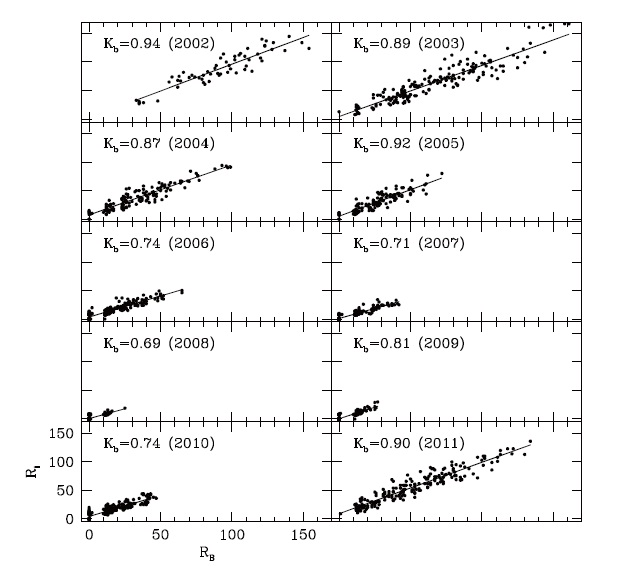
Furthermore, we try to apply the linear least square method between the sunspot number (RB) and IRSN (Ri) to the results in each year from 2002 to 2011. Fig. 4 presents the yearly Kb values and the relationships between the daily sunspot number (RB) and the daily IRSN (Ri). The scale in every panel is all the same, and the yearly correction factor is shown in the upper left corner of each
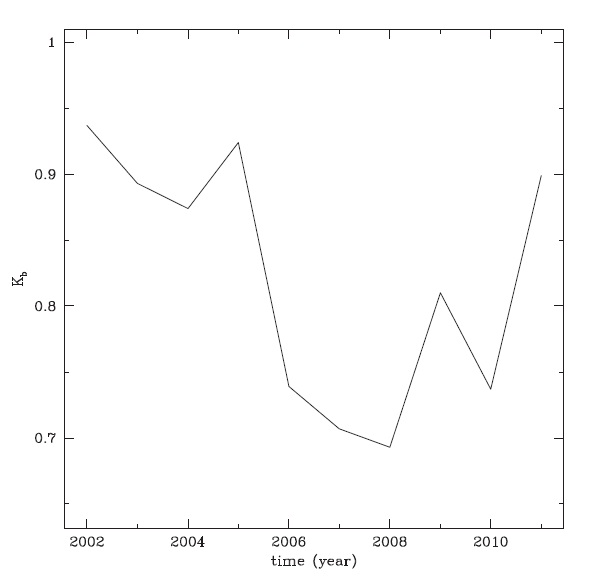
panel. We can see that the yearly correction factors are not constant from year to year. These slight differences in the yearly correction factors result from a combination of multiple causes such as photography skill of the observer, atmospheric conditions like seeing at the observation and transmittance of air, etc. But interestingly, as we can see in Fig. 5, the correction factor shows a trend to vary along the solar cycle. Similar results are found in Kim et al. (2003). It is considered that more observations and careful studies are needed to confirm if the variation in the correction factor is really coupled with the solar cycle. To make it clear, it is also regarded as an important and necessary effort to find a solution to the problem of lower statistical confidence in the linear least square method with decreasing number of sunspots.
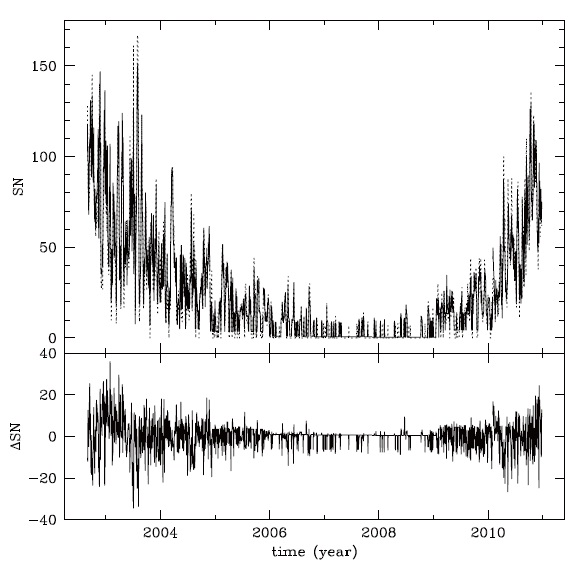
Fig. 6 shows the relationship between the corrected, daily, relative sunspot number (R) and the daily IRSN (Ri). The correction is made by multiplying the correction factor Kb = 0.9519, which is derived using the whole data set observed from October 2002 to December 2011, and adding a correction constant. Note that the relative sunspot number (R) is calculated by R = Kb (10g f). In the upper panel, the solid line represents the corrected, daily, relative sunspot number (R) and the dashed line is for the daily IRSN (Ri). The lower panel shows R - Ri. It seems not to be improved much compared to Fig. 3. However, the reason of this is thought to be that the data quality in the former stage before the correction is already high. For instance, if we assume a correction factor of 1 and a correction constant of 0, Figs. 2 and 6 would be the same. Based on this consideration, the reason why the results in Fig. 6 seem not much improved can be explained by that our correction factor is such a high value as 0.9519. In fact, looking into the monthly data of sunspot observations from 1987 to 2002 presented by the Korea Astronomy and Space Science Institute, we can find that the maximum difference in their daily sunspot numbers exceeds 100 and, even after corrections, their relative sunspot number is still larger
than 40 at its maximum (Kim et al. 2003). Fig. 7 presents the relationship between the daily relative sunspot number (R), corrected for each year using the yearly correction factor, and the daily IRSN (Ri). The sunspot numbers are corrected for each year using the yearly correction factors, which are derived from the sunspot data separated by year, and using separate correction constants. In the upper panel, the solid line represents the corrected, daily, relative sunspot number (R) and the dashed line is for the daily IRSN (Ri). The lower panel shows R - Ri. Considering the difference between the newly calculated relative sunspot number (R) and the daily IRSN (Ri), it seems possible to reduce the errors a little bit further by determining the correction factors year by year. Especially, we can see that the improvement is significant in the results from the period between 2006 and 2009 when is around the solar minimum and shows a large difference in the correction factor from 1.
4. DISTRIBUTION OF SUNSPOT GROUPS RELATED TO THE NONTH-SOUTH ASYMMETRY IN THE SUN
Table 3 summarizes by year the percentages of sunspot groups (g) and sunspots (f) which appeared in the northern and southern hemispheres of the Sun over the entire observing period from October 16, 2002 to December 31,
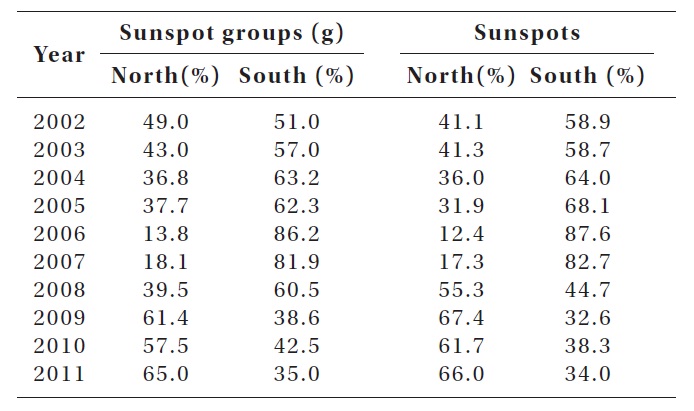
Percentages of sunspot groups (g) and sunspots (f) which appeared in the northern and southern hemispheres of the Sun over the entire observing period. It is to show what percentages of sunspot groups and isolated sunspots were found in the northern or southern hemisphere in a given year.
2011. It is to show what percentages of sunspot groups and isolated sunspots were found in the northern or southern hemisphere in a given year. Until 2008, during solar cycle 23, there are more sunspot groups and isolated sunspots in the southern hemisphere. On the other hand, during solar cycle 24 starting from 2008, more sunspot groups and isolated sunspots are found in the northern hemisphere. In detail, from 2002 to 2008, 35.4% and 64.6% of sunspot groups and 35.1% and 64.9% of isolated sunspots in average occurred in the northern hemisphere and in the southern hemisphere, respectively, and from 2008 to 2011, 61.3% and 38.7% of sunspot groups and 65.0% and 35.0% of isolated sunspots in average appeared in the northern hemisphere and in the southern hemisphere, respectively. This asymmetry in the Sun coincides with the previous reports (Chang 2008). In a following study, we are planning to investigate what correlation exists between the solar North-South asymmetry and the characteristics of sunspots such as the distribution of types of sunspot groups, the correction factors, etc.
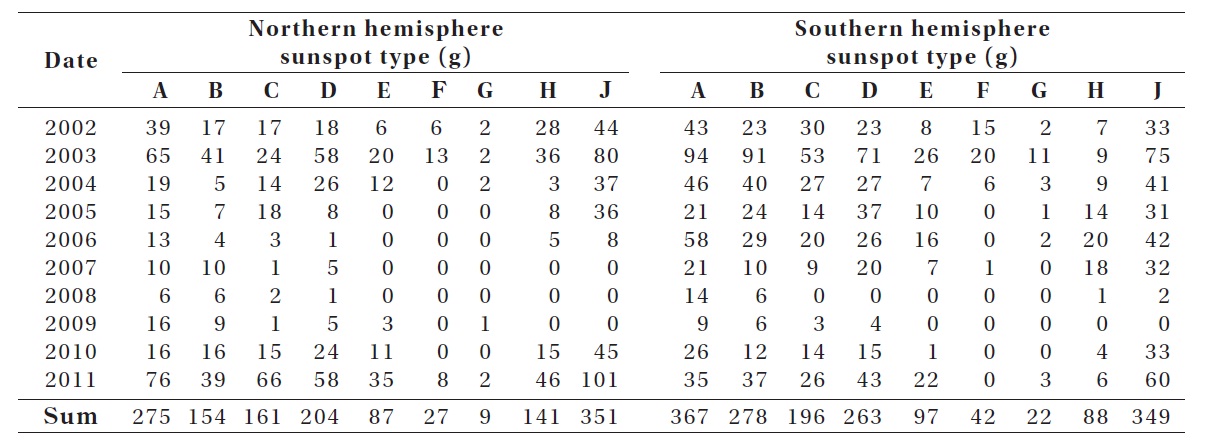
Table 4 presents by year the distribution of types of sunspot groups in the northern and southern hemispheres

Distribution of types of sunspot groups in the northern and southern hemispheres of the Sun. We can see that the occurrence frequency of sunspot groups varies differently from type to type through the solar cycle.
of the Sun. Refer to McIntosh (1990) for the classification of sunspot groups. We can see that the occurrence frequency of sunspot groups varies differently from type to type through the solar cycle. In other words, more frequent types of sunspot groups are different depending on the phase of solar cycle. Considering the above explanations, it may be interpreted as the emerging and decaying mechanism of sunspot groups changes at different phases of the solar cycle. The reason why this is an important observational fact is that it implies a connection between the evolution of magnetic field, which is directly indicated by sunspot groups, and the phase of solar cycle. The magnetic field of the Sun is known to be generated by the dynamo mechanism. It is considered that we can study the dependence of the dynamo mechanism on the phase of solar cycle through a following study.
In this paper, we analyzed the photographic data of the Sun from our observations at the ButterStar Observatory at the Dongducheon High School for 1,965 days, out of the entire research period of 3,364 days from October 16, 2002 to December 31, 2011. While only the Korea Astronomy and Space Science Institute has been observing the Sun since 1987 in South Korea, we assess ourselves that we confirmed the possibilities of using the small telescopes at domestic elementary, middle, or high schools for continuous observations of the Sun with providing their data in real time. Furthermore, since ours are photographic observations differently from the sketching observations at the Korea Astronomy and Space Science Institute, our data should be the only source available in Korea for comparison and mutual supplement for those two data sets. Also, our data enable a study on the detailed characteristics of sunspots at different phases in the solar cycle by the continuous observations from one solar maximum (cycle 23) through the next solar maximum (cycle 24). Studies on the evolution of sunspots by their sizes and types or their movements at different latitudes are expected to be possible.
The correction factor Kb is 0.9519, calculated by applying the linear least square method to the relationship between all the daily sunspot number (RB), obtained from our entire observing period, and the daily IRSN (Ri). When calculated for each year, the yearly correction factor has slightly different values from year to year and shows a trend of changing along the solar cycle. In general, the correction factor is larger at the solar maximum and smaller at the solar minimum. However, it is considered that more observations and studies are necessary to confirm a real connection between the variation in the correction factor and the solar cycle.
We found that there were more sunspot groups and isolated sunspots in the southern hemisphere until 2008 in solar cycle 23. On the other hand, after 2008 in solar cycle 24, sunspot groups and isolated sunspots have been observed more in the northern hemisphere. From 2002 to 2008, 35.4% and 64.6% of sunspot groups and 35.1% and 64.9% of isolated sunspots in average occurred in the northern hemisphere and the southern hemisphere, respectively, and from 2008 to 2011, 61.3% and 38.7% of sunspot groups and 65.0% and 35.0% of isolated sunspots in average appeared in the northern hemisphere and the southern hemisphere, respectively.
We noticed that the occurrence frequencies of sunspot groups in different types vary through the solar cycle, which can be interpreted as the emerging and decaying process of sunspot groups is different depending on the phase of solar cycle. Thus, it implies that the evolution of magnetic field can be related to the phase of solar cycle. It is considered that a following study can contribute to our understanding on the dependence of the dynamo mechanism on the phase of solar cycle.