검색 전체 메뉴
PDF
맨 위로
OA 학술지
Are the Distribution of Einstein Crossing Times of Galactic Microlensing Events Bimodal?
  • 비영리 CC BY-NC
  • 비영리 CC BY-NC
ABSTRACT
Are the Distribution of Einstein Crossing Times of Galactic Microlensing Events Bimodal?
KEYWORD
gravitational microlensing: einstein crossing times , galaxy: bar/bulge
  • 1. INTRODUCTION : ELEMENTARY DETAILS OF SIMPLE GRAVITATIONAL MICROLENSING

    We all know that if a forground object, like a planet or its moon, passes in front of a background star we witness an event called an occultation. We know also that if a distant object in the close vicinity of a star passes in front of that star we witness an event called either an eclipse, as in a close binary star, or a transit, as in the case of a planet orbiting a parent star. However, if an object midway between us and a distant star passes in front of the background star an entirely new phenomenon is predicted by General Relativity, originally suggested by Einstein (1936), whereby the background star’s light is magnified; this is called microlensing. Light rays from the distant star are deflected by the intervening object’s mass, which acts as the gravitational lens, such that instead of a single train of photons reaching the observer, many more trains of photons reach him because of light bending, hence increasing the background star’s brightness manyfold1. While theoretically this brightening could be nearly infinite, finite source size effects limit how large an amplification could occur for very close alignment, but a few microlensing events produced brightenings of several hundreds (5-7 mag). Naturally an intervening single object can only do this once, so microlensing is a one time event for this situation. Furthermore, General Relativity predicts that there is no wavelength dependence for this phenomenon, so events are achromatic and can be distinguished from instrinsic stellar variability.

    The observational consequences of the optics of gravitational microlensing were detailed by Paczy?ski (1986). He showed that a combination of the distance to the background star dS, the distance to the intervening lens dL and its mass M, defined an angular circle of radius θE around the lens, called its Einstein radius:

    image

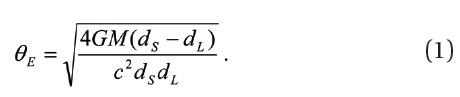
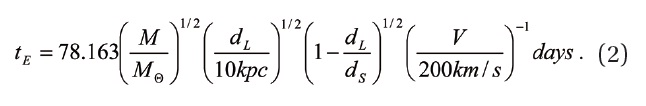
    Since both background star and lens move in the gravitational potential of the Galaxy, the relative velocity V across the line of sight (los) crossing θE produces a unique light curve. Its two independent fitting parameters are its amplitude A, which depends on the impact parameter of the intervening object across θE (i.e on the closeness of the alignment between observer, lens, and source), and its width, called the Einstein crossing time tE, i.e. usually 2 θE divided by the los velocity (some early papers used just θE divided by V). This simple case assumes the background star is a point, the lens is a point mass, and the relative path of the two is a straight line, so the resulting light curve is symmetric.

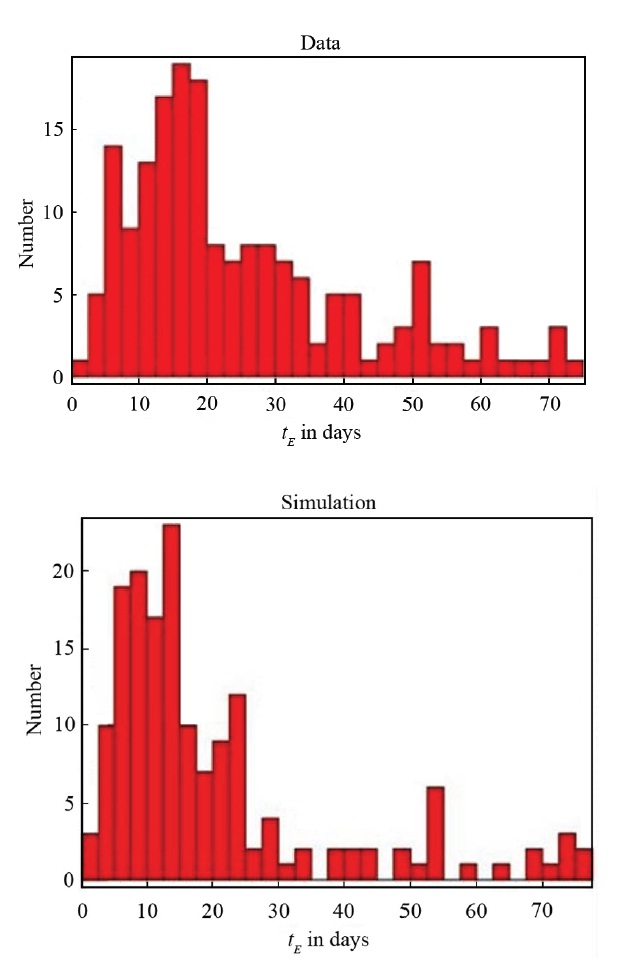
    Alcock et al. (2000, Fig. 10) plotted the distribution of microlensing events toward the galactic center; their semi-logarithmic plot has a distinctly bimodal appearance2. Using a mass model for the galactic disk and bulge/bar, they also provided a comparison of the distribution of tE with four stellar mass models proposed to be responsible for them: a δ-function at 0.1 M, a δ-function at 1 M, a present day Main Sequence mass function (Scalo 1986), and the Han & Gould (1996) power-law model with specific parameters. Each of these models produce a unimodal fit which did not match the observed distribution well.

    A and tE are the only two parameters derivable from the light curve of microlensing events with symmetric light curves, so we do not know explicit values of θE, dS, dL, M or V for any of them without additional observational data, which is fairly meager. To date, there are only two photometrically identified lenses, and in both cases each is an M dwarf (Alcock et al. 2001, Kallivayalil et al. 2006), indicating that Main Sequence stars contribute to the observed tE distribution. In two other cases the lens mass is only inferred from a slight asymmetry in the light curve due to parallax effects induced by earth’s orbital motion. In one case, the lens is asserted to be either a white dwarf or neutron star (Alcock et al. 1995), and in the other case, an event with a long tE (640 d), a black hole (Bennett et al. 2002, Mao et al. 2002).

    1 See power-point presentation cited in Abstract for a cartoon of this situation.

    2 See power-point presentation cited in Abstract.

    2. OUR SAMPLE OF CROSSING TIMES

    Values of tE for large sample of some 400 events of stars in the direction of the Galactic Center have been obtained by the Massive Compact Halo Object (MACHO), Optical Gravitational Lensing Experiment (OGLE) and Microlensing Observations in Astrophysics (MOA) projects as of 2008. Typically these are derived from microlensing lightcurves whose amplitudes are statistically detectable from comparision of pre- and post-microlensing brightness of a given background star. However not all are usable because of the fact that starfields toward the galactic center are very crowded and cause an observation selection called blending. If a microlensed background star has stars superimposed along the los near its image, the baseline value of that star’s luminosity cannot be known without additional processing, resulting in measured tE values that are systematically shorter than in actuality. Corrections for blending pares down the large sample to about 160 events that provides a clean sample of tE values. Three samples of blending-corrected events are provided in Alcock et al. (2000) for the MACHO experiment, Sumi et al. (2003) for the MOA experiment, and Sumi et al. (2006) for the OGLE experiment.

    3. METHODS

    From Eq. (1) the equation containing the unknown variables yields:

    image

    We generate tE via Monte Carlo simulations assuming density and velocity distributions for the Galactic bar and disk, with stellar masses selected from known distributions of both main sequence and white dwarf samples. Each set of generated distributions is then compared with our observed distribution via a Kolmogoroff-Smirnoff (KS) two sample test.

    Distances dS and dL are selected from standard Galactic disk and bar models, which are summarized by Han & Gould (1995). For the disk R0 is the solar distance, ρ0 is the density in the solar neighborhood, and s and z’ form a system of cylindrical galactocentric coordinates, with exponential scale lengths for both radial (sD) and z-direction (h) components of the disk:

    image

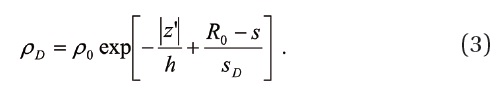
    For the triaxial bar with central luminosity density υ0, and scale lengths x0, y0 and z0 :

    image

    where

    image

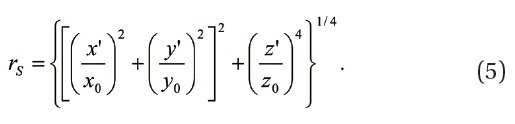
    In these coordinates the galactic center is at the origin. Note that Alcock et al. (2000) assume that dL is drawn from the disk component while dS is drawn from the bulge component; we make the assumption that that both dL and dS can be drawn from either component as there is no strong a priori reason to assume otherwise.

    Transverse orbital velocities of lens and background star are computed from a standard galactic rotation model of Han and Gould (1995), which is consistent with the density distributions above.

    Masses are chosen from observed mass function of Main Sequence and white dwarf stars. For main sequence masses a combination of Scalo’s (1986) initial mass function and a rapidly falling three segment power law form of Kroupa et al. (1993) were used:

    image

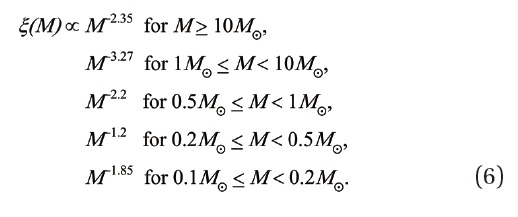
    We have not modeled alternative Main Sequence mass functions (log-normal distributions) for low mass stars per Chabrier (2003) or Bochanski et al. (2010), nor included sample events with tE < 2 days, implying a mass component of interstellar Jupiter-like planets (Sumi et al. 2011).

    Gaussian distributions of both DA and DB white dwarf mass functions of Kepler et al. (2007), with the following mean masses and their dispersions, were used:

    image

    4. RESULTS

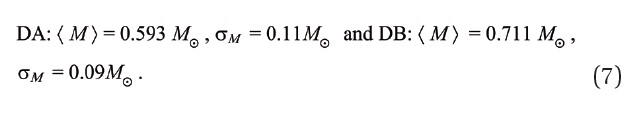
    Fig. 1 shows our observed sample of blending-corrected tE and one simulation from our model that mimics the data.

    The KS two-sample test was used to see if the two distributions had been drawn from the same parent distribution. For any acceptable agreement two mass distributions were essential. We find that the white dwarf contribution should be as high as about 25% to explain the data well. Out of this contribution, we needed about 86% DA and 14% DB dwarfs.

    There was very poor agreement if all the source stars were chosen only from the bar. This is contrary to Alcock et al. (2000) who had taken all sources to be in the bar. Our analysis shows that 90% of the sources come from the bar while the rest must be drawn from the disk population. Excellent agreement was obtained for all the lens distances chosen equally from the disk and bar populations.

    The KS test indicates that our simulations agree with the observed distribution with a significance level > 97%. Our analysis shows that the possible bimodality of tE could be due to 25% white dwarfs and 75% Main Sequence stars. This is consistent with other estimates of the white dwarf mass contribution to the Galaxy (Binney & Merrifield 1998).

참고문헌
  • 1. Alcock C, Allsman RA, Alves D, Axelrod TS, Bennett DP (1995) First observation of parallax in a gravitational microlensing event. [ApJ] Vol.454 P.L125-L128 google cross ref
  • 2. Alcock C, Allsman RA, Alves DR, Axelrod TS, Becker AC (2000) The MACHO project: microlensing optical depth toward the galactic bulge from difference image analysis. [ApJ] Vol.541 P.734-766 google cross ref
  • 3. Alcock C, Allsman RA, Alves DR, Axelrod TS, Becker AC (2001) Direct detection of a microlens in the Milky Way. [Natur] Vol.414 P.617-619 google cross ref
  • 4. Bennett DP, Becker AC, Calitz JJ, Johnson BR, Laws C (2002) The microlensing event MACHO-99-BLG-22/OGLE-1999-BUL-32: an intermediate mass black hole, or a lens in the bulge. [ApJ] Vol.579 P.639-659 google
  • 5. Binney J, Merrifield M 1998 Galactic astronomy google
  • 6. Bochanski JJ, Hawley SL, Covey KR, West AA, Reid IN (2010) The luminosity and mass functions of the low-mass stars in the galactic disk. II. The field. [AJ] Vol.139 P.2679-2699 google cross ref
  • 7. Chabrier G (2003) Galactic stellar and substellar initial mass function. [PASP] Vol.115 P.763-795 google cross ref
  • 8. Einstein A (1936) Lens-like action of a star by the deviation of light in the gravitational field. [Sci] Vol.84 P.506-507 google cross ref
  • 9. Han C, Gould A (1995) The mass spectrum of MACHOs from parallax measurements. [ApJ] Vol.447 P.53-61 google cross ref
  • 10. Han C, Gould A (1996) Statistical determination of the MACHO mass spectrum. [ApJ] Vol.467 P.540-557 google cross ref
  • 11. Kallivayalil N, Patten BM, Marengo M, Alcock C, Werner MW (2006) Identification of the microlens in event MACHO-LMC-20. [ApJ] Vol.652 P.L97-L100 google cross ref
  • 12. Kepler SO, Kleinman SJ, Nitta A, Koester D, Castanheira BG (2007) White dwarf mass distribution in the SDSS. [MNRAS] Vol.375 P.1315-1324 google cross ref
  • 13. Kroupa P, Tout CA, Gilmore G (1993) The distribution of low-mass stars in the Galactic disc. [MNRAS] Vol.262 P.545-587 google
  • 14. Mao S (2008) Introduction to microlensing [in Proceedings of the Manchester Microlensing Conference: The 12th International Conference and ANGLES Microlensing Workshop] google
  • 15. Mao S, Smith MC, Wo?niak P, Udalski A, Szyma?ski M (2002) Optical gravitational lensing experiment OGLE-1999-BUL-32: the longest ever microlensing event - evidence for a stellar mass black hole? [MNRAS] Vol.329 P.349-354 google cross ref
  • 16. Paczy?ski B (1986) Gravitational microlensing by the galactic halo. [ApJ] Vol.304 P.1-5 google cross ref
  • 17. Scalo JM (1986) The stellar initial mass function. [FCPh] Vol.11 P.1-178 google
  • 18. Sumi T, Abe F, Bond IA, Dodd RJ, Hearnshaw JB (2003) Microlensing optical depth toward the galactic bulge from microlensing observations in astrophysics group observations during 2000 with difference image analysis. [ApJ] Vol.591 P.204-227 google cross ref
  • 19. Sumi T, Kamiya K, Udalski A, Bennett DP, Bond IA (2011) Unbound or distant planetary mass population detected by gravitational microlensing. [Natur] Vol.473 P.349-352 google cross ref
  • 20. Sumi T, Wo?niak PR, Udalski A, Szyma?ski M, Kubiak M (2006) Microlensing optical depth toward the Galactic bulge using bright sources from OGLE-II. [ApJ] Vol.636 P.240-260 google cross ref
OAK XML 통계
이미지 / 테이블
  • [ Fig. 1. ]  Observed tE distribution vs. simulated distribution.
    Observed tE distribution vs. simulated distribution.
(우)06579 서울시 서초구 반포대로 201(반포동)
Tel. 02-537-6389 | Fax. 02-590-0571 | 문의 : oak2014@korea.kr
Copyright(c) National Library of Korea. All rights reserved.