It is considered that the solar activity cycle results from the solar dynamo. The development of sunspots and sunspot groups, therefore, reflects the evolution of the solar magnetic field (Devore et al. 1984, Schrijver 2001, Wang et al. 2002). It is eventually because properties of surface magnetic features should be related to the physical processes at work below the solar surface that may control the solar cycle. Hence, study of temporal behavior of sunspot groups is important not only for understanding configuration of the magnetic structure on the Sun but also for predicting eruptive phenomena, such as, flares and coronal mass ejections (CMEs).
Observing and monitoring sunspots is an important and basic step to study various aspects of the solar activity. For this reason a number of solar observatories continuously perform their best in indexing solar activities. Among many indices of solar activity the sunspot number has been a basis for input data of the Sun in the study of constraints on the solar dynamo model, in reconstruction of the solar irradiance, for prediction of the solar cycle which influences the magnetosphere and ionosphere of the Earth. Sunspot numbers are traditionally counted as daily Wolf numbers defined at the Zurich Observatory in 1849:
The number of observed sunspot groups can be separately specified in 9 classification types (A, B, C, D, E, F, G, H, and J) following the Zurich classification rule. The Zurich sunspot group classification was first introduced by Waldmeier. The Zurich classification emerged as a revised classification scheme introduced by Cortie (1901), which was later modified by McIntosh (1981). This modified Zurich classification consists of three components. In the modified Zurich classification, the definition of the classes is still based on the original Zurich classification, with the one exception that G and J classes are removed in the modified classification (for more details see McIntosh 1990). Note that sunspot groups can be broadly divided into two groups: the small sunspot group (A, B, C, H, and J) and the large sunspot group (D, E, F, and G). In the latter group, the main leading and following sunspots should be present and they should have a penumbra. Their longitudinal extent is generally larger than 5 degrees. Thus, this group contains the majority of complex active regions (Lefevre & Clette 2011).
Recently, Oh & Chang (2012) have analyzed the data set of sunspots observed at the ButterStar observatory for 3364 days from 2002 October 16 to 2011 December 31. In their results they presented the distribution of classes of sunspot groups in the northern and southern hemispheres of the Sun, respectively. They have found that there have been more sunspot groups and isolated sunspots in the southern hemisphere until 2008 in solar cycle 23. On the other hand, after 2008 in solar cycle 24, sunspot groups and isolated sunspots have been observed more in the northern hemisphere. In addition to this, more interestingly enough, they have noticed that the occurrence frequency of sunspot groups varies differently from class to class through the solar cycles. That is, for a given phase of the solar cycle, more frequent types of sunspot groups are different.
Since it may be interpreted as the growing and decaying mechanism and/or efficiency of emerging sunspot groups changes at different phases of the solar cycle, it should be of importance to investigate the dependence of the sunspot group type on the phase of the solar cycle in details. In fact, several similar studies have been made. For instance, through the solar cycle, the emergence frequencies of bipolar active regions has been reported to vary in phase (Harvey & Zwaan 1993). The growth and decay rates of sunspot group umbral areas are also found to be a function of the phase of solar activity (Willson et al. 1981, Howard 1992, Hathaway & Choudhary 2008, Javaraiah 2011). Furthermore, many characteristics of relationship between solar flare activity and complexity of sunspot groups are reported (Lustig & Wohl 1995, de Toma et al. 2004, Hathaway & Choudhary 2008, Abramenko & Yurchyshyn 2010a,b, Kilcik et al. 2011, Norquist 2011).
In this paper, we investigate temporal changes of sunspot group numbers according to their Zurich class with monthly mean sunspot group numbers observed at the ButterStar observatory during the period from October in 2002 to December in 2011. This paper is organized as follows. In Section 2, we briefly introduce the data set used in the present analysis. The results we have obtained are presented in Section 3. Finally, the paper discusses and concludes in Section 4.
The data set we analyze here is basically taken from the same data set reported in Oh & Chang (2012). The ButterStar Observatory uses a 4-inch refracting telescope (SWT-102, f9) on the Vixen Sphinx equatorial mount installed on the rooftop of the Dongducheon High School, and the Nikon Coolpix 990 and E4500 digital cameras for photographic observations. Photographs of the Sun have been taken in almost every clear day including holidays, and attempts have been made even in cloudy days by waiting for the Sun to be positioned behind a thinner cloud. From the digitized photographs the daily sunspot number is calculated according to the Wolf’s rule. Besides, the number of observed sunspot groups is recorded separately in 9 classification groups following the original Zurich classification rule. As in Table 2 of Oh & Chang (2012), monthly mean sunspot group numbers are then computed for the present analysis. Note that the correction factor
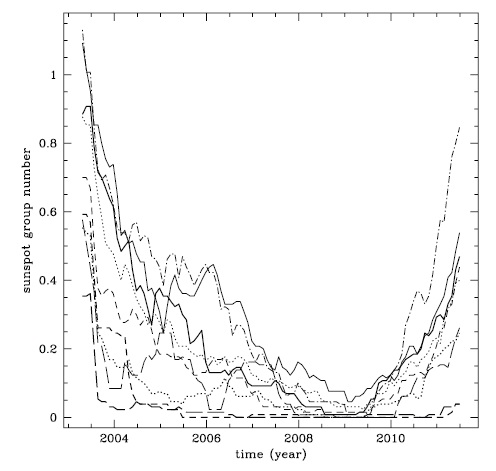
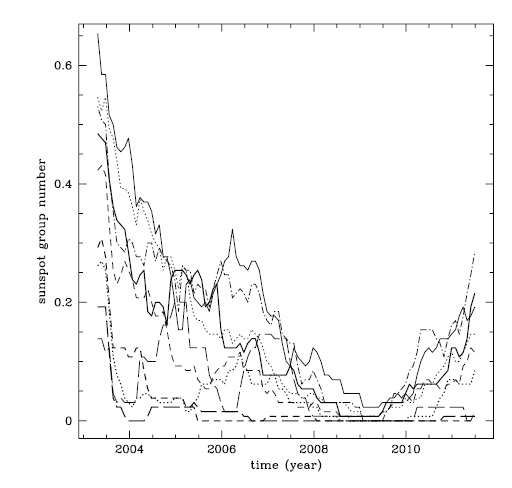
In Fig. 1 we show time variations of the monthly mean number of sunspot groups according to their Zurich class, resulting from sunspot groups having appeared only in the solar northern hemisphere. Since the monthly mean numbers are quite noisy we implemented a box-car moving average. In this particular example, the length and the moving-step of the box are 13 months and 1 month, respectively. Different line types stand for different sunspot
group types. For thick lines, solid, dotted, short dashed, and long dashed lines represent the Zurich classification types D, E, F, and G, respectively. For thin lines, solid, dotted, short dashed, long dashed, dot-dashed lines represent the Zurich classification types A, B, C, H, and J, respectively. Eventually, thick and thin lines correspond to large and small sunspot groups, respectively. Noting that solar cycle 23 started in May 1996, passed through its maximum in March 2000, and ended in December 2008, and solar cycle 24 started in December 2008 (Kane 2002), general trends apparently follow the behavior of the international relative sunspot number. It is quite interesting to note, however, that sunspot group types of A and J, which belong to small sunspot groups, seem to make a peak in the distribution at around 2005.
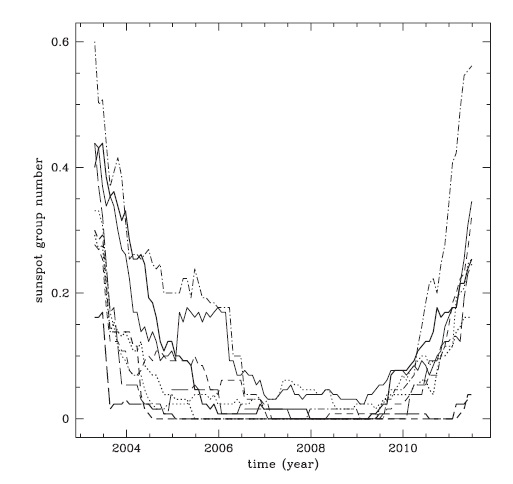
In Fig. 2, we show similar plots resulting from sunspot groups which appeared only in the solar southern hemisphere. Line types correspond to same Zurich classification types as in Fig. 1. As reported in other researches on the solar North-South asymmetry (Chang 2008, Oh & Chang 2012), it is seen that there are more sunspot groups in the southern hemisphere up to 2008, which belong to solar cycle 23, while more sunspot groups appear in the northern hemisphere after 2008 during solar cycle 24. We also note that the secondary maximum, occurring between the solar maximum and the solar minimum, takes place about 1 year after occurring in the solar northern hemisphere. That is, the secondary maxima occur at ~2005 in the solar northern hemisphere and at ~2006 in the solar southern hemisphere, respectively. In addition, as approaching to the solar minimum in 2008 occurrence frequency distribution of sunspot groups seems
decaying more slowly in the solar southern hemisphere than in the solar northern hemisphere. That is, in the declining phase of solar cycle 23 the decreasing tendency is apparently steeper in the solar northern hemisphere than in the solar southern hemisphere.
In Fig. 3, we show similar plots resulting from sunspot groups which appeared in both solar hemispheres as a whole. The secondary peak behavior can be also seen, at least, in some of sunspot group types. We suspect that it seems related to small humps in the latitudinal distribution of the center-of-latitude (COL) of the sunspots
(Chang 2012). In Chang (2012), COL is not monotonically decreasing with time in each solar cycle and that small humps is around every solar maxima. They have claimed that this particular behavior of the latitudinal distribution of sunspots should be related to the dynamo action. Hence, it is an interesting research topic to see whether the secondary peak seen here is somehow related to the hump in the latitudinal distribution.
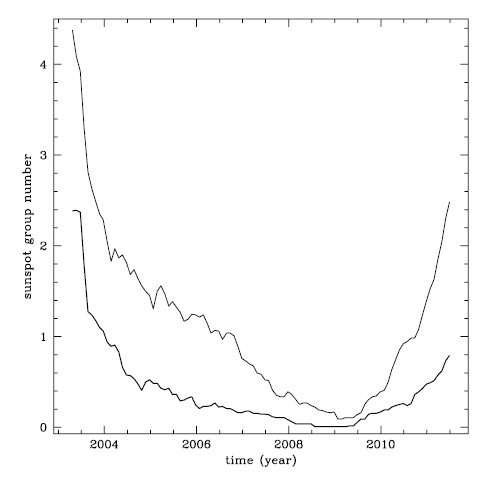
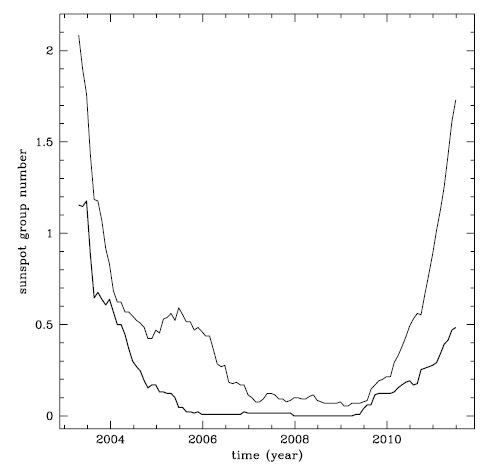
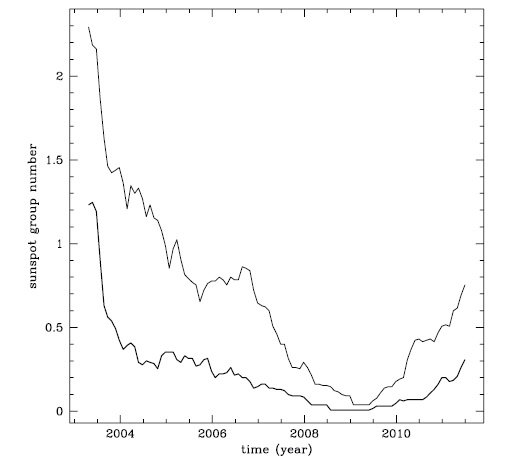
As described above, sunspot groups are grouped into two subsamples according to their typical size and complexity. In Figs. 4 to 6, we show the time variations of large and small sunspot group numbers instead of showing results of individual sunspot group types. Similar to Figs. 1-3, monthly mean sunspot group numbers are moving-averaged, before grouping into large and small sunspot subsamples. Thick and thin lines represent large sunspot group numbers and small sunspot group numbers, respectively. Fig. 4 results from sunspot groups having appeared only in the solar northern hemisphere. Features discussed above in Fig. 1 can be clearly seen. That is, small sunspot groups results in a secondary peak around at 2005. Similar to Fig. 4, we show results from sunspot groups having appeared only in the solar southern hemisphere in Fig. 5. Features seen in Fig. 2, which include a retarded secondary peak, can be clearly seen, too. In Fig. 6, we show results from sunspot groups having appeared in both hemispheres. Again, the secondary peak can be seen, but the peak becomes modest and broad due to adding. That is, the secondary maxima occur at different times. Another important difference between small and large sunspot groups seen clearly in Figs. 4-6 is that the small sunspot group emerge more frequently than the large sunspot group both in the declining phase and in the rising
phase of the solar cycle. In other words, one may claim that the large sunspot group declines earlier and faster and that the small sunspot group begins to rise earlier and faster. Hence, the variation of small and large sunspot groups in each hemisphere does not closely resemble to each other. We have attempted the Kolmogorov-Smirnov test (K-S test) to statistically check if their distributions are analogous. The probabilities that they are comparable are found to be extremely low (typically < 0.001%). Hence we may safely conclude that the time variations of small and large sunspot numbers are disparate.
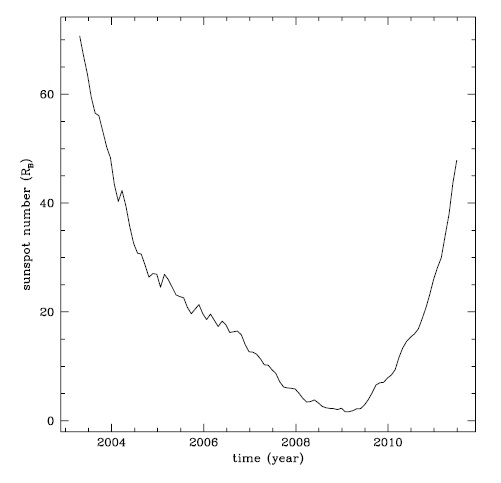
In Fig. 7, for comparison, we show the observed sunspot number defined by
Since the development of surface magnetic features should reflect the evolution of the solar magnetic field in the deep interior of the Sun, it is crucial to study properties of sunspots and sunspot groups to understand the physical processes at work below the solar surface. Here, using the data set of sunspots observed at the ButterStar observatory for 3,364 days from 2002 October 16 to 2011 December 31, we investigate temporal changes of sunspot group number according to their Zurich classification type. Monthly mean sunspot group numbers are then computed for the present analysis. Note that the correction factor
It is found that there are more sunspot groups in the southern hemisphere up to 2008, which belong to solar cycle 23, while more sunspot groups appear in the northern hemisphere after 2008 during solar cycle 24. We also note that in the declining phase of solar cycle 23 the slope of the distribution is apparently steeper in the solar northern hemisphere than in the solar southern hemisphere. We have found that some of sunspot group types make a secondary peak between the solar maximum and the solar minimum in the temporal distribution. More importantly, in this particular data set, sunspot groups which have appeared in the solar southern hemisphere make a secondary peak 1 year after a secondary peak occurred in the solar northern hemisphere. It becomes more evident when we repeat the analysis after grouping into the small sunspot group and the large sunspot group. We suspect that it seems related to small humps in the latitudinal distribution of the COL of the sunspots in Chang (2012). Another thing we find in this analysis is that the time variations of small and large sunspot group numbers are disparate. That is, the large sunspot group declines earlier and faster and that the small sunspot group begins to rise earlier and faster. According to K-S test, the probabilities that they are comparable are found to be extremely low (typically < 0.001%). Lastly, the total number of observed sunspot is found to behave more likewise as the small sunspot group does, since the value of
We conclude by pointing out its implication on the space weather forecast. Study of temporal behavior of sunspot groups is important not only for understanding configuration of the magnetic structure on the Sun but also for predicting eruptive phenomena. One may expect that the morphology of sunspot groups is somehow related with the surface magnetic activity. According to theoretical works certain sunspot group classes have flaring probabilities significantly higher than others indeed (Tur & Priest 1978, Veronig et al. 2004, Zharkov & Zharkova 2006). It has been claimed by the recent research that the 10.7 cm solar radio flux, the facular area, and the maximum CME speed show a higher degree of agreement with the large sunspot group numbers than with the small sunspot group numbers ( Lefevre & Clette 2011). That is, mature and complex sunspot groups are more likely to produce a flare than simple sunspot groups. However, as seen in this analysis, the small sunspot groups are more prevalent than the large sunspot groups. Therefore, cumulative probability of flaring taking care of size and relative number of sunspot groups should be compared with solar activity proxies, such as F10.7, for developing a more effective indicator of solar activities.