Gamma-ray bursts (GRBs) are cosmic explosions, which are extremely energetic events occurring in a very short time, and produce highly diverse light curves. GRBs form two distinct populations: the short and long GRBs, defined on the basis of the burst duration (Kouveliotou et al. 1993). Short GRBs are distinguished from long GRBs not only by their duration, but also by various observed properties. For instance, as opposed to long GRBs, for which the isotropic equivalent gamma-ray energy is of the order of 1053 erg and for which the host galaxies are typically dwarf galaxies with high star formation rate (Chang 2006, Fruchter et al. 2006, Savaglio et al. 2009), short GRBs are typically less energetic (of the order of 1049-1051erg) and occur in both early- and late-type galaxies (Nakar 2007, Berger 2009, 2011). Negligible spectral lag and hard spectra are also common for short GRBs.
Several empirical correlations between various properties of the light curves in prompt gamma-ray emissions and GRB energetics have been discovered. Fenimore & Ramirez-Ruiz (2000) have found that variable GRBs are much brighter than the smoother ones. Reichart et al. (2001) present a Cepheid-like luminosity estimator based on their finding that the isotropic equivalent peak luminosities positively correlate with a rigorously constructed measure of the variability. Long GRBs with spectroscopically measured redshifts show a correlation between the total isotropic energy and the peak energy of their spectrum (Amati et al. 2002), which is later confirmed with the collimated jet model (Ghirlanda et al. 2004). Yonetoku et al. (2004) have established a relation between the spectral peak energy (
There is another relation which calls for a physical interpretation (Dermer 1998, Ioka & Nakamura 2001). That is, the spectral time lag has been shown to correlates with the isotropic peak luminosity for long duration bursts (Norris et al. 2000, Norris 2002, Gehrels et al. 2006, Schaefer 2007, Hakkila et al. 2008, Ukwatta et al. 2011). Spectral lag is defined as the difference in time of arrival of high and low energy photons. Recently, Margutti et al. (2010) investigated spectral lags of X-ray flares and found that X-ray flares of long GRBs also exhibit the lag-luminosity correlation observed in the prompt emission. Most of the previous investigations, however, used lags extracted in the observer-frame only until Ukwatta et al. (2010, 2012) have recently presented an analysis of the lag-luminosity relation in the GRB source frame based on a sample of
In this study, we revisit the analysis of Ukwatta et al. (2012) using the collimation-corrected peak luminosity instead of the isotropic one, in order to check if the jet model may conform the relation or even yield a more robust correlation. The compactness problem requires that GRBs are relativistic sources. From this argument lower limits of bulk Lorentz factor Γ0 of the fireball are usually derived greater than of order of 100 (Lithwick & Sari 2001). Large Lorentz factors imply strong beaming of the radiation, i.e., relativistic Doppler beaming effect. The observational evidence supporting this idea is the achromatic break of the afterglow light curve, which declines more steeply than in the spherical case (Rhoads 1997, Sari et al. 1999, Panaitescu & Kumar 2001, Frail et al. 2003). The possibility that GRB fireballs are collimated was first proposed for GRB 970508 (Waxman et al. 1998). Hence, if this is the case, it seems natural that the jet should play a crucial role in determining such a relation.
To tackle this issue, we study here two cases of Γ0 estimated from the shape of the light curve in two different density profiles, i.e., homogeneous inter-stellar medium (ISM) and varying ISM in density. Generically, a circumburst density profile is described by
2. SPECTRAL LAG IN THE SOURCE FRAME AND DATA
The observed spectral lag is extracted between two arbitrary energy bands in the observer frame in the first place. There are three well known ways of extracting spectral lags: pulse peak-fit method (Norris et al. 2005, Hakkila et al. 2008), Fourier analysis method (Li et al. 2004), and cross-correlation function analysis method (Cheng et al. 1995, Band 1997). These two energy bands can correspond to a different pair of energy bands in the GRB source frame due to the cosmological redshift. Therefore, two corrections are required: 1) correct for the time dilation effect by multiplying the extracted lag value (in the observer frame) by (1 +
In this paper we present a study of spectral lags using a subset of
Sample of GRBs.
density profile (W). We have searched in the literature for this criterion and taken them from Ghirlanda et al. (2012). For spectral lags, thirdly, we have taken data of GRBs from Ukwatta et al. (2010, 2012). Finally, we only choose GRBs whose spectral lag is positive, i.e., only those in whose light curves the high-energy photons arrive earlier than the low energy ones.
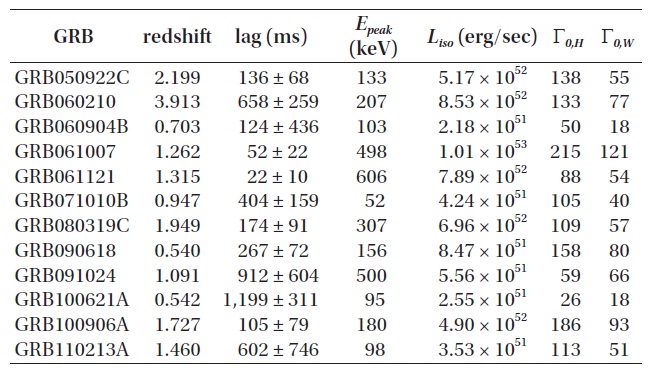
The spectral information for the 12 bursts used in this paper is given in Table 1. Columns 1 and 2 show the GRB name and its redshift, column 3 the extracted spectral lags in ms, column 4 the rest frame peak energy
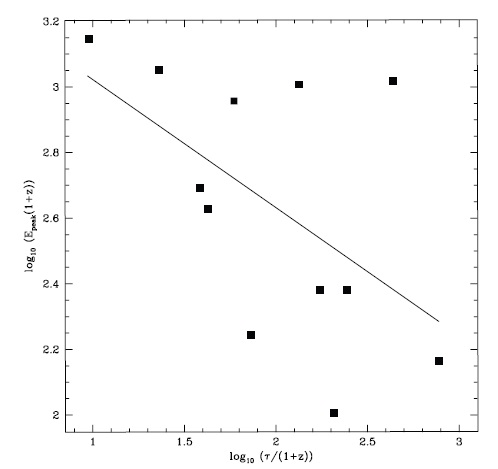
In Fig. 1, we show the source-frame peak energy
[Table 2.] Correlation coefficients of the lag - Epeak relation.
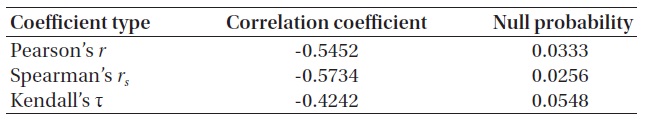
Correlation coefficients of the lag - Epeak relation.
0.19. For comparison with results of Ukwatta et al. (2012), they reported the Pearson’s coefficient of -0.57 ± 0.14 for the 43 long GRBs, which can be considered as a parent sample of ours. We provide various correlation coefficient of the relations with null probabilities in Table 2.
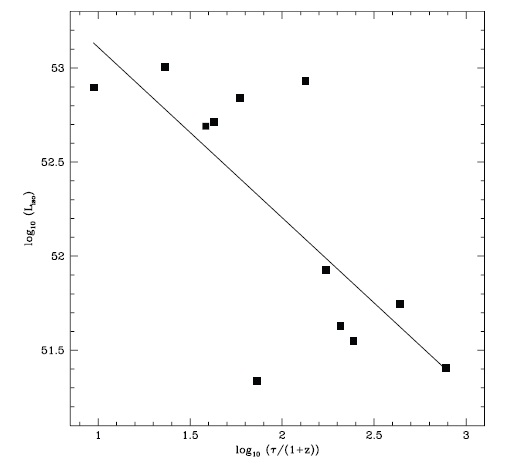
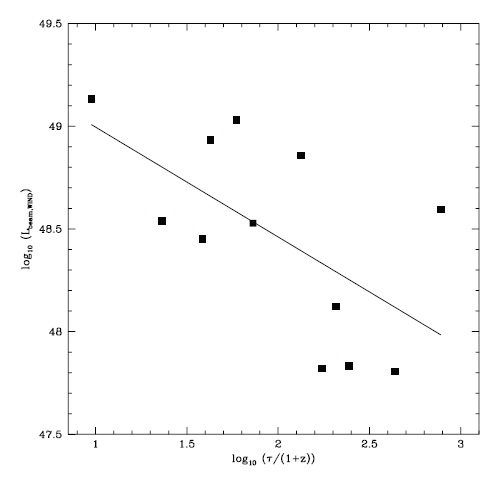
In Fig. 2, we show the source-frame isotropic peak luminosity Liso versus spectral lag in log-log plot. The straight line is the best-fit of data. The Pearson’s correlation coefficient for this relation is -0.75 with a null hypothesis
[Table 3.] Correlation coefficients of the lag - Liso relation.
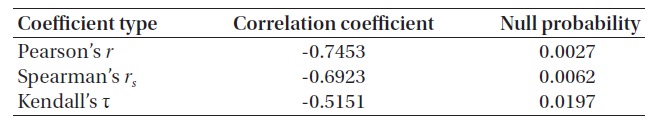
Correlation coefficients of the lag - Liso relation.
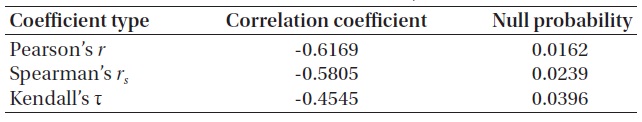
[Table 4.] Correlation coefficients of the lag - L0,H relation.

Correlation coefficients of the lag - L0,H relation.
[Table 5.] Correlation coefficients of the lag - L0,W relation
Correlation coefficients of the lag - L0,W relation
probability of being uncorrelated of 0.0027 (for the correlation coefficients, e.g., see Press et al. [1992]). The best-fit power-law index is -0.91 ± 0.26. The extracted correlation coefficient is compatible with the correlation coefficient of -0.82 ± 0.05 reported in Ukwatta et al. (2012). According to Figs. 1 and 2 we consider our sample is hardly biased, even though GRBs are selected according to the criteria we provided in the last section. Various correlation coefficient of the relations with null probabilities are provided in Table 3.
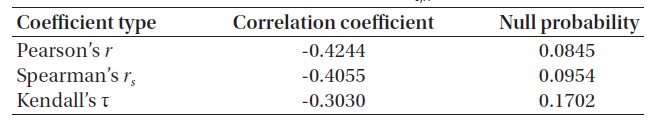
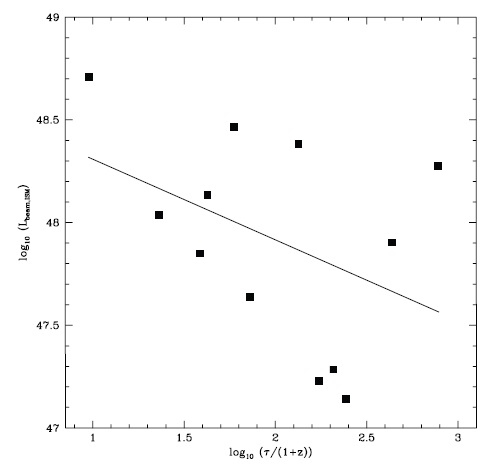
In Figs. 3 and 4, we show the source-frame peak luminosity
using Γ0,H and Γ0,w in Table 1. The straight lines are the best-fits of data. The Pearson’s correlation coefficients for these relations are -0.42 and -0.61 with chance probabilities of 0.08 and 0.001, respectively. The best-fit power-law indices are -0.39 ± 0.26 and -0.53 ± 0.21, respectively. We provide various correlation coefficients of the relation with null probabilities in Tables 4 and 5. We find that the collimation-corrected luminosity correlates in a similar way with spectral lag, except that the correlations are somewhat less tight. The correlation in the wind density profile seems to agree with the isotropic peak luminosity case better than in the homogeneous case. There are two important changes in the lag-luminosity relation which may occur when going from isotropic energy to collimated energy in the source frame, i.e., a change in the powerlaw index, and a change in the correlation coefficient. This correlation can shed light on the still uncertain radiation processes for the prompt GRB emission (Nava et al. 2006).
Using a sample of 43
We have found that our sample is hardly biased, since correlation coefficients for the relation between the source-frame peak luminosity