검색 전체 메뉴
PDF
맨 위로
OA 학술지
Ecological responses of natural and planted forests to thinning in southeastern Korea: a chronosequence study
  • 비영리 CC BY-NC
  • 비영리 CC BY-NC
ABSTRACT
Ecological responses of natural and planted forests to thinning in southeastern Korea: a chronosequence study
KEYWORD
Alnus firma , broadleaved forest , disturbance , Quercus serrata , resilience , succession , thinning , understory vegetation
  • INTRODUCTION

    In Korea, forest tending works (thinning) for natural and planted forests have been conducted on a broad scale after International Monetary Fund (IMF) financial sup-port (Woo 2003). In this operation, canopy compositors (as the dominant species) are partially removed (by visu-ally selecting healthy or degrading individuals), and sub-canopy and shrub layer species are eliminated to improve growth of target species and environmental factors such as water retention capacity and soil physical properties. Canopy openness remained at 50-80% compared with the pre-thinned state (Korea Forest Service instruction No. 890). Thus, structural and environmental changes due to thinning are smaller than to clear cutting.

    Management activities (clear cutting, thinning and so on) in forest ecosystems are broadly applied in most nations. Tremendous disturbances such as clear-cutting usually alter the structure and function of forest commu-nities. As a result, various successional stages commonly appear. Thinning also changes understory vegetation indirectly by modifying overstory openness and density and their effects on understory microclimate, light, and soil water (Dodson et al. 2008, Jung et al. 2008). In addi-tion, thinning may result in higher availability of water and mineral nutrients through the formation of root gaps (Parsons et al. 1994) and increased competitive perfor-mance of residual or invaded species. In managed forest ecosystems, residual species and rapidly establishing in-vaders are primary contributors to secondary succession after disturbances (logging) (Halpern 1988, 1989).

    Forest operations result in various responses of plant communities, such as increasing (Metlen and Fiedler 2006, Dodson et al. 2008), decreasing (Metlen et al. 2004, Fule et al. 2005) species richness or neutral response (Nel-son et al. 2008). Responses of species cover also varied among functional types, suggesting differences in toler-ance or resilience to disturbances (Halpern 1988, Metlen et al. 2004, Metlen and Fiedler 2006, Moore et al. 2006). In understory vegetation, various consequences of second-ary succession after forest management are predictable, but the emerging patterns and pathways of disturbed for-ests are not yet clarified in natural and planted forests in Korea.

    Communities may be considered stable if these path-ways, after management activities, result in a return to the initial composition within an appropriate time scale (Sutherland 1981). In this perspective, understory com-munities play a central role in the dynamics and func-tioning of forest ecosystems by influencing long-term patterns of vegetation development (D’Amato et al. 2009). Understory vegetation is also a critical component of for-est ecosystems, typically supporting the vast majority of components of total ecosystem floristic diversity (Halp-ern and Spies 1995, Thomas et al. 1999, D’Amato et al. 2009).

    As was mentioned above, the effects of forest manage-ment practices in Korea such as clear cutting and thin-ning on species diversity and composition have not been understood sufficiently (but see Cho et al. 2011). This insufficiency and lack of basic information reflects the paucity of community-level studies in natural and man-aged stands. Combined with emerging principles in the landscape and in restoration ecology of natural or man-aged ecosystems, changes in the society’s conceptions of a broader range or monotonous forest management op-tions are causing a reassessment of forestry practices. For-est and natural resource managers are making an effort to balance economical and ecological values of the forest by applying alternative models of forest management. In this viewpoint, the introduction and founding of manage-ment and operation options and policies surely require a fundamental understanding of vegetation processes and conceptual models that can predict responses to pertur-bations in target systems.

    The chronosequence approach to study vegetation dy-namics has been validated (Foster and Tilman 2000), and has provided significant insights into the patterns and mechanisms of plant succession (e.g., Inouye et al. 1987, Pickett 1989, Lee et al. 2002, 2008, Lee 2006a, 2006b, Hau-go and Halpern 2007, Cho et al. 2011). The present study aims to clarify how management activity influences com-munity resistance and resilience. In order to arrive at this goal, we analyzed successional patterns and trajectories (pathways) of understory vegetation and abiotic variables (light availability, woody debris and litter fall) by applying a chronosequence approach after forest thinning in natu-ral and planted broadleaved forests.

    MATERIALS AND METHODS

      >  Study area

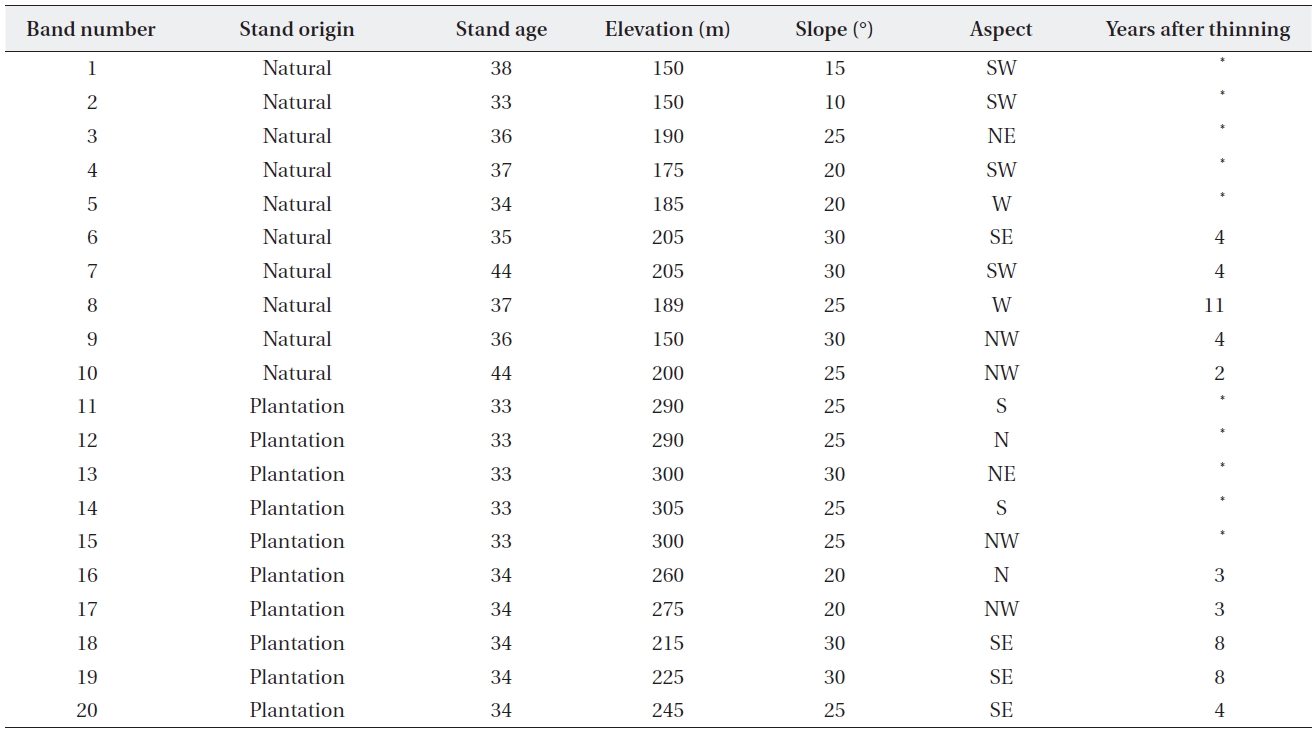
    The study sites were located in rural areas in Pohang-si, Gyeongsangbuk-do, southeastern Korea. The altitudinal distributions of sites were between 150-305 m above sea level (Table 1). The study area is classified as a warm-tem-perate deciduous broad-leaved forest (such as Quercus serrate forest) zone (Lee et al. 1996, Kim and Lee 2006). In this area, the lowland is occupied by oak and artificial (A. firma, Robinia pseudoacacia, Pinus thunbergii, and P. rigi-da) forests. Most plantations in this area were introduced through a large scale forest restoration project called in the Yeongil erosion control project, in the early 1970s. For natural and restored stands, forest-tending works (thin-ning) to improve resource quality in lowland forests have been practiced from 1998 to date.

    Soils were shallow, sandy loams and loams derived from mudstone and shale on the tertiary deposit in the Cenozoic Era based on digital detailed soil maps pub-lished by the Rural Development Administration. Annual mean temperature and precipitation (1971-2007) ob-tained from the Pohang-si weather station, the closest to this study area, were 14.0°C and 1,166.8 mm, respectively.

    We explored the study area in a vegetation survey and selected 10 stands in the natural broadleaved forest (dom-inated by Q. serrata). After the field survey, we verified that the stands selected were young vegetation in the early 1970s through orthogonal image interpretation (taken in the early 1970s). Among them, 5 stands remained in their natural state without any treatment; the others were man-aged (by thinning). In five managed stands, we confirmed the years lapsed after the operation (one 11 year stand; three 4 year stands; one 2 year stand) by counting the age of stems sprouted from the cut stump (Table 1). Natural Q. serrata stands were mainly composed of Carpinus laxi-flora in the canopy layer, Acer pseudosieboldianum and Lindera erythrocarpa in the subtree layer, Rhododendron schlippenbachii, L. obtusiloba, and Viburnum erosum in the shrub layer, and Disporum smilacinum, Carex humi-lis, Carex gifuensis, and Ainsliaea acerifolia in the herba-ceous layer.

    For rehabilitated stands, a total of 10 stands were se-lected in A. firma stands, which were introduced through the Yeongil erosion control project. Management history was checked by the same processes as those used for the natural forest. Among 10 A. firma stands, 5 remained in the natural state after planting. Managed stands were composed of two 3 year stands, two 8 year stands, and one 4 year stand. Unmanaged A. firma stands were composed of Q. serrata and C. laxiflora in the canopy layer, Sorbus alnifolia A. pseudosieboldianum and L. erythrocarpa in the subtree layer, R. schlippenbachii, L. obtusiloba, and V. erosum in the shrub layer, and Oplismenus undulatifolius, Disporum smilacinum, and Parthenocissus tricuspidata

    [Table 1.] General environmental features of 20 vegetation survey sites

    label

    General environmental features of 20 vegetation survey sites

    in the herbaceous layer.

      >  Vegetation and abiotic variables sampling

    Vegetation sampling was conducted from August to September 2008. In selected stands, a 50 m line transect was installed parallel with the contour and was > 30 m from all stand edges. The transect was consisted of five plots (5 m × 5 m) spaced at 5 m intervals and 10 subplots (1 m × 1 m). Within each plot (1-2 m in height) and sub-plot (< 1 m in height), coverage (%) of all vascular species was recorded. Coverage of litter and woody debris was also determined in subplots. The age of each stand was estimated by counting tree rings from annual ring cores for the biggest tree species in the plot. Mean ages of Q. serrata and A. firma forests were 36 and 34 years, respec-tively. Samples of unmanaged natural (Q. serrata) and re-stored (A. firma) stands were used as a control (or refer-ence, or pre-disturbed) state in this study.

    In order to estimate light availability and canopy open-ness (%), we took digital hemispherical photographs at each subplot from a height of 1.8 m using a Nikon D80 digital camera (Sendai, Japan) with Sigma 4.5mm F2.8 EX DC Circular Fisheye HSM lens (Fukushima, Japan). Pictures were taken on uniformly overcast days to avoid direct sunlight. Total transmitted light or photosynthetic photon flux density (mol m-2 day-1) averaged over a year was calculated with Gap Light Analyzer 2.0 (Mansfield, CT, USA) employing the standard overcast sky model (Frazer et al. 1999, Haugo and Halpern 2007).

      >  Statistical analyses

    Functional types such as growth form and life trait (or habitat affinity) are often used to generalize species’ per-formance (Smith et al. 1987). To compare regeneration patterns after thinning, each species recorded was classi-fied into five growth forms, i.e., tree, shrub, forb (includ-ing ferns), graminoid and vine, and mean numbers and coverage of each form to samples of focal successional stage were calculated. Average coverage of litter and wood debris (WD), and light availability were also computed for each successional stage. In addition, in order to assess species diversity, a Shannon index (H′) was calculated for each successional stage (Magurran 2003).

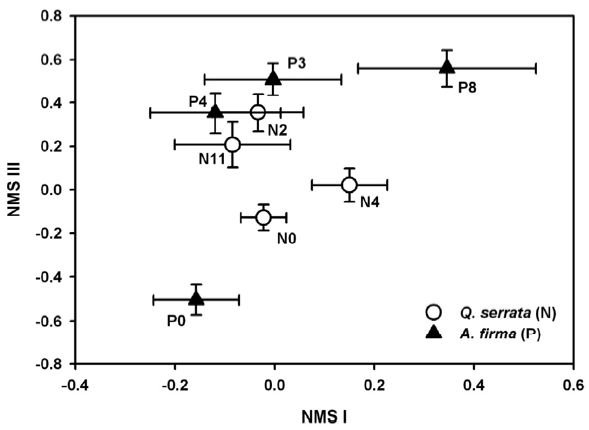
    To analyze successional pathways of stands, the impor-tance value of each life form in each subplot was calculat-ed. The values were determined by multiplying 100 by the fractional value of each life form to the summed values of all functional types in each subplot. Then, a matrix of importance values for life forms was constructed and that data were fed to ordination analysis. We used Nonmetric Multidimensional Scaling (NMS) (Kruskal 1964) ordina-tion to examine differences in successional pathways due to management activities in the understory of natural and planted stands. NMS ordination was performed us-ing Søresen’s distance measure and we selected the “slow and thorough” autopilot of PC-ORD ver. 4.0 (MjM Soft-ware, Oregon, USA) conducting 40 runs that yield one to six dimensional solutions (McCune and Mefford 1999). A Monte Carlo test was performed to compare the stress of randomized data (McCune and Grace 2002). In the re-sult of NMS ordination, the minimum stress configura-tion included three axes, but the two axes accounting for the most variability in the original data set are presented (NMS I as 22.2% and NMS III as 34.7%). SPSS ver. 15.0 (SPSS Inc., Chicago, IL, USA) and PC-ORD ver. 4.2 (Mc-Cune and Mefford 1999) were applied to univariate and multivariate analyses, respectively.

    RESULTS

      >  Changes in abiotic environments

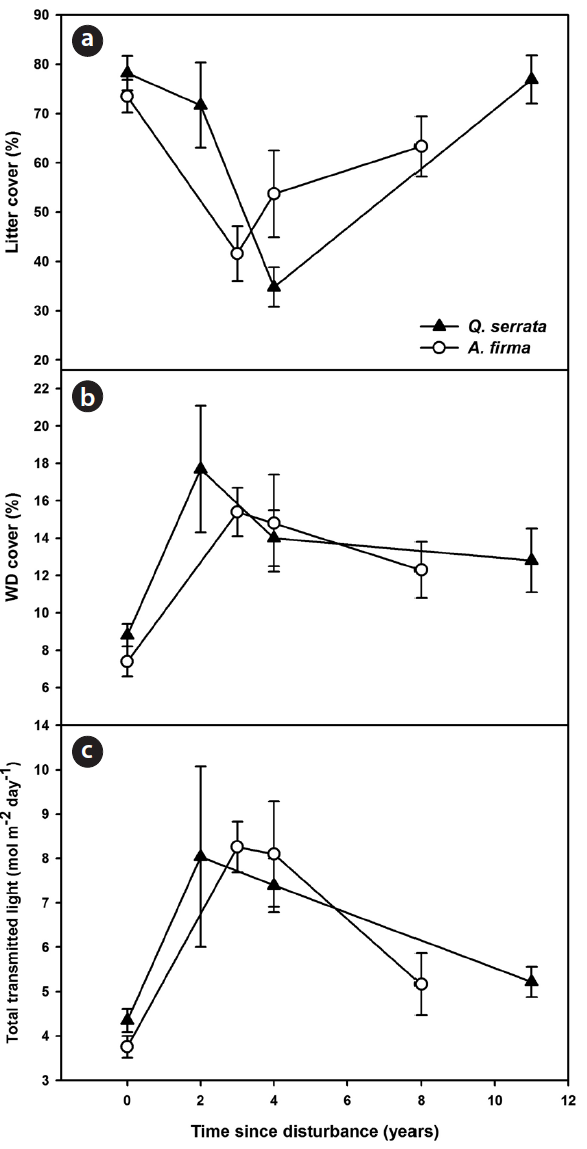
    Canopy conditions (estimated light availability) and ground conditions (coverage of litter and WD cover) changed dramatically in the earlier stages after thinning, and as years passed, means of environmental variables gradually approached the control state (Fig. 1). Coverage of litter decreased immediately after thinning and then approached a reference state with the passage of time in both Q. serrata and A. firma stands (Fig. 1a). Immediately after thinning, there were big changes in transmitted light (from 4.3 mol m-2 day-1 to 8 mol m-2 day-1) and in coverage of WD (from 8.8% to 17.7%) in Q. serrata stands; the trend was the same for A. firma stands (Fig. 1b and 1c).

      >  Regeneration trajectory

    Ordination results explained 56.9 % of the variation in the raw data (final stress = 17.3, final instability = 0.0297). NMS ordination of subplots was expressed in mean (± standard error) of successional stages (Fig. 2). Variation in vegetation among successional stages was explained by NMS I (22.2%), which represented a gradient from sites with higher coverage of vine species in the negative pro-portion of the NMS I to those with higher scores of tree species in the positive portion. The arrangement of sam-ples along NMS III, which explained 34.7 % of the varia-tion, ranged from sites with higher coverage of graminoids to sites with higher cover of tree species. NMS ordination revealed different successional trajectories depending on forest type. Understory composition of natural stands (Q. serrata) gradually approached reference values (N0), but pathways in planted stands (A. firma) differed from natu-ral ones as P8 samples were distributed far away from P0 samples.

      >  Changes in species diversity and abundance

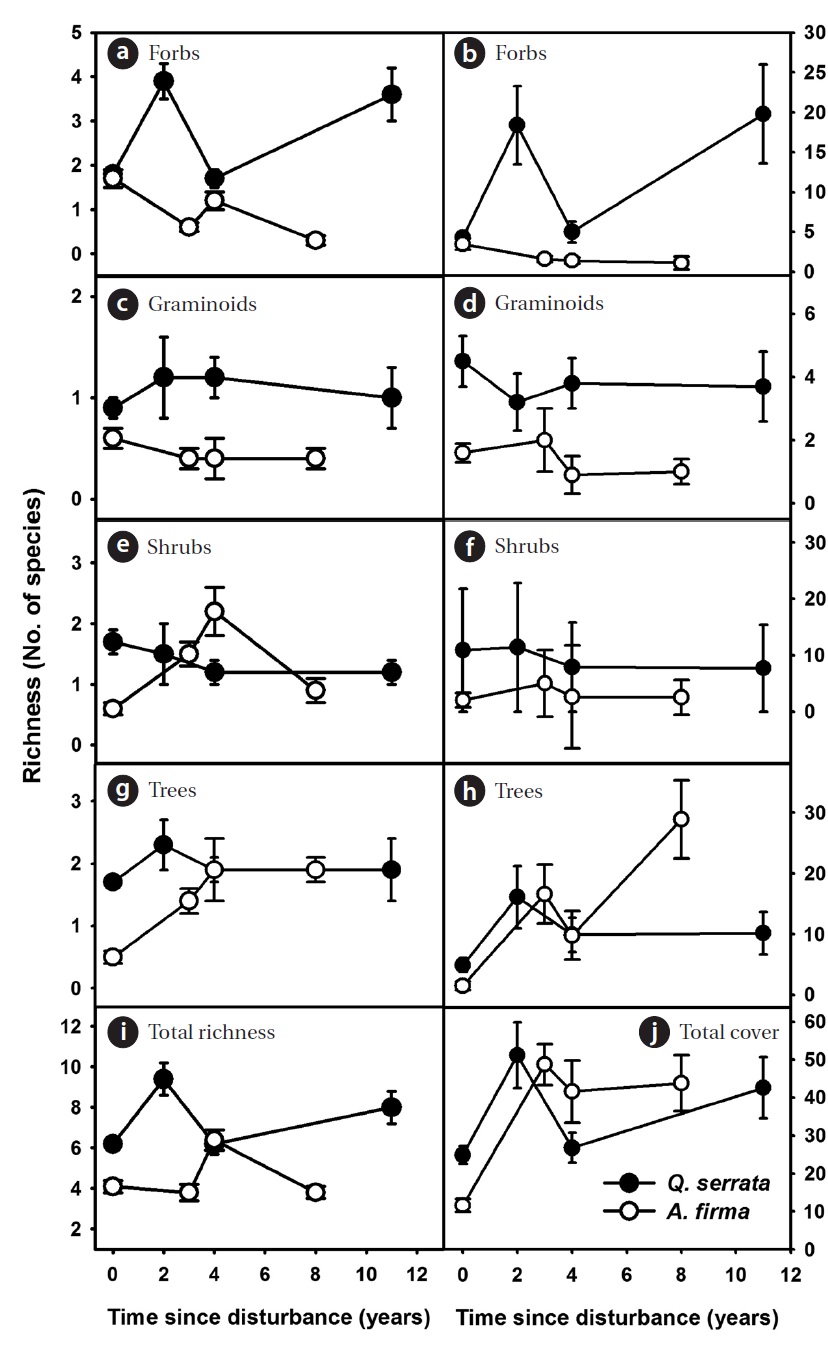
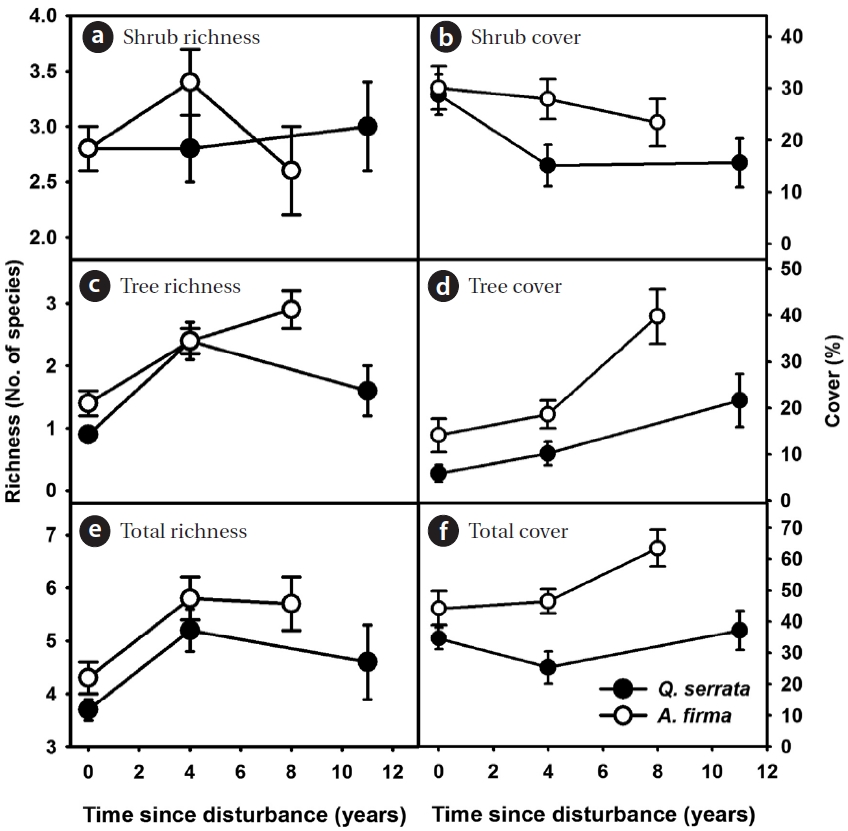
    In the shrub layer, the increase in overall richness was limited after thinning (see scale of y axes, Figs. 3a, 3c, and 3e). The change in total coverage was affected largely by

    the gradual increase of tree species and the decrease of shrubs (Figs. 3b, 3d, and 3f). A limited gain in species rich-ness after thinning was observed in ground vegetation (Figs. 4a, 4c, 4e, 4g, and 4i). Vine species were excluded from analysis because of too little richness and coverage. In Q. serrata stands, the increase in total richness after thinning was mainly due to an increase in forb species. In A. firma stands, woody (tree and shrub) species slightly increased in cover after thinning. Changes in the diversity index (H′) in natural and planted forests were similar to changes in total species richness and there were limited changes in diversity that ranged from 1.4 to 1.7 in the Q. serrata forest and from 0.8 to 1.1 in the A. firma forest (Fig. 5).

    Overall, total coverage of ground vegetation increased after thinning (Figs. 4b, 4d, 4f, 4h, and 4j). Peak coverage of ground communities appeared during earlier stages in both Q. serrata and A. firma stands, after then decreased

    and gained again. In Q. serrata forests, the increase in total coverage was mainly due to forb species and, in A. firma stands, tree species usually contributed to increases in the coverage of ground vegetation.

    DISCUSSION

    We applied a chronosequence approach to illustrate community resilience and resistance to a thinning distur-bance by showing the patterns (changes in species rich-ness and abundance) and pathways of Q. serrata and A. firma stands. Halpern and Spies (1995) noted that forest management effects can be grouped into two broad cat-egories: 1) initial effects of disturbances associated with logging and site preparation, and 2) effects of subsequent activities (e.g., brush cutting and mowing) that directly or indirectly alter rates or patterns of succession. In our study, subsequent forest activities after forest operation were not observed. Thus, our results showed only earlier sequences in understory regeneration in lowland natu-ral and planted broadleaved forests in Korea. To acquire more explanatory ecological information on various for-ests in different successional stages, longer-term static observations are strongly recommended.

    Tending works brought various changes in forest struc-ture and ground environments. Release of tree density resulted in alteration of light and nutrient products such as decrease of litter fall (Jung et al. 2008). Coverage of ground litter decreased in earlier stages and more than 10 years were required to restore the normal state in both forests (Fig. 1). Increases in ground woody debris in earlier stages are likely due to tree felling operations. Decreases in woody debris in later stages were due to decomposition and reduction of debris production. In addition, loss of rainfall interception because of thinning (Jung et al. 2008) may increase runoff and consequently, by wash away, can affect the amount of litter and woody debris in forests.

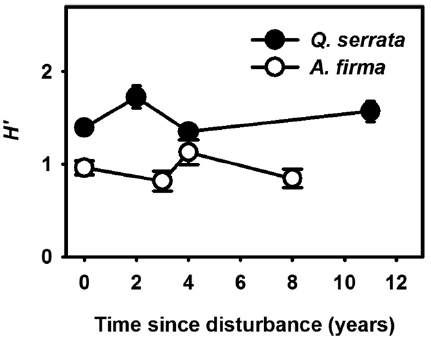
    After thinning, species richness and diversity increased in earlier stages (within 4 years) but the magnitude was relatively limited in both Q. serrata and A. firma stands (Figs. 3-5). Because the disturbance intensity was low (maintaining canopy openness at > 50 %), increments of resources (such as light and water) required to cause species invasion was likely limited. Thinning operations at least do not reduce species diversity because residual species persistence and performance are better (Dodson et al. 2008). A gradual increase of tree cover in the shrub layer and a limited invasion of alien species such as Bidens frondosa, support our interpretation. Recorded invasive and ruderal species entry due to increments in available resources such as light, water and nutrients was rarely observed in either natural or planted forests. B. frondosa, a ruderal exotic and an annual species, and Oplismenus undulatifolius, a ruderal and perennial species, were re-corded in thinned Q. serrata stands.

    In herbaceous vegetation, forb species, which contrib-uted largely to increases in richness and total cover in natural stands, are likely able to take advantage of distur-bances in earlier stages. Different patterns of richness and coverage between natural and restored stands are largely explained by domino effects of thinning on A. firma indi-viduals as early successional species planted during the Yeoung-il restoration project period (1972-1977). In a field survey of the managed A. firma stands, uncut A. firma individuals were frequently observed in snapped-off or standing dead states (although we did not check quanti-tatively). This result would be due to short longevity of A. firma. Such a decline in alder species in the canopy layer after thinning can cause additional disturbances on un-derstory composition and structure, light and nutrient availability, soil water and so on.

    Community stability (or persistence) may simply re-flect the ability of resident species to resist change, or if altered by disturbances, their ability to readjust or re-cover (Halpern 1988). Different regeneration trajectories of functional type composition between stands reflect the variety of species group responses to disturbances. In addition, resistance and resilience varied between plant communities, and were likely better for natural stands and lower for plantation. The recovery pattern of the un-derstory of Q. serrata stands, as they returned towards the pre-disturbance state, shows higher community stabil-ity or resilience to thinning disturbances (Fig. 2). As was mentioned above, vulnerability of early successional spe-cies, A. firma to disturbance affected compositional prop-erties of understory of plantation, as travel toward alter-native stable state.

참고문헌
  • 1. Cho YC, Kim JS, Lee CS, Cho HJ, Lee HY, Bae KH 2011 Early successional change of vegetation composition after clear cutting in Pinus densiflora stands in Southern Gangwon Province. [J Korean For Soc] Vol.100 P.240-245 google
  • 2. D’Amato AW, Orwig DA, Foster DR 2009 Understory vegeta-tion in old-growth and second-growth Tsuga canadensis forests in western Massachusetts. [For Ecol Manage] Vol.257 P.1043-1052 google cross ref
  • 3. Dodson EK, Peterson DW, Harrod RJ 2008 Understory veg-etation response to thinning and burning restoration treatments in dry conifer forests of the eastern Ca-scades, USA. [For Ecol Manage] Vol.255 P.3130-3140 google cross ref
  • 4. Foster BL, Tilman D 2000 Dynamic and static views of suc-cession: testing the descriptive power of the chronose-quence approach. [Plant Ecol] Vol.146 P.1-10 google cross ref
  • 5. Frazer GW, Canham CD, Lertzman KP 1999 Gap Light Ana-lyzer (GLA), Version 2.0: Imaging Software to Extract Canopy Structure and Gap Light Transmission Indices from True-Colour Fisheye Photographs, Users Manual and Program Documentation. google
  • 6. Fule PZ, Laughlin DC, Covington WW 2005 Pine-oak forest dynamics five years after ecological restoration treat-ments, Arizona, USA. [Forest Ecol Manage] Vol.218 P.129-145 google cross ref
  • 7. Halpern CB 1988 Early successional pathways and the resistance and re-silience of forest communities. [Ecology] Vol.69 P.1703-1715 google cross ref
  • 8. Halpern CB 1989 Early successional patterns of forest spe-cies: interactions of life history traits and disturbance. [Ecology] Vol.70 P.704-720 google cross ref
  • 9. Halpern CB, Spies TA 1995 Plant species diversity in natural and managed forests of the Pacific Northwest. [Ecol Appl] Vol.5 P.913-934 google cross ref
  • 10. Haugo RD, Halpern CB 2007 Vegetation responses to co-nifer encroachment in a western Cascade meadow: a chronosequence approach. [Can J Bot] Vol.85 P.285-298 google cross ref
  • 11. Inouye RS, Huntly NJ, Tilman D, Tester JR, Stillwell M, Zin-nel KC 1987 Old-field succession on a Minnesota sand plain. [Ecology] Vol.68 P.12-26 google cross ref
  • 12. Jung MH, Lee DK, Um TW, Kim YS, Kwon KC, Jung KH 2008 Effects of thinning on nutrient input by rainfall and lit-terfall in natural hardwood forest at Mt. Joongwang, Gangwon-do. [Korean J Soil Sci Fertil] Vol.41 P.1-8 google
  • 13. Kim JW, Lee YK 2006 Classification and Assessment of Plant Communities. google
  • 14. Kruskal JB 1964 Nonmetric multidimensional scaling: a nu-merical method. [Psychometrika] Vol.29 P.115-129 google cross ref
  • 15. Lee CS, You YH, Robinson GR 2002 Secondary succession and natural habitat restoration in abandoned rice fields of central Korea. [Restor Ecol] Vol.10 P.306-314 google cross ref
  • 16. Lee KS 2006a Changes of species diversity and development of vegetation structure during abandoned field succes-sion after shifting cultivation in Korea. [J Ecol Field Biol] Vol.29 P.227-235 google cross ref
  • 17. Lee KS 2006b Changes of biomass, net primary productivity and P/B ratio during abandoned field succession after shifting cultivation in Korea. [J Ecol Field Biol] Vol.29 P.237-245 google cross ref
  • 18. Lee KS, Lee BC, Shin JH 1996 Classification of forest vegeta-tion zone over southern part of Korean Peninsula using geographic information systems. [Korean J Ecol] Vol.19 P.465-476 google
  • 19. Lee SM, Cho YC, Shin HC, Oh WS, Seol ES, Park SA, Lee CS 2008 Successional changes in seed banks in abandoned rice fields in Gwangneung Central Korea. [J Ecol Field Biol] Vol.32 P.269-276 google
  • 20. Magurran AE 2003 Measuring Biological Diversity. google
  • 21. McCune B, Grace JB 2002 Analysis of Ecological Communi-ties. google
  • 22. McCune B, Mefford MJ 1999 PC-ORD. Version 4.0. Multi-variate Analysis of Ecological Data. google
  • 23. Metlen KL, Fiedler CE 2006 Restoration treatment effects on the understory of ponderosa pine/Douglas-fir forests in western Montana, USA. [For Ecol Manage] Vol.222 P.355-369 google cross ref
  • 24. Metlen KL, Fiedler CE, Youngblood A 2004 Understory re-sponse to fuel reduction treatments in the Blue Moun-tains of northeastern Oregon. [Northwest Sci] Vol.78 P.175-185 google
  • 25. Moore MM, Casey CA, Bakker JD, Springer JD, Fule PZ, Cov-ington WW, Laughlin DC 2006 Herbaceous vegetation responses (1992-2004) to restoration treatments in pon-derosa pine forest. [Rangeland Ecol Manage] Vol.59 P.135-144 google cross ref
  • 26. Nelson CR, Halpern CB, Agee JK 2008 Thinning and burn-ing result in low-level invasion of nonnative plants but neutral effects on natives. [Ecol Appl] Vol.18 P.762-770 google cross ref
  • 27. Parsons WFJ, Knight DH, Miller SL 1994 Root gap dynam-ics in lodgepole pine forest: nitrogen transformations in gaps of different size. [Ecol Appl] Vol.4 P.354-362 google cross ref
  • 28. Pickett STA, Likens GE 1989 Space for time substitution as an alterna-tive to long-term studies. In: Long-term Studies in Ecol-ogy: Approaches and Alternatives P.71-88 google
  • 29. Smith TM, Shugart HH, Woodward FI 1987 Plant Func-tional Types: Their Relevance to Ecosystem Properties and Global Change. google
  • 30. Sutherland JP 1981 The fouling community at Beaufort, North Carolina: a study in stability. [Am Nat] Vol.118 P.499-519 google cross ref
  • 31. Thomas SC, Halpern CB, Falk DA, Liguori DA, Austin KA 1999 Plant diversity in managed forests: understory re-sponses to thinning and fertilization. [Ecol Appl] Vol.9 P.864-879 google cross ref
  • 32. Woo BM 2003 Achievements of the forest-tending works by national movement of the forest for life under the IMF Structural Adjustment Program in Korea. [J Korean For Soc] Vol.92 P.145-151 google
OAK XML 통계
이미지 / 테이블
  • [ Table 1. ]  General environmental features of 20 vegetation survey sites
    General environmental features of 20 vegetation survey sites
  • [ Fig. 1. ]  (a-c) Changes in mean coverage of litter and woody debris (WD) and transmitted light as a function of the lapse of time after thinning in the study area. Vertical bars in the diagram represent mean ± standard error. Q. serrata, Quercus serrata; A. firma, Alnus firma.
    (a-c) Changes in mean coverage of litter and woody debris (WD) and transmitted light as a function of the lapse of time after thinning in the study area. Vertical bars in the diagram represent mean ± standard error. Q. serrata, Quercus serrata; A. firma, Alnus firma.
  • [ Fig. 2. ]  Nonmetric Multidimensional Scaling (NMS) ordination based on ground cover of functional types (growth form) of natural (Quercus ser-rata) and planted (Alnus firma) stands. NMS I and NMS III accounted for 22.2% and 34.7% of the variation in composition of functional types, re-spectively, resulting in a cumulative 56.9% variation in composition. Num-bers after letters (N and P) indicate years since management operation. Q. serrata, Quercus serrata; A. firma, Alnus firma N, natural; P, planted.
    Nonmetric Multidimensional Scaling (NMS) ordination based on ground cover of functional types (growth form) of natural (Quercus ser-rata) and planted (Alnus firma) stands. NMS I and NMS III accounted for 22.2% and 34.7% of the variation in composition of functional types, re-spectively, resulting in a cumulative 56.9% variation in composition. Num-bers after letters (N and P) indicate years since management operation. Q. serrata, Quercus serrata; A. firma, Alnus firma N, natural; P, planted.
  • [ Fig. 3. ]  (a-f) Changes in mean species richness and coverage of shrub layer species with the lapse of time after thinning in natural (Quercus serrata) and planted (Alnus firma) stands.
    (a-f) Changes in mean species richness and coverage of shrub layer species with the lapse of time after thinning in natural (Quercus serrata) and planted (Alnus firma) stands.
  • [ Fig. 4. ]  (a-j) Changes in mean species richness and coverage of ground layer species over time after thinning in natural (Quercus serrata) and planted (Alnus firma) stands.
    (a-j) Changes in mean species richness and coverage of ground layer species over time after thinning in natural (Quercus serrata) and planted (Alnus firma) stands.
  • [ Fig. 5. ]  Changes in the Shannon index (H′) with the lapse of time after thinning in natural (Quercus serrata) and planted (Alnus firma) stands.
    Changes in the Shannon index (H′) with the lapse of time after thinning in natural (Quercus serrata) and planted (Alnus firma) stands.
(우)06579 서울시 서초구 반포대로 201(반포동)
Tel. 02-537-6389 | Fax. 02-590-0571 | 문의 : oak2014@korea.kr
Copyright(c) National Library of Korea. All rights reserved.