Particles dispersed in the air are referred to as aero-sols. While it is difficult to detect bacteria and viruses in aerosols, it is relatively easy to detect algae, leaf hairs, seeds, plant fragments, and pollen (Knox 1979). Aerosols are under the control of atmospheric conditions, and are normally carried across short distances; however, ascend-ing air currents can carry aerosols much farther (Nilsson 1973). Pollen is a type of aerosol that may induce an al-lergic response (i.e., pollinosis) in susceptible humans (D’Amato et al. 2007). One representative characteristic of pollinosis is seasonality of symptoms, which means that this disease occurs at the same time every year (D’Amato et al. 1998). Furthermore, symptoms are aggravated in a manner directly proportional to an increase in airborne pollen concentration (Oh et al. 2006, Agashe and Caulton 2009).
The study of pollinosis in Korea started with Joo (1965), and has since been carried out in Seoul and the Gyeonggi region (Min and Kang 1984, Hong et al. 1986, Chang et al. 1988, Oh 1998). Since 1996, the Pollen Research Center of the Korean Academy of Pediatric Allergy and Respiratory Disease (KAPARD) has been performing pollinosis stud-ies in eight major Korean cities (Busan, Daegu, Daejeon, Gangneung, Guri, Gwangju, Jeju, Seoul). Although Ulsan, a city of industrial complexes, is a more sensitive region for environmental diseases than other cities, quantitative studies of such diseases in this region have been lacking. Ulsan is not included in the eight cities in which KAPARD is performing pollinosis studies. In fact, there have been no studies of pollinosis, a suspected environmental dis-ease in Ulsan. Since symptoms of pollinosis can differ according to climate, plant distribution, and vegetation, local differences must exist (Falagiani 1990, D’Amato et al. 1998). Therefore, locally specific studies on airborne pollen have immense value for the prevention and cure of environmental diseases (Ong et al. 1995). In this study, we investigated the spatial-temporal distribution character-istics of airborne pollen by conducting a pollen survey in Ulsan from August 2009 to November 2010. We also devel-oped a pollen calendar on the basis of the survey results.
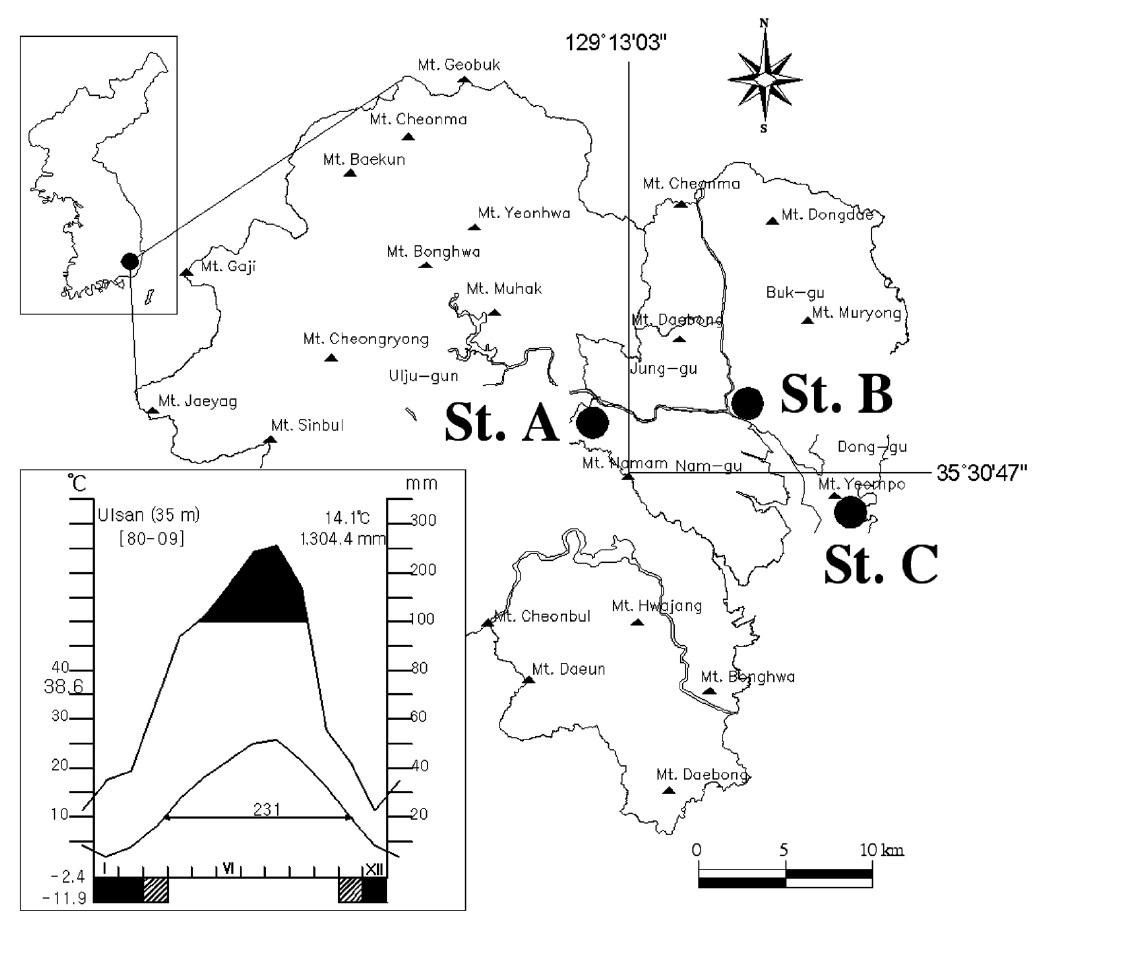
Ulsan is in the southeastern part of the Korean Pen-insula adjoining the East Sea. Major drainage systems of this region are the Taehwa River, the Woehwang River, and the Heoya River. The heavy chemical industries ? Ul-san Petrochemical Complex and Onsan National Indus-trial Complex ? lie along the southeastern coast of Ulsan. Climatic information for the region was obtained from meteorological data collected over 30 years from 1980 to 2009 by the Ulsan meteorological administration (Korea Meteorological Administration 2010). The annual mean temperature was 14.1℃, and the annual mean precipi-tation was 1,304.4 mm. Annual precipitation measured from June to September was 64.5%, with minimum pre-cipitation recorded in December (22.5 mm) and January (34.7 mm). The lowest recorded temperature was -11.9℃ (on January 18, 1980), and the highest recorded tempera-ture was 38.6℃ (on August 3, 1983). For 231 days, the daily mean temperature was over 10℃. In December, January, and February, the daily minimum temperature was below 0℃. All data gathered indicate that Ulsan has four sea-sons and belongs to the temperate zone with heavy rain typical in the summer.
Three sampling stations (Sts.) were chosen on the basis of site environment. St. A (35°32'39" N, 129°15'16" E; alti-tude, 74 m) was close to Mt. Munsu, which is on the out-skirts of the city and considered a source of pollen from the mountain. St. B (35°33'11" N, 129°21'22" E; altitude, 43 m) was chosen to study residential districts and riparian plant communities and St. C (35°29'50" N, 129°25'16" E; altitude, 66 m) was selected to reflect coastal vegetation and residential districts (Fig.1).
Durham samplers were used to trap airborne pollen grains (Ogden et al. 1974). Two horizontal 23 cm circular disks were set 7.6 cm apart from each other. A mount for positioning a glass slide was placed between the disks, 2.5 cm away from the bottom disk and 1.5 m above the ground. Samplers were installed on roofs with no air-han-dling units to ensure they were set in open spaces conve-nient for changing the glass slides. The pollen samplers were not moved during the research period from August 1, 2009 to November 30, 2010.
Vaseline was applied to the surface of the glass slides (76 × 26 mm), which were then installed for 24 h on the sampler. Glass slides were changed every day at 9 a.m. If glass slides were wet, precipitation was allowed to dry naturally. For preservation, glass slides were stained and sealed using the gentian violet glycerin jelly method and an 18 × 18 mm cover glass.
Airborne pollen was measured using standardized pro-cedures for atmospheric pollen counts and pollen fore-casts employed by the Japan Allergy Foundation (Sahashi et al. 1993). The pollen grain count was rounded up from two to one decimal point. The start date of observation was defined as the day, starting from January 1, when the pollen count was rounded up to one decimal point. The beginning of pollen scattering was defined as the first day on which pollen was detected for more than two con-secutive days, with a first day value of one grain/cm2. The ending date of the main pollen season was defined as the day prior to the first three consecutive days of zero grain detection.
>
Distribution of airborne pollen
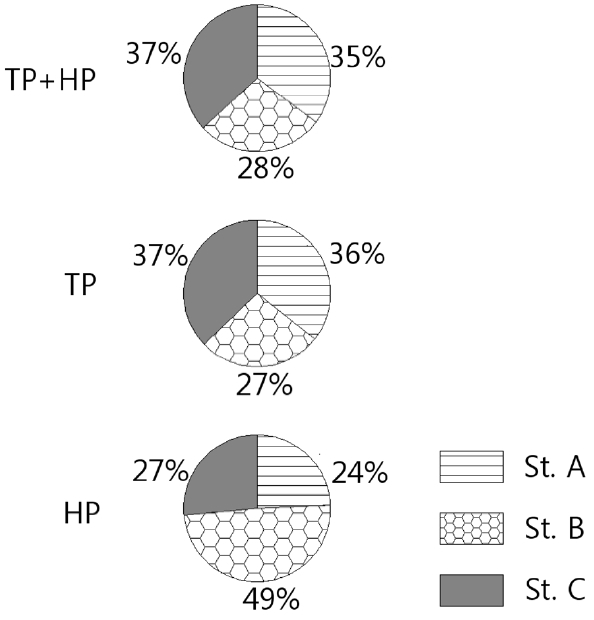
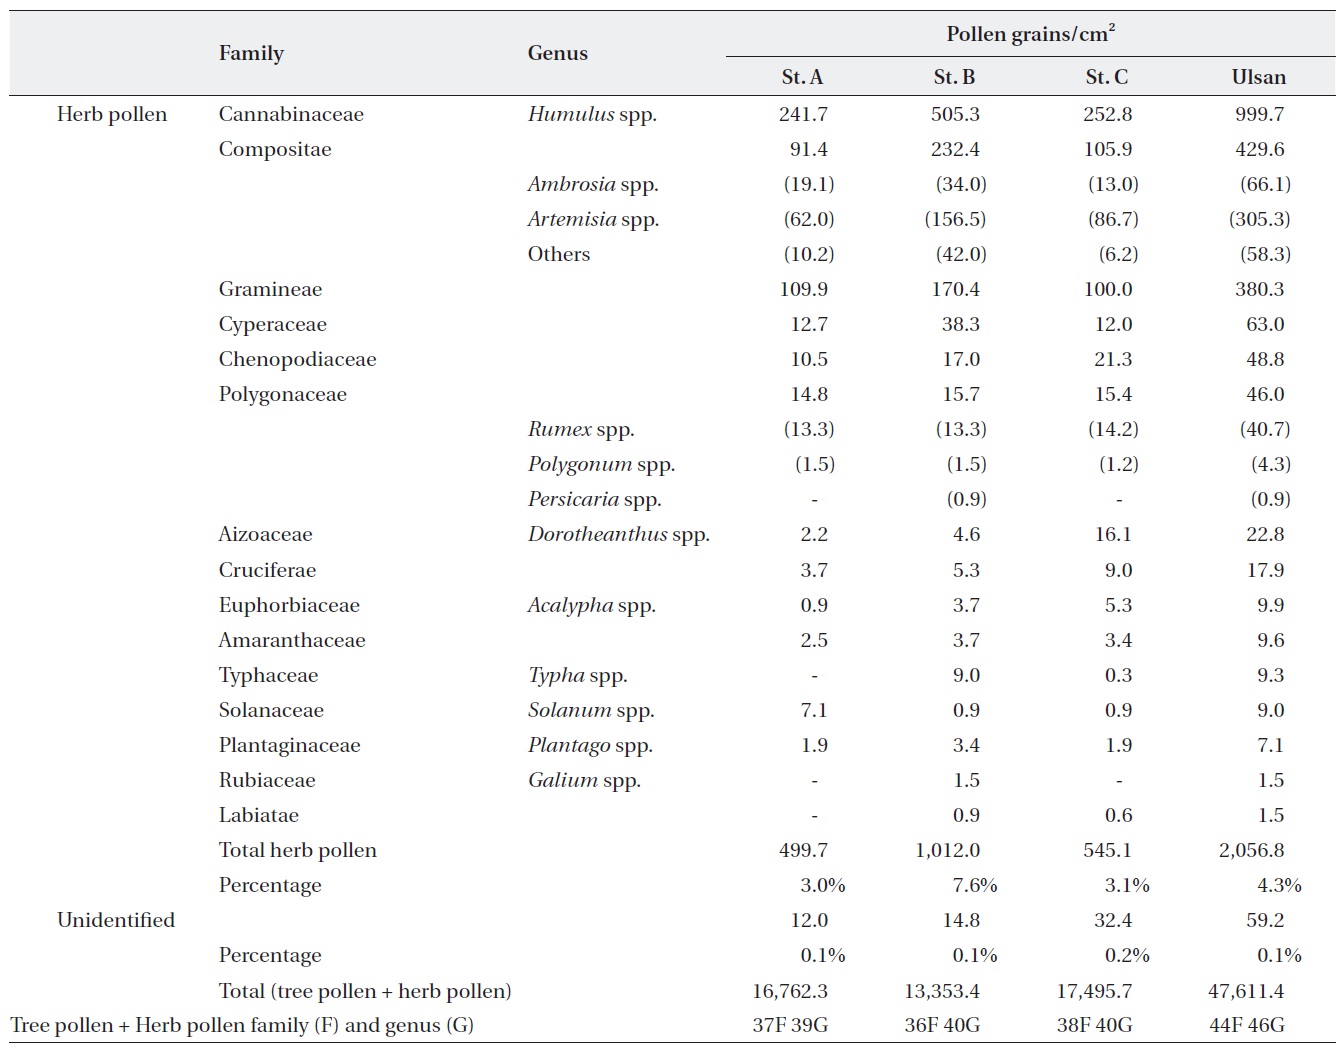
The total pollen counted during the study period from August 1, 2009 to July 31, 2010 was 16,762.3 grains/cm2 at St. A, 13,353.4 grains/cm2 at St. B, and 17,495.7 grains/cm2 at St. C. St. A accounted for 35% of the total pollen grain measured in Ulsan in one year, whereas St. B and St. C ac-counted for 28% and 37% of total pollen, respectively. Tree pollen (TP) was detected the most at St. C (37%), and herb pollen (HP) was detected the most at St. B (49%) (Fig.2).
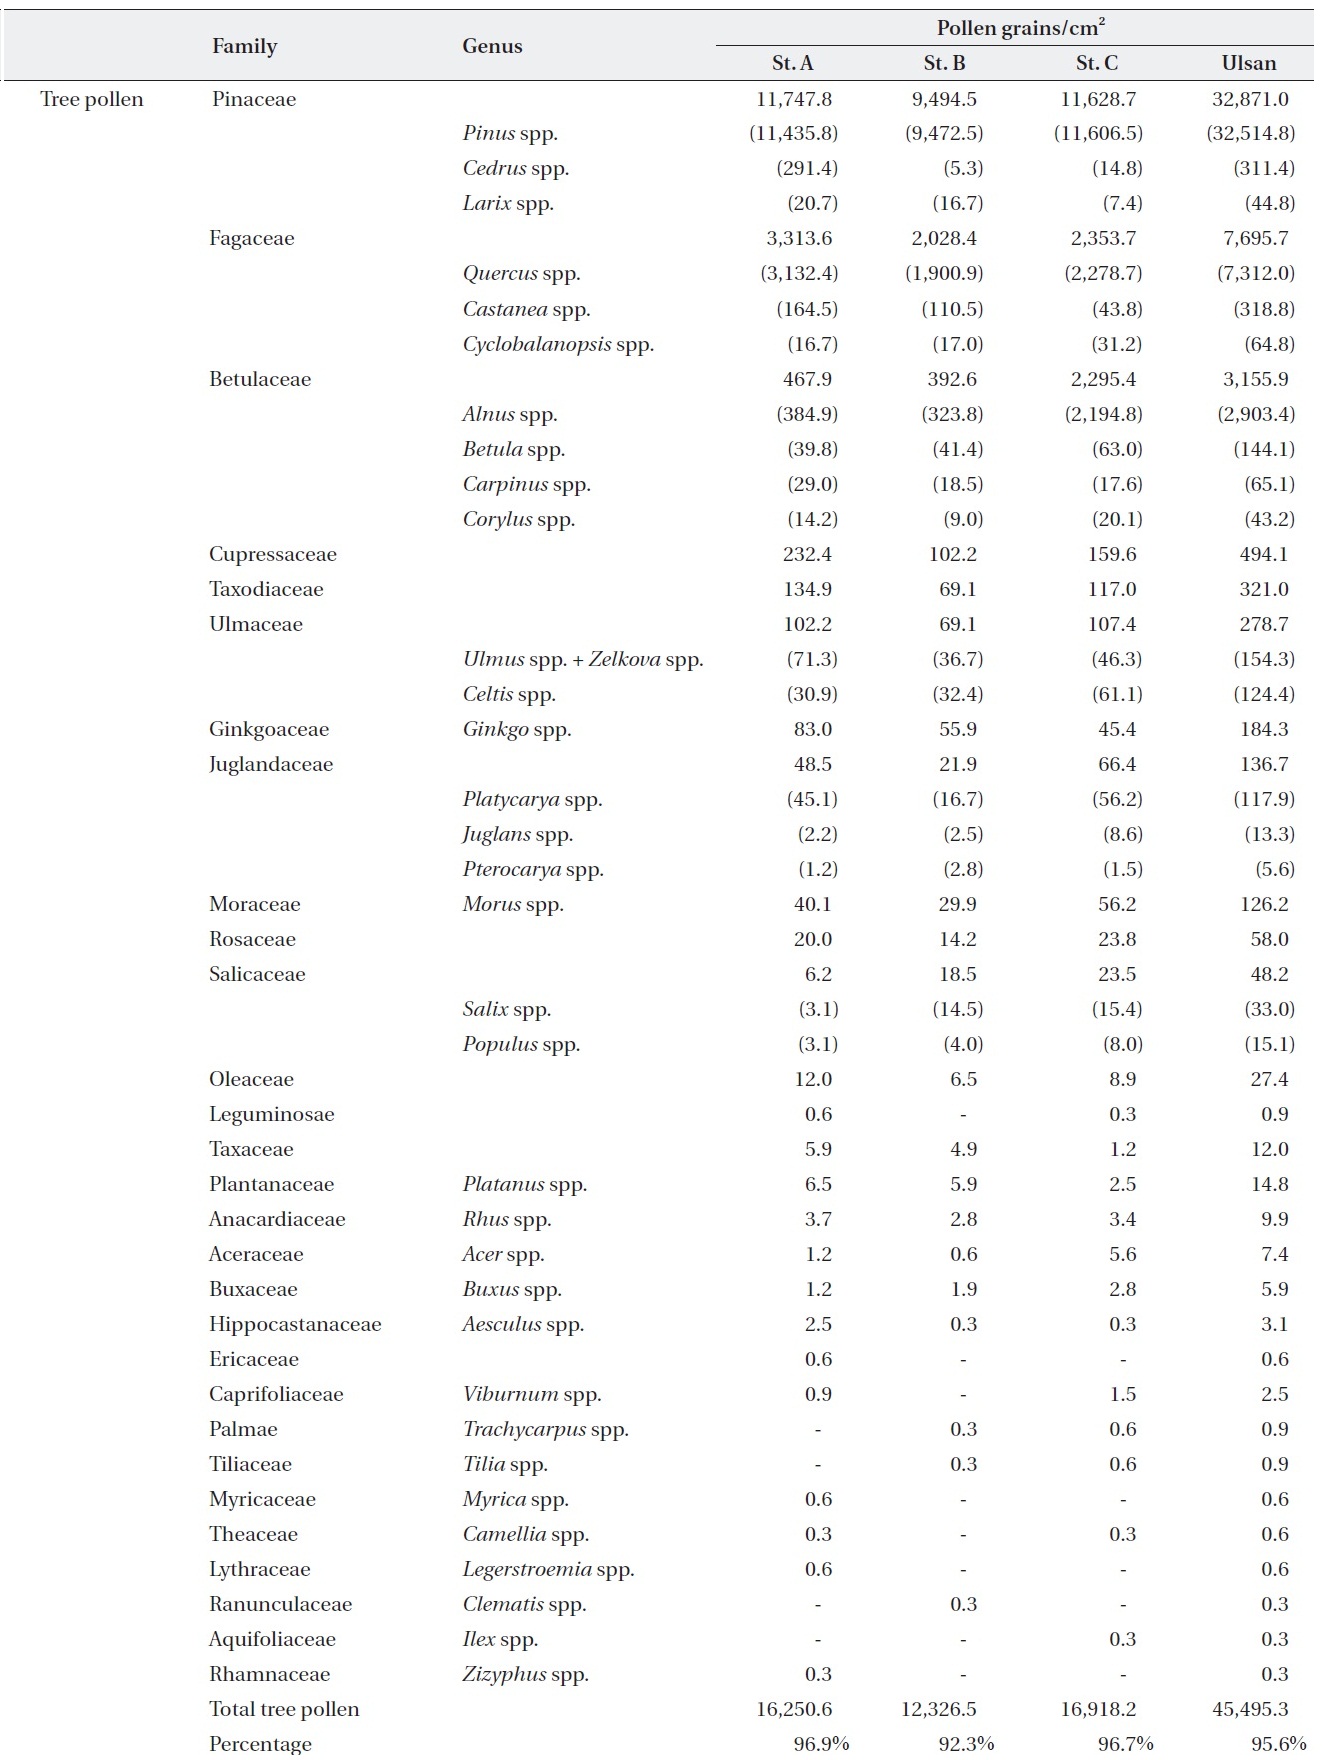
We identified 44 families and 46 genera of pollen in Ul-san. The TP types identified at Sts. A (25 families, 30 genera) and C (24 families, 30 gen-era) were more than those identified at St. B (21 families, 28 genera). The types of HP detected at St. B (15 families, 12 genera) were more than those detected at St. C (14 families, 10 genera) and St. A (12 families, 9 genera). The proportion of total pollen that was TP was 96.9% at St. A, 92.3% at St. B, and 96.7% at St.
C. The dominant airborne pollens at St. A, in order from highest to lowest concentration, were
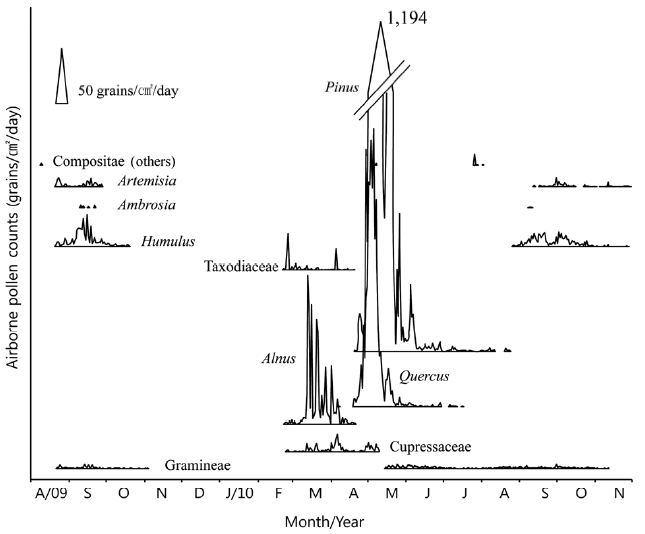
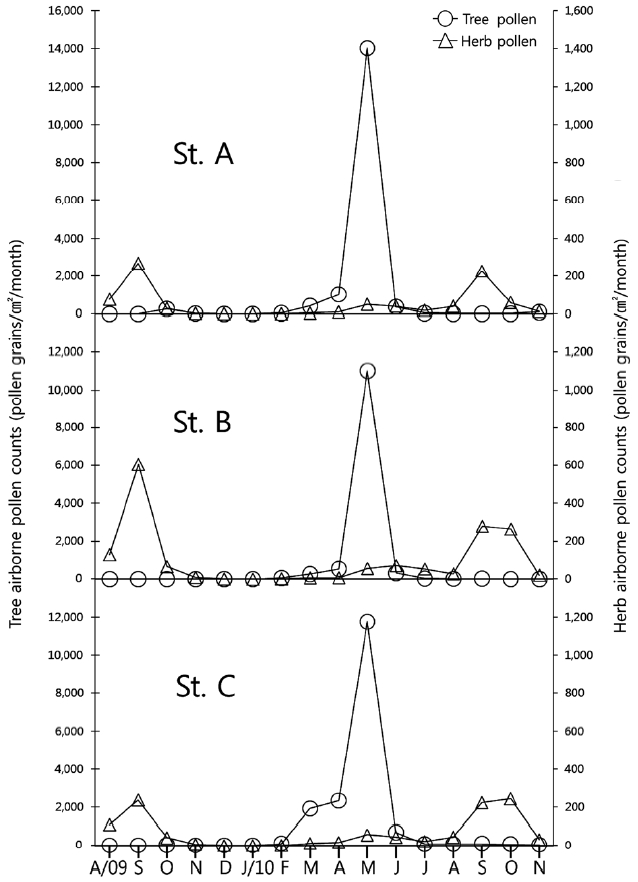
Monthly variations in airborne pollen concentrations at the three stations from August 2009 to November 2010 are shown in Fig. 3. At all stations, three pollen peak seas-ons occurred at the same times. The first peak season occurred between August and November of 2009 and was attributable to HP. The second and the highest peak season occurred between February and June and was at-tributable to TP. The third peak season occurred between August and November of 2010 and was attributable to HP. The detected pollen concentration at St. C in March was higher than at Sts. A and B and was attributable to
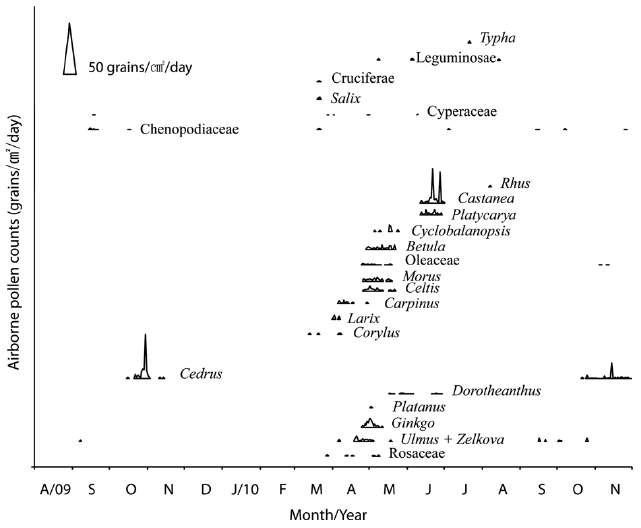
Data regarding the types of airborne pollen at each of the three stations was combined. The 34 most dominant types of pollens are presented in a pollen calendar. High and low concentrations of the 34 dominant pollens are presented in Figs. 4 and 5, respectively.
In the TP peak season, pollens of
For
For Taxodiaceae pollen, the first day of observation was February 17, scattering began on February 24, the season ended on April 19, and the peak value was noted on Feb-

Annual counts of airborne pollen types at three sampling stations (Aug 1, 2009-Jul 31, 2010)

Contiuned
ruary 25 (31.9 grains/cm2).
For Cupressaceae pollen, the first day of observation was February 20, scattering began on March 12, the sea-son ended on May 22, and the peak value was recorded on April 6 (15.5 grains/cm2).
For
For
During the peak season of HP from August to Novem-ber, 95% of HP was attributable to
For
For
Gramineae plants had two pollen seasons in a single year, May to June and August to September, whereas other plants had only a single pollen season per year. In 2009, pollen scattering occurred on August 22 and end-ed on November 2, and the peak value was recorded on September 12 (3.7 grains/cm2). In 2010, pollen scattering began on May 17 and ended on June 28. Pollen scattering was recorded for a second time in 2010, from August 18 to November 11. The peak values for each season were re-corded on May 24 (3.5 grains/cm2) and September 30 (3.4 grains/cm2), respectively.
>
Low concentration of TP and HP
Low concentrations of TP and HP of dominant pollen were of the types listed below. Parent plants were iden-tified on the basis of the local vegetation, and flowering season was determined on the basis of the detected pol-lens which were distributed into three groups based on the habitat of parent plants (Fig.5). Group 1 included
The pollen season in temperate climates is normally restricted to the flowering season from early spring to autumn (Knox 1979). Ulsan has a temperate climate with high temperature and humidity in the summer and is cold and dry in the winter. The annual airborne pollen concentration has two peak seasons (TP in spring and HP in au-tumn) (Fig.3). The dominant pollen type per month was Taxodiaceae in February,
We also determined the allergic sensitization rates of the pollen types detected. Parent plants were identi-fied on the basis of the local vegetation, and the flower-ing season was determined on the basis of the detected pollen. More than 95% of the annual pollen consisted of TP (mostly
During the peak period of HP from August to November, 95% of HP consisted of