Air pollution has developed into a serious environmen-tal crisis among modern human societies as a result of ex-tensive industrial developmental, rapid economic growth and an increased energy demand globally over the last century. Particularly increased anthropogenic emissions of combustibles and fossil fuels have induced the acidi-fication of rain and the soil. Observations from the Hub-bard Brook Experimental Forest (HBEF), starting in 1962, have produced the longest continuous record of precipi-tation and stream water chemistry (Moldan and Cerny 1994). Within these observations Likens (1972) highlight-ed the high acidity of rain and snow at HBEF, which have since been determined to mainly be due to the presence of sulfuric acid (Likens and Bormann 1995). As part of the International Biological Program, ecosystem research in Solling, a mountainous area in Germany, revealed high rates of deposition of various air pollutants, especially sul-furic acid (Mayer and Ulrich 1974). The increased acidity of precipitation is the result of anthropogenic emissions of SO2 and NOx, which are hydrolyzed to become the strong acids H2SO4 and HNO3 in the atmosphere (Likens and Bormann 1995). Although it has been reported that acid rain tend to reduce the pH of the soil substrate, most studies of acid rain deposition have focused on sulfur and nitrogen deposition, the pH of precipitation and the high concentration of toxic metal ions (Pennanen et al. 1998, Jezierska-Tys 2004, Huang et al. 2010).
Acid rain has been shown to have a wide range of effects on the ecosystem, such as cation-loss or nutrient-leach-ing from leaves (Fairfax and Lepp 1975, Proctor 1983, Liu et al. 2007), alterations in the gas-exchange rate through leaf stomata (Evans et al. 1982, Hermle et al. 2007), and germination and plant growth (Wood and Bormann 1974, Neufold et al. 1985, Reich et al. 1987, Kim et al. 2008). Acid rain has also been responsible for soil acidification, which has resulted in soil fertility declines and in harmful ef-fects on plant growth resulting from leaching of soluble toxins (Wood et al. 1984, Matzner et al. 1986, Sakamoto et al. 2001, Monteith and Evans 2005). Moreover, acids can cause the release of nutrients such as Ca, Mg and K from their solid phases into solution (Batty and Younger 2007, Zhang et al. 2007).
In terrestrial ecosystems, acid rain has a significant effect on the decomposition process, which plays a par-ticularly important role in the cycle of materials and the maintenance of ecosystem stability. The increased acid-ity particularly affects the size, composition and activity of soil microbes (Fritze 1992, Myrold and Nason 1992, Baath and Anderson 2003, Batty and Younger 2007, Rousk et al. 2009). Prescott and Parkinson (1985) suggested that microbe-mediated changes in soil processes, such as lit-ter decomposition, are the most important components of nutrient cycling. Particularly, low pH has been shown to reduce microbial activity (Baath et al. 1979, Bewley and Parkinson 1985, Baath and Anderson 2003, Batty and Younger 2007, Rousk et al. 2009). The studies of Hovland et al. (1980), Hovland (1981), Batty and Younger (2007), and Zhang et al. (2007) have all suggested that the low pH of acid rain accelerates the leaching of essential nutrients (K and Mg) from plant litter, as well as directly affecting the decomposition process. However, Ouyang et al. (2008) suggested that the mineralization of soil organic C was not related to low pH acid rain.
In South Korea, the rain in major cities has frequently been recorded as having a low pH year round (Ministry of Environment 2010). Lee (1998) examined the spatial distribution of precipitation acidity in the major cities of South Korea, and found that the almost area of major city exhibited low pH precipitation.
The aim of this study was to assess the effect of simu-lated acid rain on the plant litter decomposition process at the microcosm scale. Leaf litter samples were treated periodically with simulated acid rain, which included sul-furic acid, and retrieved for the determination of weight loss, microbial biomass, microbial community structure and microbial activities within the decomposing litter. The microbial activities measured were CO2 evolution and the enzyme activities of the decomposing litter.
>
Litter sample and experimental design
In the Korean Peninsula,
The microcosm was created in 1 L colorless glass bot-tles with detachable lids. The bottles were filled with 300 g of quartz sand that had been cleaned of organic matter through repeated washing with distilled water. The quartz sand was used to control water content at 90% water holding capacity for the maintenance of a constant wa-ter content in the microcosm bottles. Approximately 4 g of litter was placed on top of the sand in each microcosm bottle. The microcosm bottles were covered with a piece of gauze to prevent too much evaporation and incubated at a constant 23℃ and 40% relative humidity.
After the first 16 days of conditioning, 10 mL of fresh soil suspension solution was applied to the litter samples.
[Table 1.] Initial quality and chemical composition of Sorbus alnifolia leaf litter
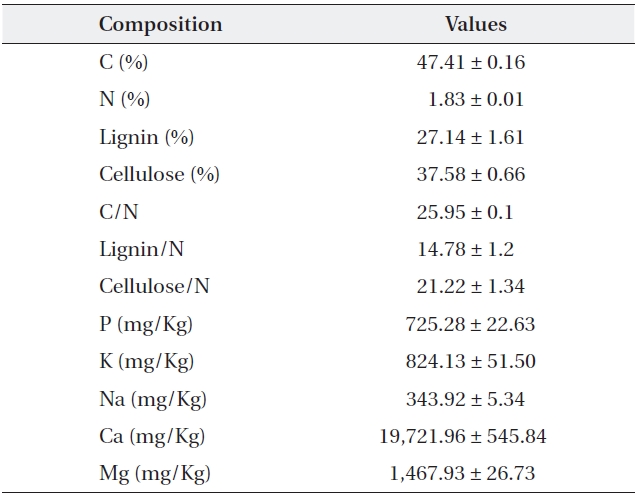
Initial quality and chemical composition of Sorbus alnifolia leaf litter
Additional artificial acid rain water, at the different pH levels, was applied twice a week from experimental day 24 until the end of experiment to compensate for water evaporation. The simulated acid rain was made up of di-luted sulfuric acid in deionized water at pH 6.5, 5, 4, and 3, respectively. Four replicated litter samples were carefully retrieved from four microcosm bottles for each pH treat-ment and analyzed after 80, 160, and 290 experimental days.
Mass loss
Litter samples retrieved from each microcosm were separated into two subsamples, one subsample was dried at 60℃ in a dry-oven for 48 h to determine moisture and dry matter contents for mass loss determination; the oth-er subsample was refrigerated at 4℃ before the biological activity analyses were performed.
Nutrient content
One gram of oven dried and ground litter sample was mixed with 10 mL of HNO3 (1D.W:1HNO3) and 3 mL of 60% HClO4. The sample was heated up slowly until the HNO3 evaporated. When HClO4 smoke went up, the sample was cooled to room temperature, mixed with 10 mL of HCl (1D.W:1HCl, v/v), and diluted with distilled water to 50 mL. The concentrations of Fe, Mg, Ca, P, Na, and K were mea-sured by inductively coupled plasma spectrometry (JY-ULTIMA-2, Jobin Yvon, Longjumeau, France), according to Helrich (1990), after filtration. More finely ground litter samples using a ball mill were used for the determination of C and N content with an element analyzer (Flash EA 1112, Thermo Electroncorporation, San Jose, U. S. A.).
Cellulose and lignin content
Cellulose and lignin contents of each litter sample were determined according to Rowland and Roberts (1994). About 0.5 g of milled litter sample was weighed (W1) and boiled for 1 h in 100 mL CTAB solution (1 g cetyltrimethyl ammonium bromide in 100 mL of 0.5 M H2SO4) under continuous stirring. The solution was filtered through a heated and pre-weighed sinter (W2) and washed three times with hot distilled water, then washed with acetone and dried for 2 h at 105℃ then weighed (W3). About 10 mL of cool 72% H2SO4 was added to the cooled sinter and the mixture was kept in 72% H2SO4for 3 h. Thereafter, the acid was filtered off under vacuum, and the residue was washed with hot distilled water until it was acid-free. The sinter was dried at 105℃ for 2 h, cooled, and weighed (W4). The sinter was then heated at 500℃ for 2 h, cooled and weighed to determine the ash content of the residue (W5). Acid detergent fiber (ADF), lignin (%) and cellulose (%) were calculated as;
% ADF = (W3 - W2)/W1 × 100
% Lignin = (W4 - W5)/W1 × 100
% Cellulose = (W3 - W4)/W1 × 100
Respiration
The CO2 evolution during decomposition was mea-sured with an infra-red gas analyzer (IRGA, modified LI-840; Li-Cor, Linclon, NE, USA). Measurements were performed twice a week until experimental day 80, after which they were performed once a week. The microcosm bottles were flushed with CO2-free air for 1 min through the hole in the lid and immediately sealed tightly with a rubber septum. The CO2 concentration of air sample was measured with an IRGA after incubation at 23℃ for 2 h and is presented in μmol CO2 g-1 h-1.
Dehydrogenase activity
Enzyme activity was determined using the method described by von Mersi and Schinner (1991). Each litter sample was mixed with 1.5 mL of tris buffer (1 M, pH 7) and 2 mL of substrate solution [2-(p-iodophenyl)-3-(p-nitrophenyl)-5-phenyltetrazoliumchloride, INT] in a test tube. The test tube was then sealed with stoppers and in-cubated at 40℃ in the dark for 2 h. The control sample was prepared as above. After incubation the samples were mixed with 10 mL of N,N-dimethylformamide:ethanol (1:1, v/v) and kept at room temperature in the dark for 1 h and shaken vigorously at 20 min intervals. After filtration, the developed idonitrotetrazolium formazan (INTF) was measured spectrophotometrically at 464 nm against a blank.
Dehydroganese activity was calculated as:
INTF (μg g-1dry litter 2 h-1) = (S - C) × 100/% dm,
where S was the mean values of samples, C was the values of the control, and % dm was the factor for dry matter.
Microbial biomass
Fungal, bacteria and total microbial biomass-C were determined by the substrate induced respiration (SIR) technique of Beare et al. (1990), which was modified from the Anderson and Domsch (1973, 1978) method.
0.5-1.0 g dry weight equivalent of litter sample was weighed in a serum bottle and incubated at 4℃ for 12 h with 2.5 mL of microbial respiration inhibitor per gram of litter sample. We used cyclohexamide (16.0 g/L) as a fungal respiratory inhibitor, and streptomycin (3.2 g/L) as a bacterial inhibitor. We then added 2.5 mL/g of glucose solution (16.0 g/L) as a substrate and immediately flushed the bottle with CO2-free air and sealed bottle tightly. We then incubated the bottle at 23℃ for 2 h. The CO2 concen-tration in the bottle was measured by IRGA.
Microbial biomass-C was calculated according to the following equations.
Fungal biomass (μg C/g dry weight) = 231.5 + 17.3 (μg CO2- Cfungal g-1 dry weight h-1)
Bacterial biomass (μg C/g dry weight) = 188.3 + 15.5 (μg CO2- Cbacterial g-1 dry weight h-1)
Total microbial biomass-C (μg C/g dry weight) = -765.1+ 14.3 (μg CO2 - Ctotal g-1 dry weight h-1)
Differences between samples, in regards to litter mass loss, CO2 evolution, and microbial biomass were ana-lyzed statistically using a one-way ANOVA followed by a Turkey honestly significant difference test. For each value we provided linear correlation coefficients. All statistical work was performed with SPSS ver. 17.0 (SPSS Inc., Chi-cago, IL, USA).
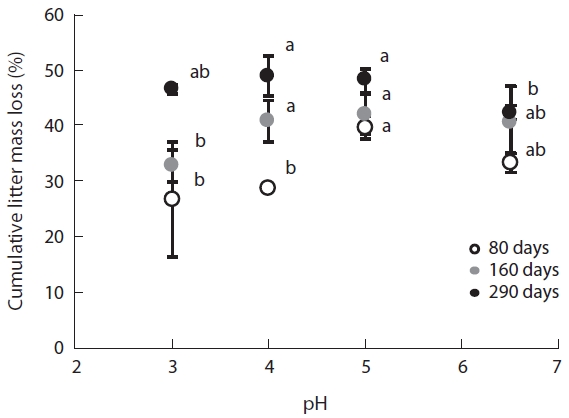
The changes in mass of the
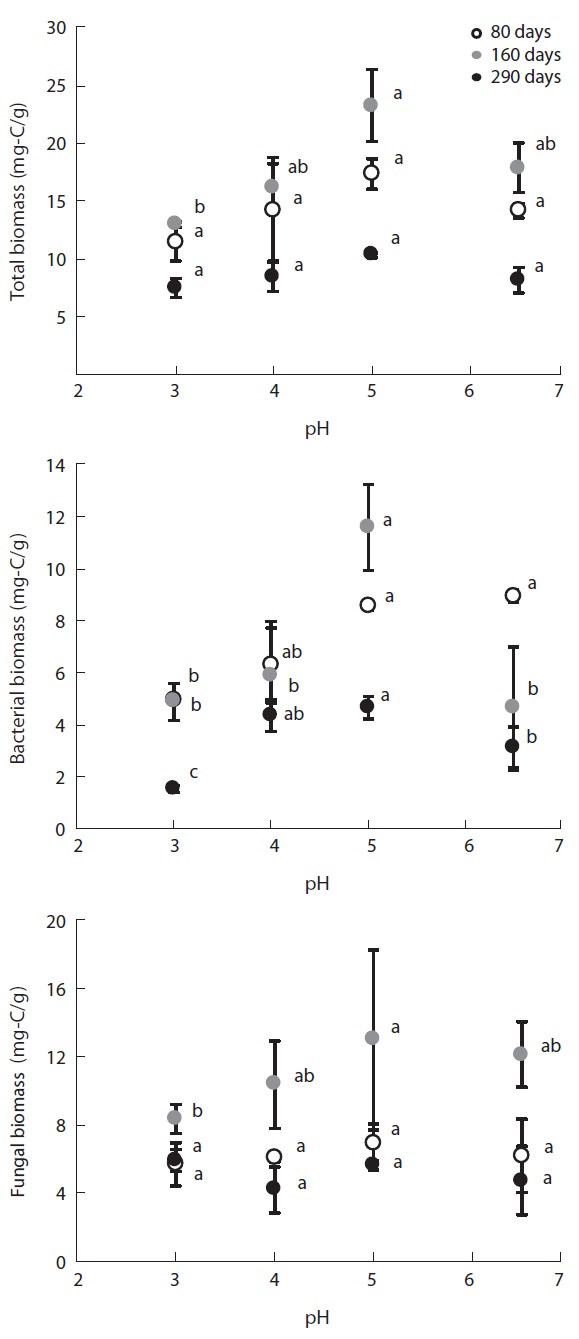
Fig. 2 illustrates the changes in microbial biomass on the decomposing litter samples induced by the simulated acid rain. The different microbial groups reacted simi-larly in terms of biomass, which tended to decrease with increasing acidity; i.e., bacterial, fungal and total micro-bial biomasses were smallest at pH 3 and highest at pH 5; however, biomass at pH 6.5 was smaller than that at pH 5.
Microbial biomass changed greatly at the different lit-ter decomposition stages. Biomass tended to be highest at the mid decomposition stage, which is the stage that provided the greatest differences in microbial biomass at each pH level. In the late stage of litter decomposition, af-ter 290 experimental days, microbial biomass was small and there were small differences between each pH level. At day 80 of decomposition, total microbial biomass-C was 11.43 mg-C/g at pH 3, 14.3 mg-C/g at pH 4, 17.33 mg-C/g at pH 5, and 14.22 mg-C/g at pH 6.5. At the mid decomposion stage, total microbial biomass increased to 12.97 mg-C/g, 17.39 mg-C/g, 23.25 mg-C/g, and 19.44 mg-C/g at each pH treatment, respectively. However, the microbial biomass then decreased to 7.47 mg-C/g at pH 3, 8.49 mg-C/g at pH 4, 10.31 mg-C/g at pH 5, and 8.19 mg-C/g at pH 6.5, representing much smaller differences between the pH treatments.
Bacterial biomass on the decomposing
pH treatments in the low pH treatments.
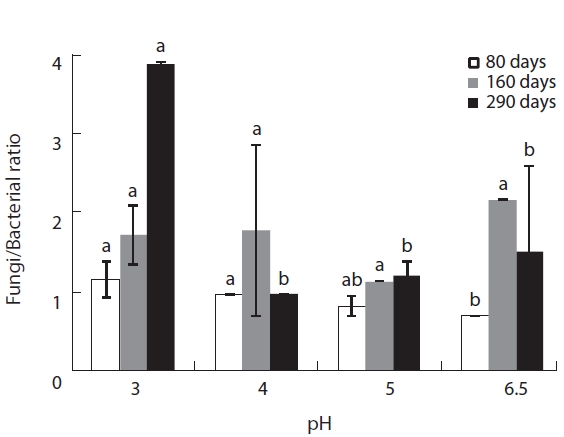
The microbial community composition, i.e., the fungi/bacteria ratio, of the decomposing litter changed dra-matically between the initial and late litter decomposition stages. These differences were caused by the different responses of bacteria and fungi to the various pH levels at each litter decomposition stage (Fig.3). At the initial
decomposition stage, 80 days after the start of decomposition, the fungi:bacteria ratio was higher than one at low pH, while it was smaller than one pH 5 and 6.5. The fungi:bacteria grew over the course of the experiment (Fig.3). These results suggest that the bacterial commu-nity dominates the initial decomposition phase, espe-cially at high pH, while the fungal community was pre-dominant during the later stages of
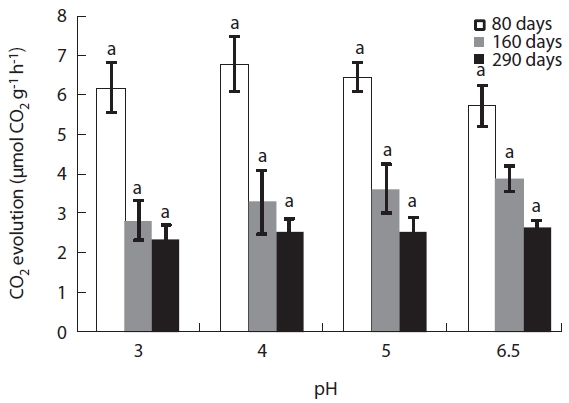
CO2 evolution from the decaying leaf litter was used as an indicator of microbial activity. CO2 evolution rate was high during the early stages of decomposition ranging from 5.7 μmol CO2 g-1 h-1 to 6.8 μmol CO2 g-1 h-1. However, microbial respiration rate gradually decreased over the course of the experiment (Fig.4). In the early litter de-composition stage, CO2 evolution was highest in the pH
4 treatment at 0.68 μmol CO2 g-1 h-1. After this stage, CO2 evolution decreased linearly with decreasing acidity. Dur-ing the late stages of decomposition (after 290 days), CO2 evolution decreased to one third of its value during the early decomposition stages (2.3-2.6 μmol CO2 g-1 h-1) and there were no significant differences between each pH treatment (Fig.4).
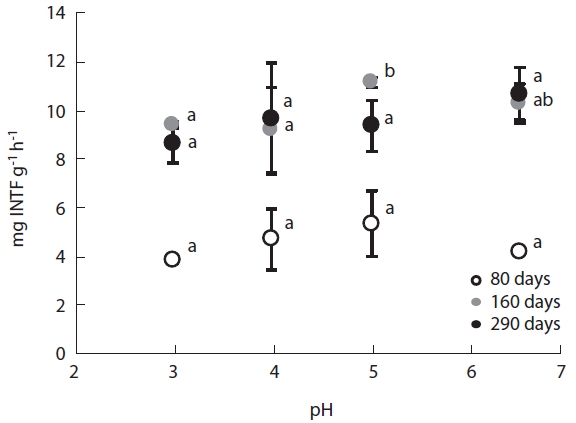
Dehydrogenase activity, a measure of microbial meta-bolic activity, changed in a pH dependent manner. En-zyme activity decreased with increasing acidity, with the activity at low pH being 70-80% of the activity at high pH. Furthermore, dehydrogenase activity varied considerably between decomposition stages (Fig.5). Dehydrogenase activities during the early decomposition stage ranged between 3.84-5.32 mg INTF g-1 h-1, while they were be-tween 9.53- 13.27 mg INTF g-1 h-1 during the late decom-position stage. The two-fold increase in dehydrogenase activity during the late stage may have been attributable to the predominance of fungi during this stage.
Acid precipitation received considerable research at-tention during the 1970s and 1980s. And although the severity of acid precipitation has declined, it does con-tinue today with higher rates of deposition (Berg and McClaugherty 2008). Soil microbial activity and biomass play important roles in ecosystem processes such as litter decomposition and nutrient cycling, it has been shown that these microbial activities are influenced by the physi-cochemical environments and chemical contents of the decomposition substrate (Heal et al. 1997, Zimmer 2002, Sariyildiz and Anderson 2003, Berg and McClaugherty 2008). Especially, acid rain is thought of as one of the most serious anthropogenic impacts on ecosystem function and is a major component of the current environmental crisis facing modern society (Zhang et al. 2007, Berg and McClaugherty 2008, Wang et al. 2010).
The results of this study revealed a remarkable reduc-tion in leaf litter mass, a key indicator of microbial de-composition activity, during the early stages of decom-position even at low pH. Although, many studies have demonstrated a decrease in decomposition rates as a result of acidification (Rechcigl and Sparks 1985, Wolters 1991a, 1991b, Wang et al. 2010). But Batty and Younger (2007) found that the
In this study, plant litter mass loss rates were sig-nificantly different between pH treatments at the early decomposition stage but not during the late stages of decomposition. These results suggest that microbial community composition adapts to variations in pH as time lapses. The changes in fungi:bacteria ratio during the litter decomposition process demonstrated clear pat-terns of microbial succession over the experimental pe-riod. These succession patterns were previously detected by Baath and Anderson (2003) by using SIR in combina-tion with the selective inhibition and phospholipid fatty acid (PLFA) techniques.
Microbial biomass was highest during the mid stage of decomposition and lowest during the late stage irrespec-tive of pH treatment; differences in biomass variation over time between the pH treatments showed the same pat-tern, with the largest differences evident during the mid stage of decomposition. Microbial biomass at each pH level exhibited similar responses as litter mass loss, with positive correlations between microbial biomass and lit-ter decomposition rates (Table 2). Consequently, the re-duced rate of litter decomposition at low pH may have been due to the loss of microbial biomass resulting from acidification, especially during the early decomposition stages. However, decomposition process is more compli-cated as evidenced by the decomposer community com-position changing over the course of the decomposition cycle in a form of microbial succession (Abrahamsen et al. 1980, Baath and Arnebrant 1994, Baath and Anderson 2003). This study also found total microbial biomass-C, bacterial biomass, fungal biomass and fungi:bacteria ra-tio changed in response to pH and at the different decom-position stages. Fungal biomass was predominant at low pH while bacterial biomass dominated at higher pH lev-els, which is consistent with the results of the many other studies (Baath et al. 1979, Bewley and Parkinson 1985, Esher et al. 1992, Fritze et al. 1992, Baath and Arnebrant 1994, Arao 1999, Pennanen et al. 1999). Rousk et al. (2009) reported five-fold decreases in bacteria and five-fold in-creases in fungi, which resulted in an approximately 30-fold increase in fungal importance, as indicated by the fungal growth:bacterial growth ratio, when pH changing substrate from 8.5 to 4.5. Baath and Anderson (2003) re-ported a positive correlation between microbial biomass and soil pH, and that the fungi:bacteria ratio decreased significantly with increasing pH (from about 9 at pH 3 to approximately 2 at pH 7) in beech/oak soil. They also found strong linear correlations between total microbial biomass and substrate pH, estimated with SIR in combi-nation with the selective inhibition and the PLFA tech-niques in a pH gradient (3.0-7.2).
CO2 evolution and enzyme activity are good indicators of microbial activity in response to environmental chang-es such as pH of the substrate. In this study, CO2 evolution peaked during the early litter decomposition stages and

The relationships between litter decomposition and three microbial biomass parameters present on the decaying leaf litter from the different simulated acid rain pH treatments taken at 23℃ and at constant humidity

The relationships between microbial biomass and CO2 evolution from the decaying litter from the different simulated acid rain pH treatments taken at 23℃ and at constant humidity
decreased as time elapsed, resultantly differences in CO2 evolution rates between the pH treatments were minimal during the late stages. CO2 evolution showed significant pH dependent relationships in response to simulated acid rain and CO2 evolution more strongly correlated with total microbial and fungal biomass. Fungal biomass ex-hibited a significant positive relationship with microbial biomass and with CO2 evolution (Table 3).
Dehydrogenase activity increased at the mid stage of decomposition and showed strong pH dependant rela-tionships, with activity being lowest at pH 3. Conversely, Killham et al. (1983) and Reddy (1995) suggested dehy-drogenase is unaffected by acidification; although, Wang et al. (2010) reported various inhibiting and catalytic ef-fects of simulated acid rain on many soil enzymes. This study did not find any significant relationships between dehydrogenase activity and CO2 evolution. Burns (1978) reported that dehydrogenase activity did not consistent-ly correlate with the numbers of microorganisms in soil samples or with rates of oxygen consumption or evolu-tion of carbon dioxide.
The inhibiting effect of acid rain on litter mass loss in this study suggests that the substrate acidification seri-ously affects ecosystem functions. This study provides evidence that litter mass loss patterns in the different acidification treatments was the result of the responses of micro-decomposer growth rates or activities such as enzyme activities or microbial respiration. Consequently, there were complementary relationships among the microbial groups within the changing environment. Even though total microbial biomass on the decomposing litter samples was similar among the pH treatments, microbial species compositions were different due to the pH toler-ances of each microbial species. The results of this study and that of Baath and Anderson (2003) suggest that the presence of a complementary microbial succession event between the bacterial and fungal groups, which occurs in such a manner that total mi-crobial biomass or total mi-crobial activities such as CO2 evolution are constant along a pH gradient.