In East Asia, precipitation is concentrated in the short monsoon period between July and August, leaving the rest of the year mostly dry, and limiting the availability of water to trees since most of the soil water store is rapidly depleted (Shin 2002, Hwang et al. 2008). In South Korea, most forests are located in mountainous areas which experience rapid lateral water flux, as well as uneven distribution of soil water, further adding to the forest trees vulnerability to drought. In areas where precipitation exceeds potential evaporation, annual water use by trees equals cumulative transpiration, which depends on atmospheric conditions and their interactions with stomatal conductance, canopy architecture and leaf area (Landsberg and Gower 1997). When water in the rhizosphere is limiting, to the extent that root water uptake cannot cope with transpirational demands, then trees will respond by closing their stomata in order to limit the drop in tissue water potentials to dangerous levels that could cause cavitation of the conducting vessels (Sperry and Pockman 1993, Cochard et al. 1996).
Transpiration is a major contributor to water loss in forests (O’Grady et al. 2008), constituting a major hydrologic component of the montane-forested catchments, and its quantification is critical for water resource management. The accurate estimation of tree transpiration is however difficult, particularly in rugged mountainous terrain. The sap flow technique is a useful tool for investigating forest water use i.e., transpiration at temporal and spatial scales (Ford et al. 2007, Kumagai et al. 2007, Jung et al. 2011). In recent years, measurements of water use at the individual tree level have become more widespread, due to the development of reliable sap flow techniques (Granier 1985, Kostner et al. 1998, Dierick and Holscher 2009). A common approach for estimating transpiration is based on the measurement of sap flux density (SFD) by the Thermal Dissipation Probe method (Granier 1987, Oren et al. 1998). The sap flow based canopy conductance (Gs) can provide a way of relating Gs to environmental factors, and help to explain the mechanism of water use of forest in different habitats. Sap flow measurements can distinguish transpiration among individuals and among class in the stand.
Understanding how transpiration varies according to climate factors as well as soil water content (SWC) is vital in forest hydrology studies. Variation in sap flow rates is explained on the basis of variation of different environmental controls, such as heterogeneity in soil water conditions, vapor pressure deficit (VPD), short wave radiation (RR) and also on the basis of methodological differences in sap flow measurements. Implications of temporal water shortage on temperate forest trees with respect to leaf water status (Hinckley et al. 1981), stomatal conductance, photosynthesis (Epron and Dreyer 1993) and hydraulic conductivity (Breda et al. 1993, Cochard et al. 1996) have been studied extensively. It was shown that tree sap flow rates scaled to the stand level plus evapotranspiration from soil and the understory agreed with water vapor fluxes measured above the forest canopy with the eddycorrelation techniques (Granier et al. 1996, Kostner et al. 1998). In the course of a drought, gradually decreasing stomatal conductance, pre-dawn leaf water potential, assimilation and growth are commonly observed, accompanied by a stimulation of fine root growth (Leuzinger et al. 2005). With regard to water deficits, Scots pine closes stomata when the soil water deficit has reached a specific threshold (Irvine et al. 1998), whereas pubescent oak maintains high transpiration rates despite the incidence of drought (Nardini and Pitt 1999), partly due to an ability to extract water from deep soil layers and groundwater (Valentini et al. 1992).
An improved understanding of how environmental factors, particularly SWC, RR and VPD influence stand transpiration is necessary in order to predict how these temperate forests may respond to the predicted reductions in precipitation due to climate change. In this study, we examined how the regulation of transpiration in individual trees responded to changes in SWC. We selected the tree species,
The study site was at Gwangneung Experimental Forest (GN) located in central western part of the Korean Peninsula (37°44′ N and 127°9′ E), and the elevation of the site is 330 m above sea level. The Korean peninsula is located on the boundary between polar and tropical climates, and is strongly influenced by a continental air mass. During winter, strong continental high-pressure systems develop over Siberia, bringing dry cold air to Korea. In summer, monsoon brings southerly winds and abundant moisture from the ocean. Precipitation is concentrated in summer period, with 45-60% of the total annual rainfall occurring in summer, and 3-10% in winter.
A flux tower was constructed at the site in order to monitor changes in carbon/energy fluxes within the microclimate since 2001 (Lee et al. 2007). The density of the trees was 1,473/ha with a total biomass of 261 ton/ha, while the basal area was 28 m2/ha. The site was dominated by
Precipitation (Rain gauge; Pluvio, OTT, Messtechnik, Germany), air temperature and relative humidity at 40 m and 20 m height (CSAT3; Campbell Sci, Logan, UT, USA and L17500; Li-Cor, Lincoln, NE, USA, respectively), The depth at which SWC determinations were carried out averaged between 0-0.3 m (CS615; Campbell Sci), radiation (CNRI; Kipp & Zonen, Delft, Netherlands) was recorded at a weather station constructed on the GN experimental forest site. Data were recorded every 5 min, averaged and logged every 30 min using a CSAT3 Campbell data logger (Campbell Scientific, Logan, UT, USA) (Lee et al. 2007). As GN is mountainous and located within the base of bedrock, the rooting depths as well as the depth of the effective soil layer were assumed to be 0.3 m. To investigate the drought effect, we postulated that SWC is responsible for the variation of SFD in
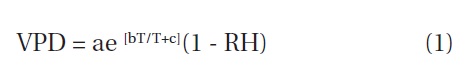
where, a, b and c are 0.611 kPa, 17.502 and 240.97 respectively.
Sap flux density within the active xylem (SFD) was measured continuously between April and November 2007 using the constant current supply method (Thermal Dissipation Probe) described by Granier (1985, 1987). Each sensor consisted of two, 20 mm long probes (2 mm in diameter), each equipped with a copper constantan thermocouple and wrapped with heating wire (Jung et al. 2011). The two probes for each sensor were inserted radially into the xylem, separated vertically by a 10-15 cm gap. One sensor was inserted into each selected tree at a depth of 0-20 mm. The upper probe was continuously heated at a constant power (0.2 W) and the lower one was kept at trunk temperature (reference probe). The heat was dissipated into the sapwood and transported by the vertical sap flux surrounding the probe. The temperature difference between the upper heated probe and lower unheated reference probe was measured and converted into SFD according to Granier (1987). During conditions of zero sap flow, e.g., at night when VPD was zero or near zero, and during prolonged rain events, the temperature difference ΔT, between the probes reaches a maximum, which is then used as reference for maximum ΔT. Sap flow during the day causes a decrease in temperature difference ΔT by cooling the upper probe. This difference is used to calculate real time SFD.
The probes were inserted in the north-facing side of the stem, and covered with Styrofoam and reflective aluminum insulation to avoid the influence of natural temperature gradients originating from direct heat from the sun, and also to protect them from rainfall. Power was supplied from a 12 V battery that was constantly charged, via a charge controller, by solar panels installed on the tower above the tree canopy. Data were recorded every 30 s and averaged every 30 min with a data logger (DL2; Delta-T Devices, Cambridge, UK). A total of six trees were monitored from 27th April to 5 November 2007, a period that covered bud break to complete senescence.
Sap flow was calculated by multiplying SFD by sapwood area (SA). We cored trees in order to estimate the SA of the studied trees. Distinct color differences were used to identify the boundary between sapwood and heartwood. We established significant (
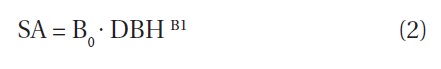
where SA is the sapwood area (cm2), DBH is the measured tree diameter at breast height (cm), and B0 and B1 are species-specific coefficients, as determined with regression techniques. In cases where more than one sensor was employed in one tree, sap flux was integrated over the entire sapwood by averaging the respective fluxes in the different sapwood depths.
Plot SAs for all trees within the plot were estimated according to Eq. (2) and the estimates were then used to calculate the total sap flow. SFD within the xylem was calculated from an empirical relationship validated for several species by Granier (1985) and recently revalidated by Clearwater et al. (1999).
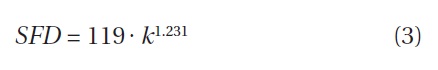
where SFD is sap flux density (mm/s) and
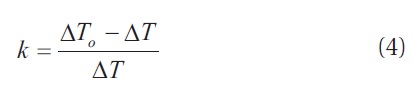
where ΔT0 is the value of ΔT when there is no sap flux. This model is widely used as standard calibration.
Despite the robustness of the sap flow technique, scaling procedures are required to extrapolate stand level estimates from SFD measurements of individual trees. Transpiration is scaled up to the stand level using the following equation (Granier et al. 1996, Wilson et al. 2001, Wullschleger et al. 2001, Pataki and Oren 2003).
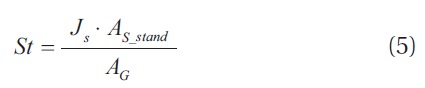
where St is stand transpiration, Js the mean stand SFD, AS_stand the stand sapwood area , and AG is the ground area. Conventionally, AS_stand is estimated by integrating all the individual tree sapwood area (AS_tree) estimates in the stand. Species-specific allometric equations describing the relationships between stem diameter (DBH) and AS_tree are used for this purpose (Vertessy et al. 1995, Cienciala et al. 2000, Roberts et al. 2001, Wullschleger et al. 2001). Estimates of stand transpiration derived through extrapolation of species-specific xylem sap flow rates can only be as good as the original measurements.
The mean canopy stomatal conductance was calculated by using equation (Kostner et al. 1992, Granier and Breda 1996, Pataki et al. 1998)
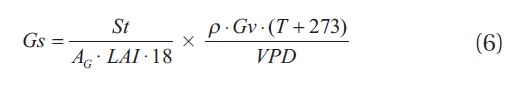
where St is the stand transpiration (Js ? SA), AG = stand area, LAI = leaf area index of stand, ρ = the water specific density, T = the air temperature, Gv = the gas constant, VPD = the vapor pressure deficit.
Leaf area index (LAI) is the amount of leaf area in a vegetation canopy per unit land area, and was measured by indirect methods using the Li-Cor LAI 2000 plant canopy analyzer. Estimated SFD and canopy stomatal conductance were correlated with climatic factors such as VPD, RR and SWC. All statistical analyses were performed with Sigma Plot 9.01 and Sigmastat 3.11 program (Systat Software Inc., San Jose, USA).
>
Microclimate and soil moisture
The annual mean air temperature at the study site was 11.3℃ while annual precipitation was 1,365 mm. The mean daily air temperature from May to November in 2007 was 21.2℃ . During 2007, rainfall was well distributed over the growing season, although rainfall in July and August was heavier. The total precipitation was 933 mm
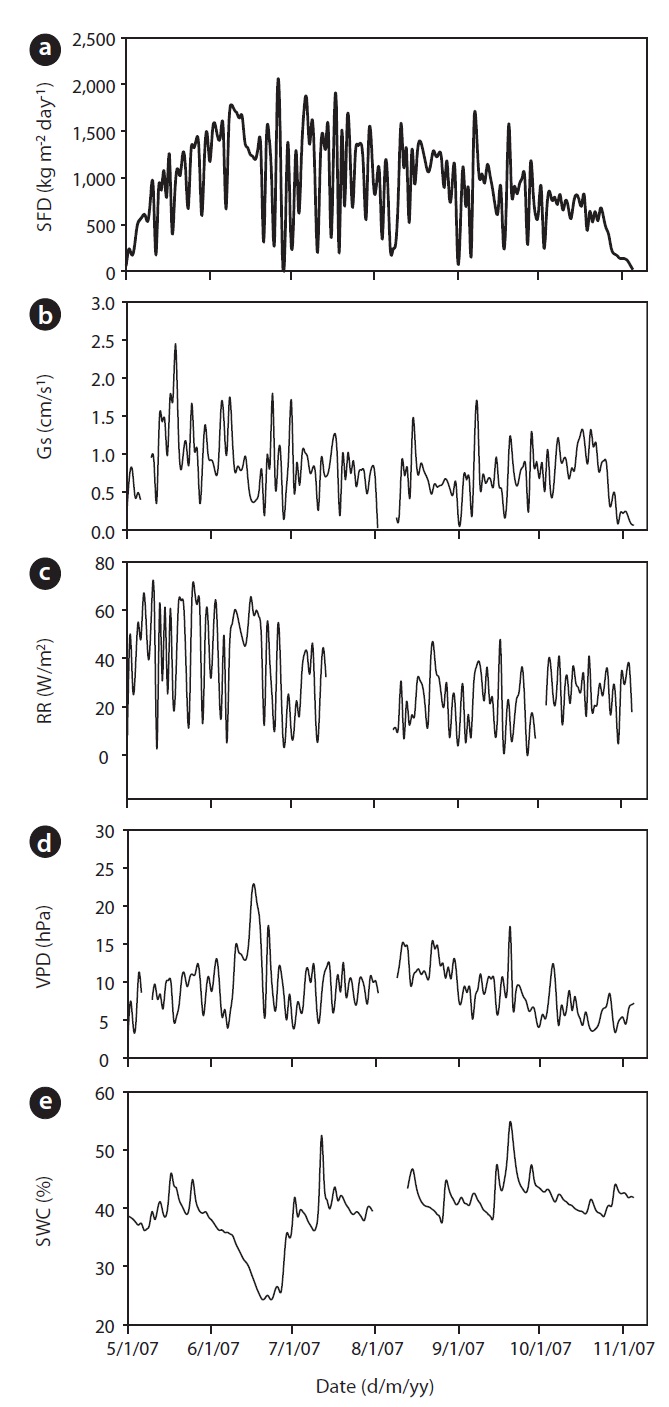
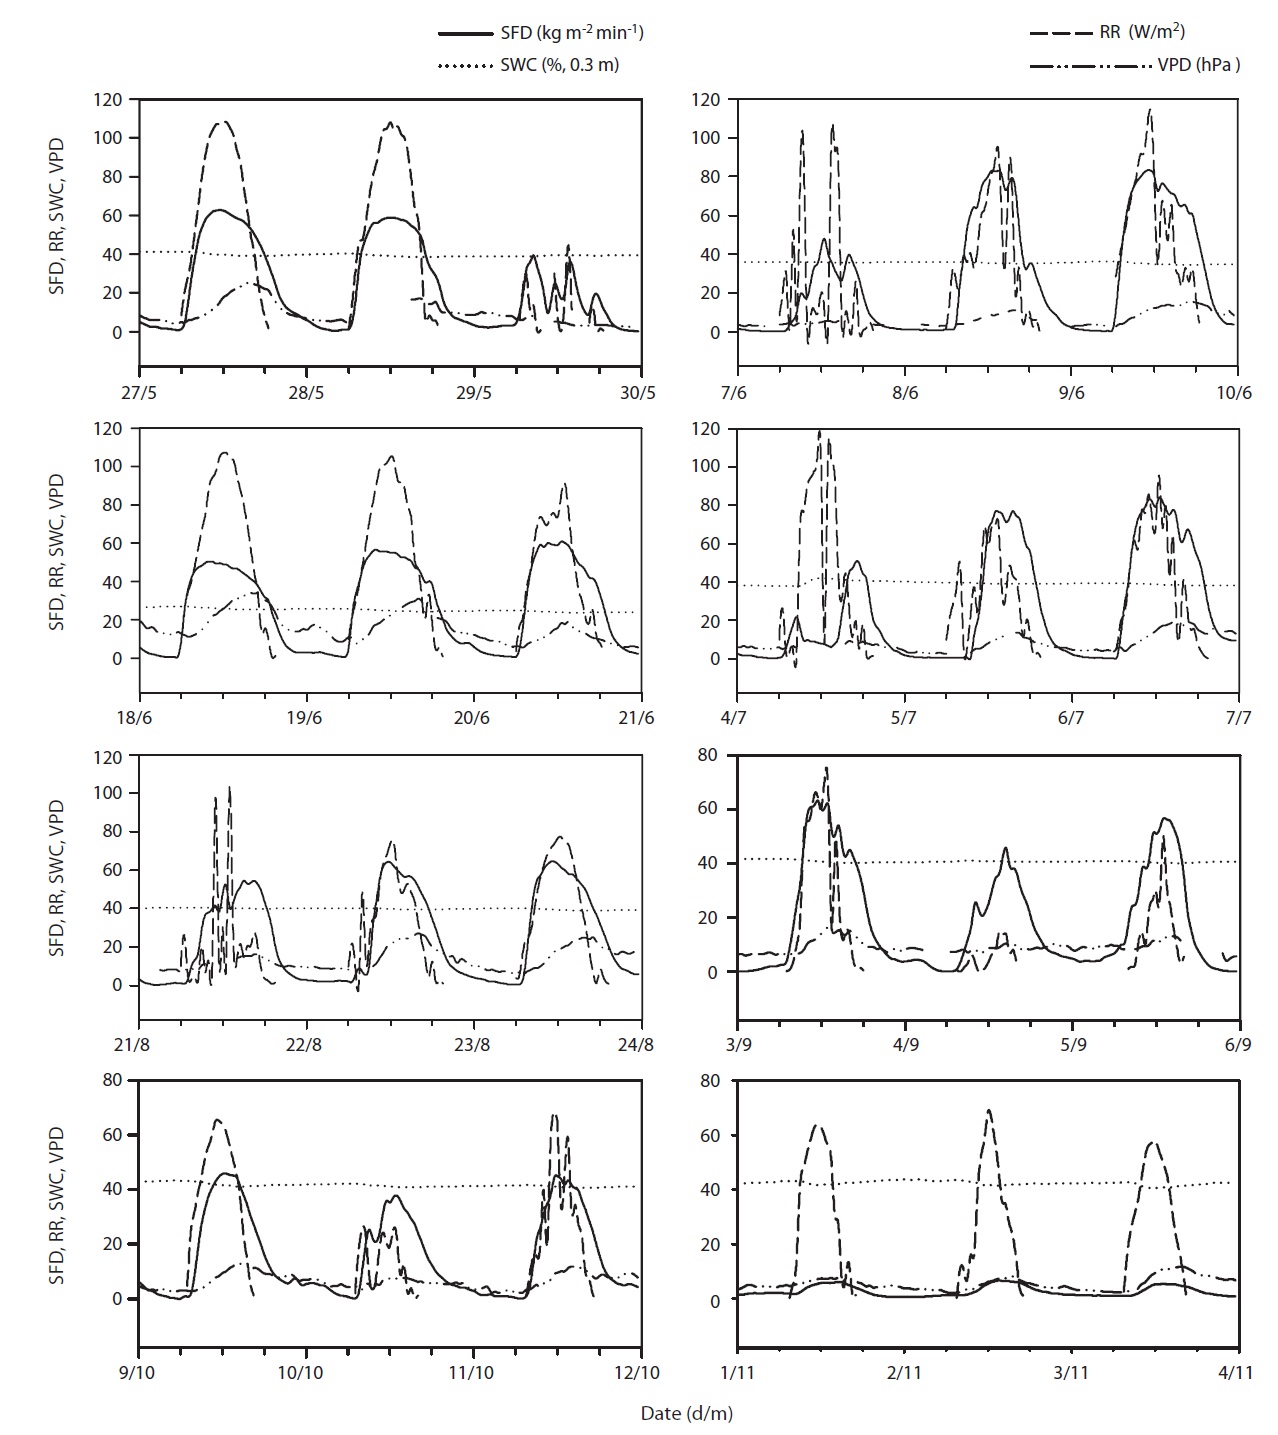
from May to November. Early June was the driest, while August was the wettest period during the study. Although a SWC of less than 30% is considered, in general, as drought condition in Gwangneung soils, we considered the drought condition to occur when SWC dropped below 35%, and this condition was observed throughout most of the month of June, and was much more pronounced towards the end of the month (Fig. 1e). SWC in the upper 0.3 m varied over the measurement period. During the drought, SWC in the upper 0.3 m soil declined to 24% in June, while the maximum SWC (55%) was observed during the month of September. VPD showed seasonal variations, with the highest values occurring on June 17 (Fig. 1d). Daily mean VPD during drought and non-drought periods were 13.64 hPa and 8.58 hPa, respectively, while the respective maximum values were 22.68 hPa and 17.27 hPa. The recorded maximum daily average value of radiation was 68.47 W/m2 with an average of 31.18 W/m2 during the study period (Fig. 1c).
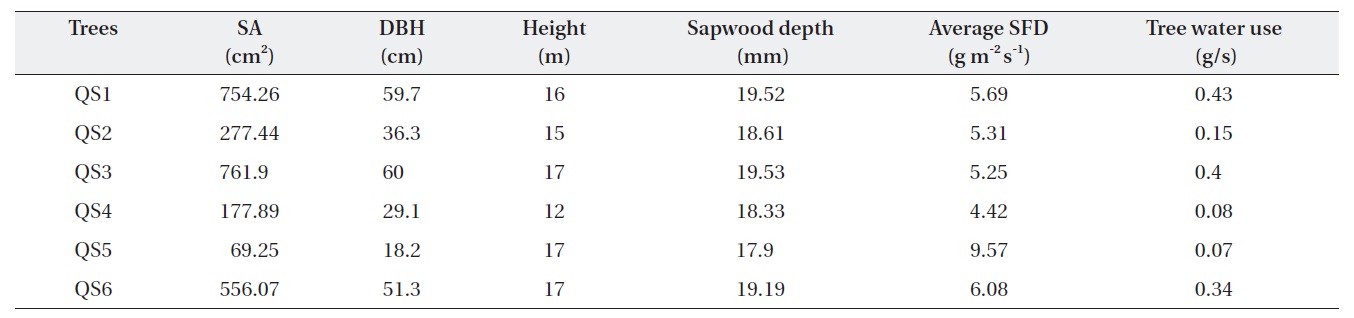
Table 1 shows the morphological characteristics of the selected
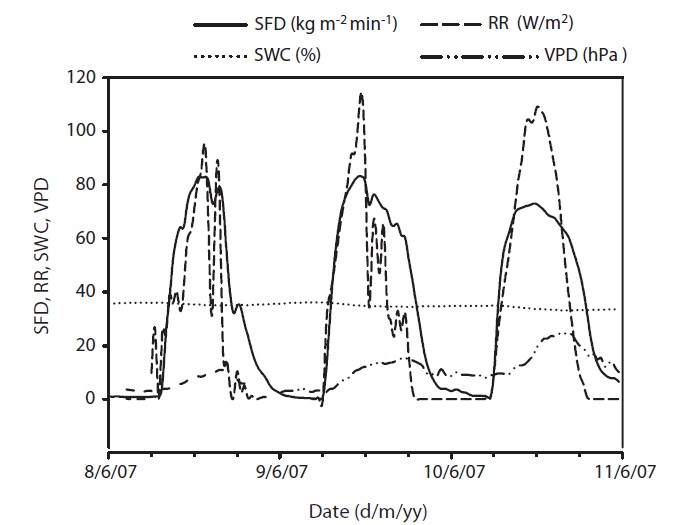
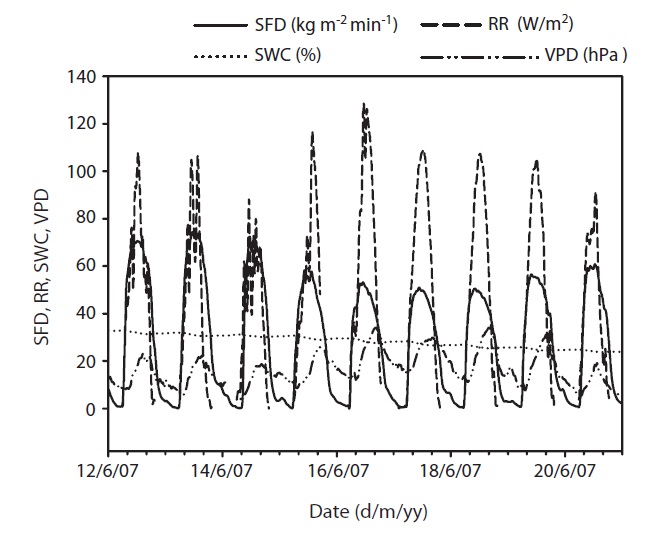
Results of seasonal SFD are shown in Fig. 1a. The maximum daily average SFD was 1,833 kg m-2 day-1. Temporal variation of SFD in response to RR and VPD were pronounced during the study period (Fig. 2). Diurnal patterns of SFD showed a steep morning increase, leading to maximum rates at around midday when RR or VPD was

Characteristics of Quercus serrata trees (QS) chosen for the measurement of tree water use
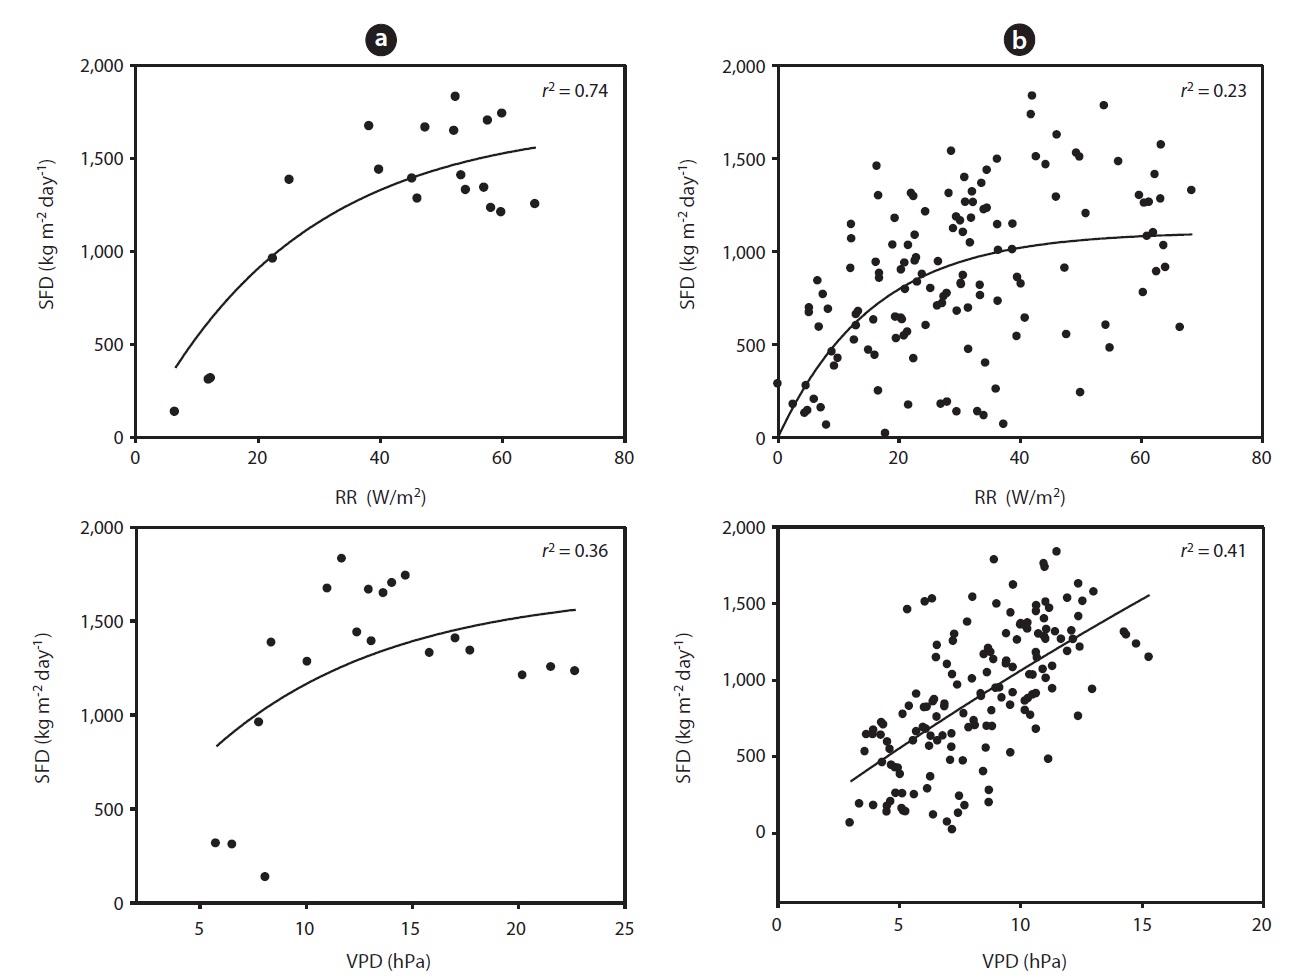
at its maximum, followed by a gradual decrease later in the afternoon during clear-sky day conditions (Fig. 2). The half-hourly measured SFD increased with VPD and RR during the study period, while the daily maximum or total SFD did not always increase with VPD and RR. In spite of higher RR and VPD, daily maximum or total SFD during the drought period (June 19-21) (Fig. 2) was less than that in the non-drought period (June 9-10 and July 6-7) (Fig. 2).
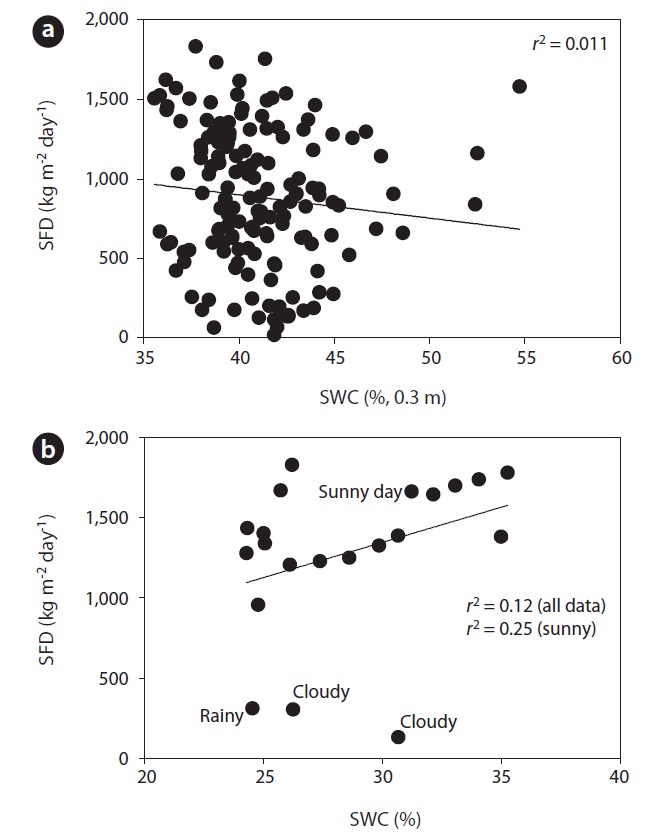
Fig. 3 shows the curvi-linear relationship between daily SFD and RR when SWC was above 35 % (
To evaluate the effect of drought, we calculated the co-
efficient of determination between SFD and SWC during the drought and non-drought periods. The relationship between SFD and SWC during the drought period was relatively strong (
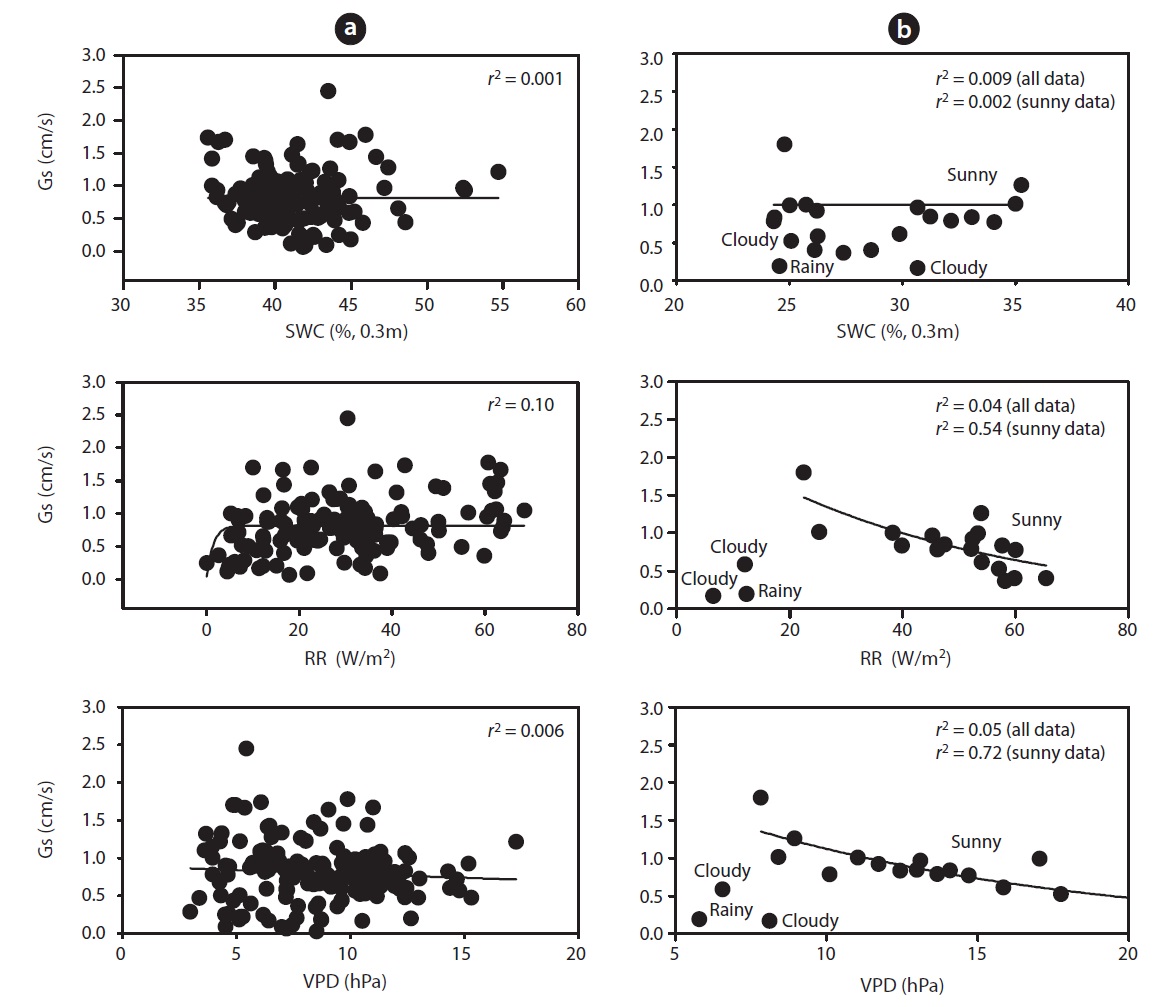
mum daily average Gs (2.45 cm/s) occurred during the end of May (May 19) and Gs declined during drought (Fig. 1b). For example, measurements of Gs in June (on June 20 SWC was 24%) at the peak of the drought were on average equal to 0.78 cm/s, which was 32% of the maximum Gs measured on May 19. In a shorter temporal scale, the response of Gs was mainly influenced by radiation and VPD (see Fig. 1b vs. Fig. 1c and 1d). Nevertheless, the long-term (e.g., seasonal) response was mainly controlled by soil moisture conditions (see Fig. 1b vs. Fig. 1e). Fig. 7 showes the relationship between Gs and VPD during drought and non-drought periods. A flat or negative slope indicates stomatal closure (Bovard et al. 2005) when VPD was high and SWC low. Before drought, the highest Gs value was 2.45 cm/s while the highest value after drought was 1.70 cm/s. The relationship between Gs and VPD was negative during drought and generally positively strong (
We found evidence that SWCs greater than 35% at 0.3 m depth has no significant influence on the SFD of
Previous results illustrating the effect of SWC on transpiration and stomatal conductance have been presented by Tan et al. (1978), who measured the stomatal resistance (rs = 1/Gs) of a douglas fir stand over a period of one month, during summer when there was no rain. They showed that the effects of VPD were enhanced by dry soil. Kelliher et al. (1995) reported that even the moderately wet soil has a considerable effect on stomata, and hence, on transpiration rates. In this study, a good relationship was observed between SFD and stomatal behavior where
During the drought period, stand transpiration and SFD declined with increasing VPD and RR. We observed significant differences in SFD responses to changing VPD above 1 kPa, at both high and low SWCs. When SWC was low, the trees showed declining Gs as VPD increased, as
opposed to the periods when SWC was high. Below 35 % of SWC there was a relatively strong relationship between SFD and SWC, with
Transpiration rates vary with weather conditions and soil moisture (Wang et al. 2005). The first source of variation is due to weather, because available energy and atmospheric deficit in vapor pressure drive the transpiration flux from vegetation to the atmosphere (Granier et al. 2000). The second source is the biological regulation exerted through canopy stomatal conductance. We investigated the possible causes of differences in transpiration during drought. Lower transpiration rates should reduce the drought effect, maintaining water potentials at a safe margins above critical values that could lead to cavitation. An optimization procedure was used to establish the values of Gs in the Penman-Monteith equation, giving the closest agreement with measured values of SFD, indicating that Gs was a function of VPD, but dependent, at least to some degree, on SWC.
Several studies have reported the negative effect of soil water depletion on canopy conductance. Variation of Gs can be related either to soil water reserves or soil water deficits (Granier and Loustau 1994), or to the relative extractable water in the soil (Granier and Breda 1996). Gs were found to progressively decrease when SWC varied from 35 to 24% (Fig. 7b), this decrease being more pronounced when SWC dropped below 35%. Gs ranged from 0.03 to 2.45 cm/s. Canopy conductance declined in response to increasing VPD during drought, and the magnitude of reduction varied over the measurement period (Fig. 7b). However, after 4 pm, Gs did not increase in response to decreasing VPD due to declining light intensities. Variation in stomatal conductance is solely based on variability in RR and VPD (Cienciala and Lindroth 1995, Granier and Breda 1996), and transpiration (Mott and Parkhurst 1991, Monteith 1995), which correlates with bulk plant water potential (Jarvis 1976, Hinckley et al. 1978). To address the primary objective of this study, it was necessary to relate Gs to RR, SWC and VPD. An empirical relationship between Gs and RR provides a convenient approach to describing the response of stomatal conductance to varying atmospheric conditions (Jarvis 1976, Sandford and Jarvis 1986, Whitehead 1998) (Fig. 7b).
The limitation to water use appeared to be due to major contributions of canopy or meteorological factors, as well as SWC. Stomatal conductance was positively related to bulk SWC, which is compatible with the hypothesis of hydraulic feedbacks (Garnier and Berger 1987). The surprisingly low sap flow rates at high VPD (22.68 hPa) were a consequence of hot conditions in June where predawn temperatures remained well above 25℃ , and relative humidity was as low as 27%. Therefore, stomata will close when the plant cannot sustain the rate of water loss driven by VPD. This suggests that all the empirical relationships established between Gs and VPD must have been influenced by the capacity of the soil-plant hydraulic conducting system. The relative insensitivity of SFD to high VPD could involve many changes related to transpiration, such as temperature (Idso et al. 1987), the water potential of foliage (Kellomaki and Wang 1996), xylem hydraulic resistance (Sperry and Pockman 1993) and water uptake of root systems (Kellomaki and Wang 2001). Early measurements of the foliage of Scots pine indicated that temperature elevation significantly reduced the sensitivity of stomatal conductance to decreasing foliage water potential under short-term water stress conditions (Kellomaki and Wang 1996), and to increasing VPD (Kellomaki and Wang 1997). It has been suggested that a feedforward response to soil drying involves the transport of a chemical message (abscisic acid) from roots to foliage, causing reduced stomatal conductance independent of leaf water potential (Wartinger et al. 1990, Tardieu et al. 1992).
In considering the influence on stomatal conductance, and hence transpiration, we have to note that there is strong evidence that the effect of leaf water status can be overridden, and certainly modified, by chemical signals from the roots, or by changes in the conductance of the hydraulic pathways (Landsberg and Gower 1997). The shorter term relationship between transpiration and soil moisture is not a suitable tool for this purpose either, because the formal statistical dependence reflects the fact that the soil is usually moist during rainy days, when transpiration is low as a result of low solar radiation/VPD which determines the energy available for evaporation from the forest stand. While SWC is not a good measure of available soil water, it is a very good indicator of the same, and has been used over ages to show drought and its influence.
At different timescales, RR, VPD and SWC are important interacting environmental controls in the water flux of a temperate deciduous forest ecosystem. A pronounced differentiation in water consumption was identified during a drought period compared to other periods. SFD and canopy stomatal conductance decreased during drought period (Figs. 2 and 5). Results showed that the stand transpiration correlated significantly with VPD and RR. Critically low soil water supplies reduce tree water use and influence sap flux densities with increasing VPD and RR (Fig. 5). Low SWCs resulted in increased stomatal sensitivity to increasing VPD. The influence of VPD on Gs was dominant over that of SWC and RR (Fig. 7). SWC had no control on Gs during the dry period when VPD was high. Perhaps