Ubiquitous sensor network (USN) technology allows a user to freely access the network anytime, anywhere and is one of the hot technologies studied around the world based on the "ubiquitous" paradigm for the IT environment [1]. A ubiquitous environment is based on the broadband wire infrastructure, and is implemented with the convergence with wireless techniques [2]. In South Korea, the government has played a leading role in performing various USN-applied projects since 2005 in the areas of construction, health, national defense, and logistics as well as environmental areas such as weather/marine observation, disaster observation, water resource management and agricultural product management [3, 4]. And some visible accomplishments of such projects have been appearing recently [5-8].
The USN system is built in a wireless sensor network environment, consisting of sensors supplied with limited electric power inaccessible under certain restricted poor conditions, thereby enabling it to manage surrounding environmental information such as temperature, humidity, pollution, and crack information [2, 4]. It is necessary to design a USN system taking into account failure permission, failure discovery, recovery techniques, and so on, so that failure of certain sensors does not prevent the automatic collection of data and does not have an impact on the whole system [9-15]. For USN systems using expensive sensors in harsh environments such as marine systems underwater or in the ocean, it is especially important to discover failure and devise recovery techniques to deal with such failure [16, 17].
Thus, this study, in order to modeling a failure of a coastal marine USN environment, analyzes the USN-based real-time water quality monitoring service built to manage the environment of Gaduri Aqua Farms at Songdo Island of Yeosu, South Korea [7], classifies failures into system element failures, communication failures, and data failures, and proposes recovery techniques. In addition, in order to identify data failures, data consistency and data integrity are defined, and the duration of stored data at the gateway stage are also suggested through implementing experiments using the data on observed marine water quality.
This paper is composed as follows. Section II covers the overview of USNs in general by introducing wireless sensor networks (WSNs) and USNs, the structure and technology of USNs, and some case studies for detection of USN failure and recovery techniques. Section III describes the analysis of marine USN systems on the characteristics of the marine environment, presents a case study of a marine USN application and a U-aqua farm environment management system used for modeling the failures of this study, which supplies real-time water quality information to Gaduri Aqua Farms at Songdo Island of Yeosu. Section IV, describing the identification of failures and recovery techniques, classifies failure into three types, defines data consistency and data integrity used in the identification of data failure, and presents experiments on consistency and integrity at the time of identifying data failures. Each recovery technique is drawn by the defined failure types. Lastly, conclusions and future research directions are stated in section V.
A sensor network consists of sensors that form a network, and is also known as a WSN or USN. Studies outside Korea on sensor networks generally use the term WSN instead of USN. The Ministry of Information and Communication of Korea uses the term USN in the IT839 strategy as a network that recognizes and manages the information of various objects by linking radio frequency identification (RFID) tags and u-sensors to broadband convergence network (BcN), thereby defining the basic infrastructure to realize an ubiquitous society by expanding existing human-oriented information to objects [4, 5]. Therefore, USN can be viewed as a broader concept that includes the concept of WSN. WSN is defined as realization of wireless-based sensor networks by combining wireless radio frequency (RF) technology such as Zigbee, Bluetooth, and Wi-Fi, and network technology such as ad-hoc and mesh networking to existing wire-based sensor nodes [1, 4].
The major functions of sensor network are noted in Table 1. This system is composed of sensor nodes equipped with sensors having various functions and transmits sensed information to synch nodes by a network using single-hop or multi-hop. The gateway, which receives data from sensor nodes and synch nodes, then transmits the sensed data to the server through an IP-based network (LAN, WLAN, CDMA, WiBro, satellite, etc.) in order to use various contents or services.
[Table 1.] Function of sensor network
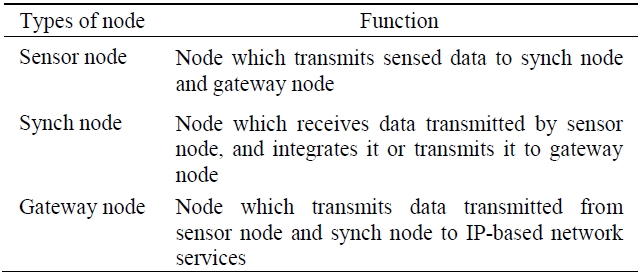
Function of sensor network
>
B. Structure and Technology USN
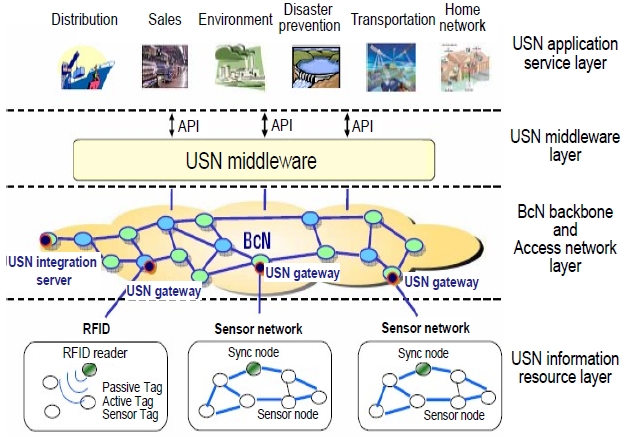
Fig. 1 shows the structure of USN, which senses information on objects and environment from RFID tags and sensors, stores and processes such information, and transfers it through the internet [5].
Sensor nodes are the basic elements comprising a USN and a network desired by users can be built of them using wire/wireless communication technology [1]; that is, various wire/wireless network technologies such as Zigbee, Bluetooth, ultra-wideband (UWB), Wi-Fi, serial, and ethernet can be used. A sensor node is a micro computing system that perceives, analyzes, and transmits information sensed in the environment and physical world and consists mainly of a microcontroller unit (MCU), wireless communications unit, sensor unit, and electric power unit. A synch node is a system that collects data sensed by the sensor nodes, links to event-type data outside of the sensor network, manages the relevant sensor network, and is usually a system with a bigger hardware and software capacity than that of the sensor nodes [1]. Gateway, a system linking an IP-based network (LAN, WLAN, CDMA, WiBro, Satellite, etc.) and sensor network, is located between the synch nodes and existing service network. If necessary, the synch nodes can be installed within a gateway [1].
USN technology includes wireless communication technology, server-level USN middleware technology linking USN to a management and information system, sensor node middleware technology, the recently-emphasized USN information protection technology, and USN application technology realized by using all the technologies [1, 2, 18].
>
C. Case Studies of USN Failure Detection and Techniques for Recovery
Failure of the sensor nodes and sensors, which are the core elements of a USN, may cause plenty of problems for maintaining the quality of services within the network, and in the worst case may even bring entire network system failure [9]. The failures that can occur at the sensors and sensor nodes may be classified into hard failures including electric power depletion and hardware part failure, and soft failures including calibration errors and random noise errors of various sensors installed at sensor nodes. There are cases in which a failure detection algorithm, the type that combines the consensus algorithm and localized faulty sensor detection (LFSD) algorithm, which can detect both the hard failure and soft failure simultaneously [9].
There are also studies on techniques for recovering sensors in the failed gateway, rather than shutting down the system or re-clustering the whole system, when a failure occurs in the multi-tier structure of a wireless sensor network. This recovery technique is to re-associate the sensors managed by the failed gateway to other clusters based on the backup information created during clustering by checking the status of the gateway periodically [10, 11]. There are also case studies permitting through proposing a heterogeneous backup schema that replaces a type of sensor with another type of sensor, based on the fact that a sensor node has a high rate of sensing failure for a sensor network permitting low overhead failure [12].
Sensor nodes with limited communication bandwidth and electric power must perform cooperation, which is an effective way to maintain communication and electric power and is resistant to failure. From the perspectives of communication cost, precision, accuracy, and number of recoverable failure sensors in the sensor network, value fusion and decision fusion have each been suggested as an effective cooperation-type target detection algorithm. The value fusion algorithm has better performance when no sensor node failure occurs, while the decision fusion based algorithm is preferred for lower communication overhead when a failure occurs. To improve detection performance, a study on the optimum arrangement of sensors in an area of interest is also necessary [13].
However, the above mentioned studies lack consideration for the harsh marine environment where failure frequently occurs due to the environmental changes and its difficulty for recovering the failure. Also, the problems of data failure, which is the main focus of this study, are not stated in that report.
III. ANALYSIS OF A MARINE USN SYSTEM
>
A. Characteristics of a Marine USN
A marine USN is a system that recognizes marine resources or their environment by installing sensor nodes fixed either on the ocean floor or underwater, builds and manages real-time information through network, and allows a user to control and manage it on the ground [16, 17].
A marine USN is a kind of wireless sensor network that combines undersea wireless communication technology and sensing technology, and links undersea wireless communication technology to ground communication. It is difficult to directly apply land-based sensor network technology to marine USNs due to the characteristics of their environment. In a marine USN, compared with the general land-based USNs, sensors and sensor nodes are more expensive and more difficult to deploy, so it is necessary to design a network with sufficient ruggedness and reliability.
Marine sensors currently in commercial use are especially big, heavy, and mostly expensive, and their power consumption is generally not small. Marine sensor units rapidly corrode, with undersea life and salinity often shortening their lifespan [16]. Since a marine USN has to efficiently manage an expensive marine sensor system placed in a harsh environment such as under the sea, it is necessary to develop a technology to discover and recover from failure rapidly.
A marine USN, for the purpose of efficient data transmission under limited environmental conditions, should have strengthened performance including that of local data storage, and it also becomes necessary to develop a node management function that properly adjusts the sensing and transmission interval [16].
>
B. A Case Study of a Marine USN
In order to develop business models, USN application services have been performed since 2005 under an initiative of the government of Korea by applying USN technology to various objects and environments. Table 2 shows Korean field tests and pilot projects in which USN technology is applied to marine areas [4-8].
[Table 2.] Marine USN field tests and pilot projects
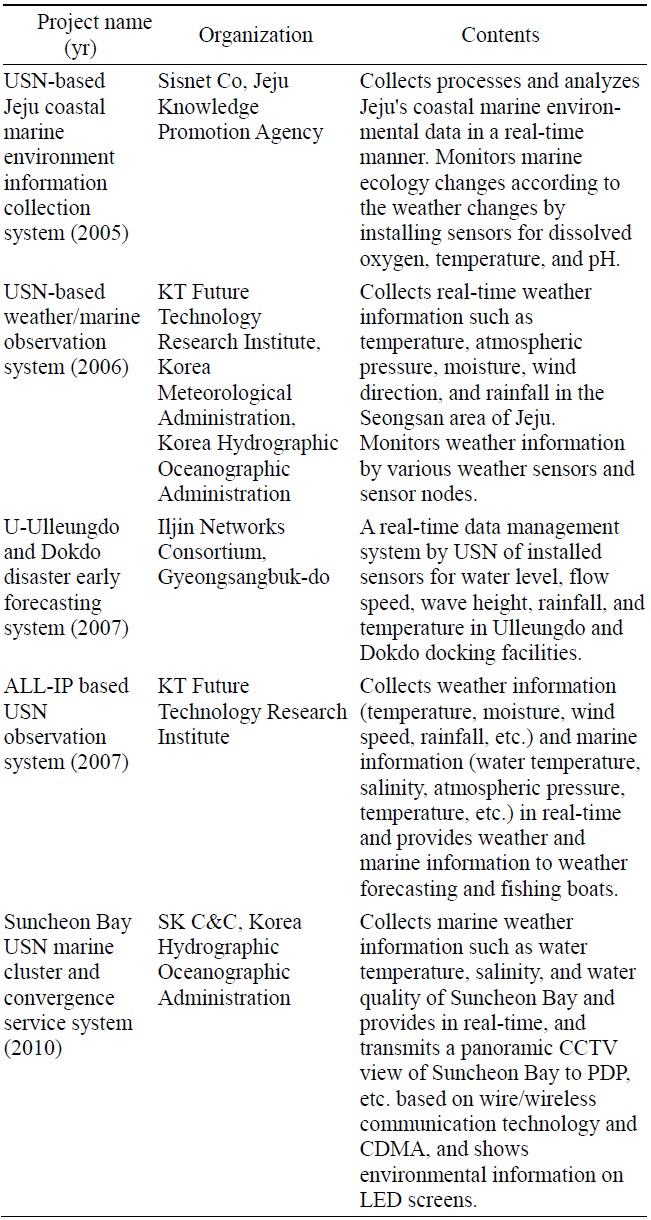
Marine USN field tests and pilot projects
In the USN-based Jeju costal marine environment information system, buoys mounted with Zigbee sensor nodes are installed and marine environment information is collected through USN. This USN based weather and ocean observation system has been applied as a pilot program of wireless mesh network technology in islands and ocean areas where it is difficult to expand existing network infrastructure. In the U-Ulleungdo and Dokdo disaster early forecasting system, data measured by sensors can be transmitted to, stored in, and managed by servers in real-time through a high speed internet network and CDMA. In the ALL-IP-based USN observation system, an IP-USN and wireless mesh network were introduced as a pilot program to build a USN-based observation network. Also, data is transferred to the server through sensors, gateways, a wireless mesh network, and an internet link. In the Suncheon Bay USN marine cluster and convergence service, an 800 MHz-bandwidth CDMA wireless network and wire/wireless private network were built so that various observation devices installed in Suncheon Bay can collect data and provide information in real time.
The feasibility of the pilot projects in Table 2 was verified by applying them to public sectors such as weather/marine sectors with high utilization of and demand for a USN and the projects contributed to the popularization and promotion of the USN. These service models were proposed a way that involved installing a sensor node and gateway as a link between the sensor network and network infrastructure. Also, it was proven that a wireless mesh network could be used as the infrastructure for a USN installation area in which it was difficult to build wire networks [5].
>
C. System Analysis for Failure Modeling
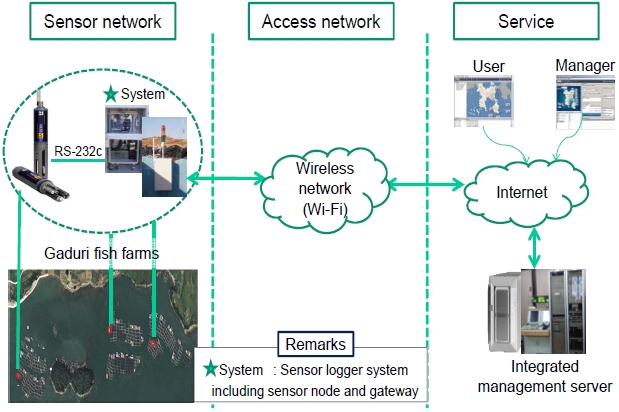
For modeling of failure-tolerant functions and failure-recovery techniques of marine USNs, we investigated and analyzed a U-aqua farm environmental management system, which is a marine water quality environmental monitoring system for Gaduri Aqua Farms at Songdo Island of Yeosu [7]. Fig. 2 shows a diagram of the U-aqua farm environment management system.
Three sets of sensors and sensor logger systems have been built in the neighboring area and inner area of the Gaduri Aqua Farms. A sensor logger system collects information sensed by the sensors and stores it in a self local storage to prevent any data loss. The data in the sensor logger is transmitted to the integrated operation server through the wireless mesh network, and now, the services providing water quality environment information become available over the website. The wireless communication-type sensor logger system consists of water quality sensors measuring the water quality environment, sensor nodes managing the data received from the sensors and performing a defined data protocol transformation, and a gateway linking sensor node to the communications network.
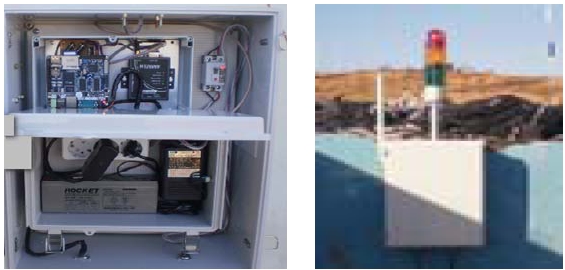
Fig. 3 shows the interior and exterior of the sensor logger system. As a marine water quality sensor is expensive, and it is costly to install multiple sensors, we provided storage space for the sensor to store sensed data for a certain period of time.
IV. FAILURE IDENTIFICATION AND RECOVERY TECHNIQUES
>
A. Classification of Failures
In the test system for failure modeling, data is transmitted from the sensor via a sensor logger containing a sensor node and gateway, to the access point (AP) and database server. As marine water quality environmental data should be transmitted with accuracy, the transmission should recover quickly from errors when failure occurs. In this study, the types of failure are classified into system element failure, communication failure, and data failure.
1) System Element Failure
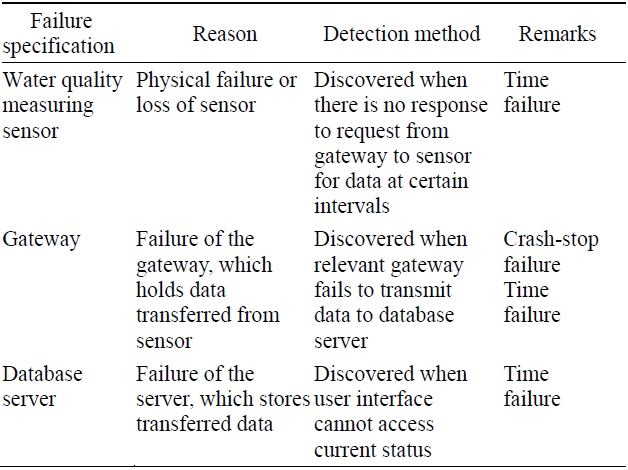
System element failure is caused by hardware or software failure. System failure is classified, based on the types of devices, into that of a sensor, that of a sensor logger containing a sensor node and gateway, and that of a database server, as shown in Table 3. The remark column in the table notes the types of failure on the existing distributed system that were studied. Sensor failure occurs where a sensor physically fails due to conditions such as salinity or is lost by a sea current, typhoon, etc., and can be measured by whether there is a response to the gateway's periodic request for data. Sensor logger failure is a failure of the system to transmit certain data to the server and can be discovered by using a timeout from the server to the gateway. Lastly, failure of the database server can be discovered by failure to service the stored data for a long period of time.
[Table 3.] System element failure

System element failure
2) Communication Failure
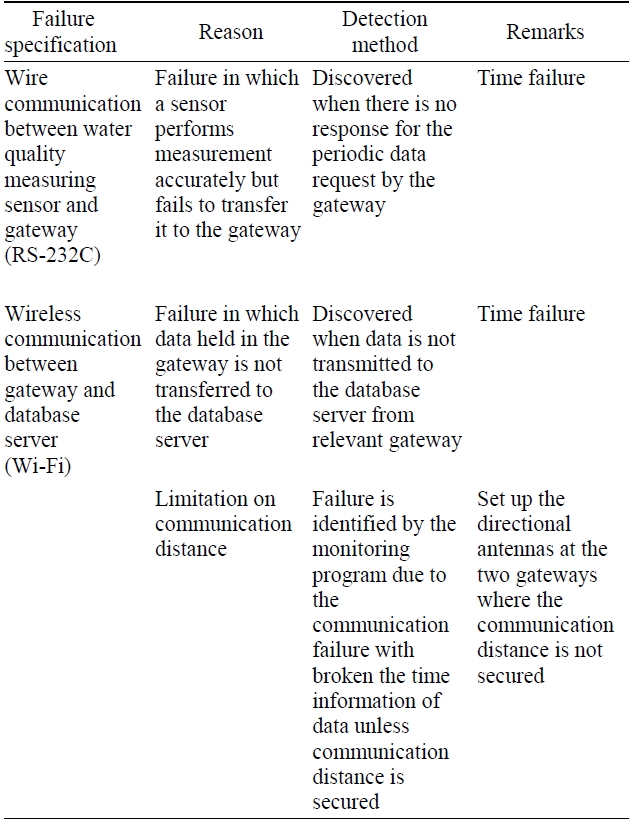
Communication failure occurs in the process of data transmission using a wire/wireless communication network. The categories of communication failures that we noted include the following: the failure in updated recent data is not transmitted due to a cable failure in the wire communication between the water quality measurement sensor and sensor node, the failure in which the data maintained at the gateway is not transmitted to the server in the communication between the gateway and AP, and the failure that occurs due to a propagation collision caused by interference. This article focuses on the communication failures shown in Table 4.
In case of wire communication (RS-232C) between a sensor and sensor node, a failure can occur in which data is not transmitted to the gateway, even though the sensor measures the data correctly. The gateway is not easily accessible as they are installed in a harsh environment; therefore, a timeout method is established, and a failure is identified when no response is made at the periodic data request to the sensor from the gateway.
[Table 4.] Communication failures

Communication failures
For the wireless communication (Wi-Fi) between the gateway and database server, first, failure occurs when the data maintained at the gateway is not transmitted to the server, and is identified when no data transmission is made from the database server to the corresponding gateway. By installing a timeout, a failure is identified when no response is made at the periodic data request to the sensor from the gateway. Secondly, unless the communication distance is secured, a communication failure occurs and the date or year of the data is transmitted broken and this can be checked by a monitoring program.
For the U-aqua farm environment management system, two out of three gateways are currently placed at positions in excess of the designated distance from the database server, so a directional antenna was installed at the database server. However, the problem of limited distance is not solved in uncertain situations (due to rain, wind, etc.) so sometimes the date or year of the data is still transmitted broken.
3) Data Failure
For the U-aqua farm environment management system, data failure occurs in the course of data transmission, and accurate data is not transmitted. In other words, the data generated in the unit element and received data are either inconsistent, or against integrity, which is described in Table 5.
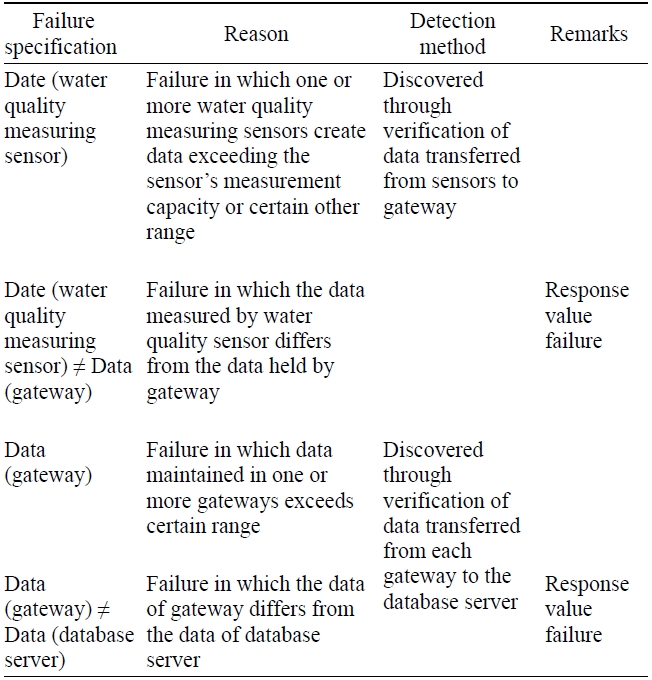
Data failure
In particular, for the marine water quality data, data failure can be identified whether or not to satisfy consistency and integrity as defined below.
Definition 1. Consistency of marine water quality data
The data measured from m number of marine water quality sensors is defined as

where,
In the above definition 1, the constants proposed α, β, and r can be created by statistical analysis reflecting seasonal elements of measured water quality data, etc.
Definition 2. Integrity of marine water quality data
When the data measured from

where
In definition 2, the constants
From the previous two definitions, data failure can be identified on the basis of whether the measured marine water quality data meets conditions for consistency and integrity. Meanwhile, in order to identify such failure, it is necessary to hold data for a certain period of time. The length of much time necessary can be decided by
>
B. Experiment to Verify Data Failure
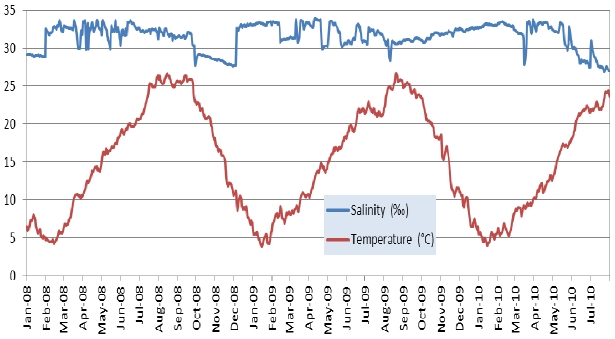
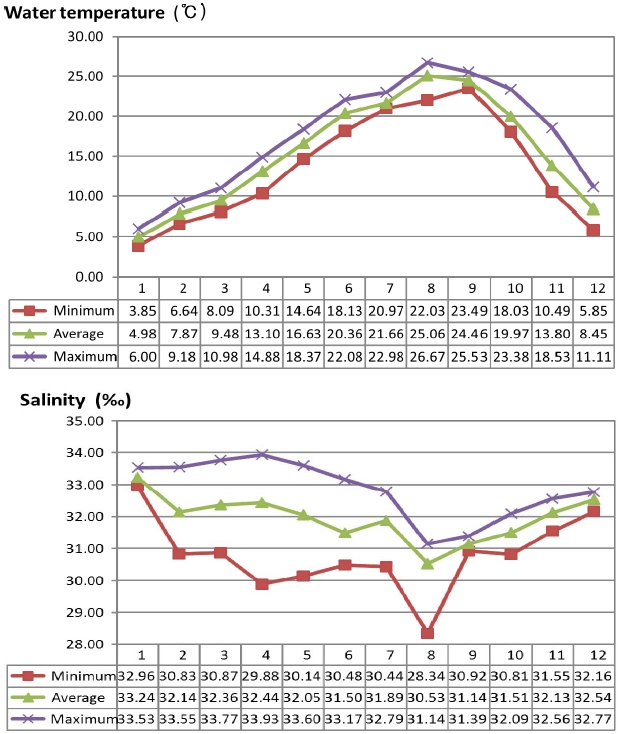
The data used in the experiment is the marine data of the Goheung Wave Level Observatory Station provided by the Korea Hydrographic and Oceanographic Administration [6]. The station collected environmental data, the daily mean values of hourly observed data including temperature, water temperature and salinity from January 1, 2008 to July 31, 2010. Fig. 4 shows the data collected for water temperature (℃) and salinity (‰) used as our experiment data.
In order to designate the upper and lower limits of integrity, we refer the maximum and minimum value of water temperature and salinity as shown in Fig. 5.
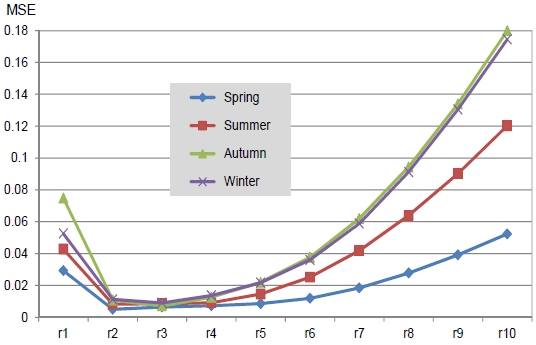
Next, the consistency verification experiment with regard to water temperature was performed. First, in order to decide on the
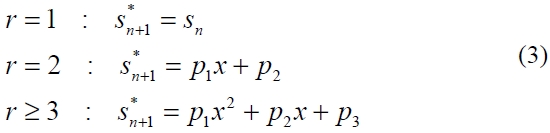
where the parameters
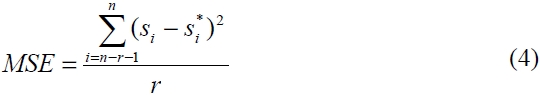
As a result, most graphs become forms of values increasing to the degree that
From Fig. 6, we can confirm that the value is decreasing when
Thus it is presumed that, as regards holding data in the gateway for a certain period of time, accurate information can be provided to the server if the data of two days are held under the condition of
In order to verify the consistency of the water temperature,

For the consistency of salinity, by applying the same manner as that of water temperature, we defined

The difference between

For the integrity of definition 2, the following equations have been designated for the water temperature and salinity from the data of 12 months. The range of water temperature is wider than that of salinity; that is the range of fault permission is large for water temperature. In order to solve this problem, we can reduce the range of fault permission by separately defining the integrity of the water temperature for each season. Eq. (8) and (9) show the lower bound and upper bound for defining the integrity of March 2009 to May 2009.


>
C. Identification Process of Data Failure
The process of identifying data failure by using the defined consistency and integrity is as shown in Figs. 7 and 8.
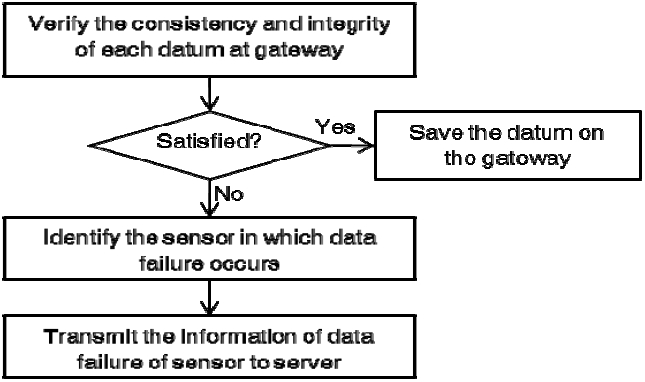
Since it is not necessary to define the integrity and consistency for the detecting only the sensors, the integrity and consistency verification is carried out with regard to the measured data from the sensors at the gateway stage in the method shown in Fig. 7. Through such verification, the failure of the sensor can be discovered by violation of the above, and can be identified by notification of such failure to the server.
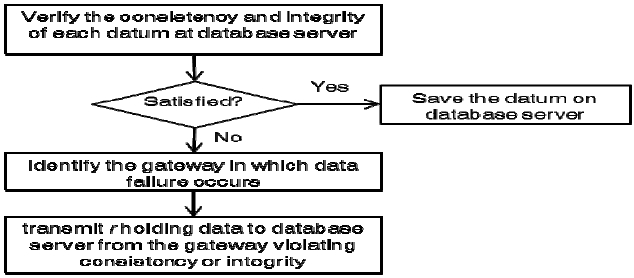
Next, at the database server, we can identify the gateway that causes the data failure through the process shown in Fig. 8.
>
D. Recovery Techniques by Failure Type
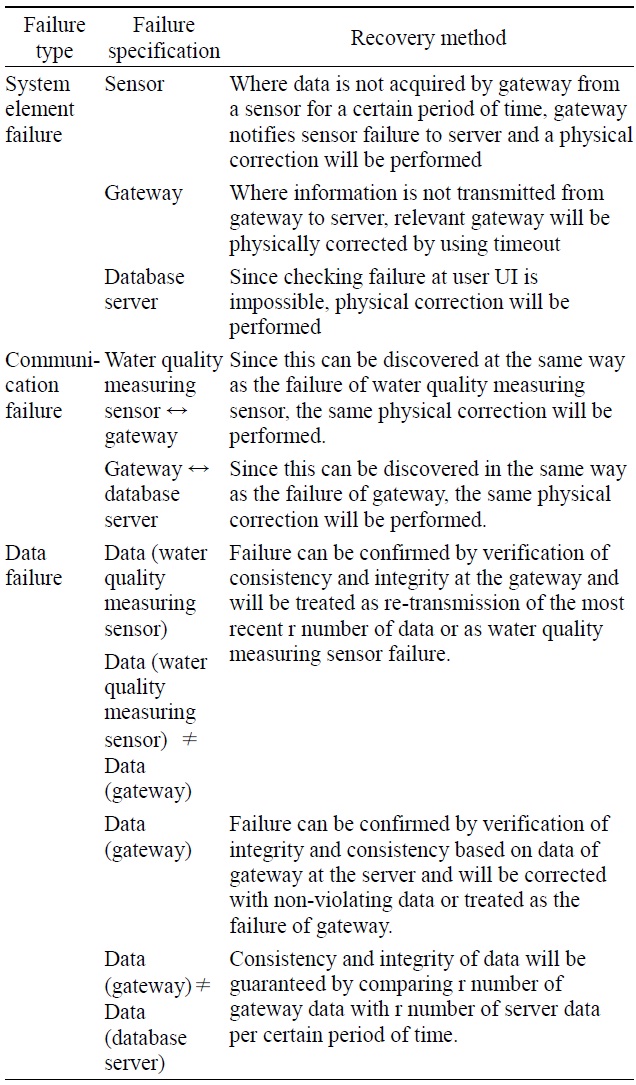
Relevant recovery for previously analyzed failure can be performed by identifying the exact type of failure through cause analysis of the failure mentioned above. Table 6 provides a summary of the proposed recovery techniques.
[Table 6.] Recovery techniques by failure types

Recovery techniques by failure types
It is very important to discover failure in a marine USN system using expensive sensors in a harsh environment such as underwater or in the ocean and to devise recovery techniques as a method for dealing with the failure.
Thus this study analyzed the ‘USN-based real-time water quality monitoring service’ in Songdo Island of Yeosu built to manage the environment of Gaduri Aqua Farms and performed modeling of the failure of a coastal marine USN environment. Failures were classified into system element failures, communication failures, and data failures, and the methods of discovering the cause of failure and the method of recovering from them were proposed. In particular, to solve errors from the perspective of data, integrity and consistency of data were defined for use in identifying data failure.
Also, this study proposed guidelines to implement for recovery in accordance with the types of failure identified through the analysis of failure causes. In addition, the suggested length of time to hold data in the gateway stage in the case of data failure was determined through experiment.
In the future, studies on handling data quality to secure accuracy and high quality of marine water quality environmental data transmitted from the sensors to the sensor nodes, gateway, AP, and server will be performed.


![Structure of ubiquitous sensor network (USN) [5]. API: application program interface, BcN: broadband convergence network, RFID: radio frequency identification.](http://oak.go.kr/repository/journal/11041/E1ICAW_2012_v10n1_11_f001.jpg)