Currently, one of the most notable micro-blogging services is Twitter. Twitter is used by many people as a tool for spreading their ideas, knowledge, or opinions to others. Users in Twitter are usually dubbed “twitterers,” and they can publish “tweets” through a variety of media to others. Twitter has been gaining huge popularity and also increased interest from researchers [1-4]. In recent years, interest among researchers has increasingly focused on whether or not influential people have the power to influence a large number of others in social networks [5-10]. Recently, Twitter users and applications have been considering a twitterer’s influence to be measured by the number of followers the twitterer has [11-13]. The popularity of a twitterer depends on the number of followers [6,9]. The question is, are people with many followers on Twitter influential people in their community? How many times have they have they received coverage in the news media? We are interested in identifying people who are influential in both social networks and the news media.
In this paper, we quantify the influence on Twitter and the news media based on influential twitterers and present an empirical analysis. To do this work, we gathered top users’ data from Twitter based on the number of followers. We then searched news articles in the online news media using keywords that were collected from top users’ names from Twitter. These two datasets gathered from Twitter and the news media were analyzed to find a good indicator of influence. To investigate the correlation between influential twitterers who were also influential in the news media, we evaluated the correlation coefficient. Using these values, the influence scores were measured by our proposed approach in order to obtain the value of influence on Twitter and in the news media.
The rest of this paper is organized as follows. The datasets were prepared for the purpose of this study. We provide an overview of the collected data and show the preliminaries in section II. Section III elaborates on the analysis of data and the methodology for estimating user influence. In section IV, we present the quantifying influence score and the empirical results. Finally, we summarize our research and suggest some directions for future work in section V.
II. DATA PREPARATION AND PRELIMINARIES
For the purpose of this study, a set of Twitter data was prepared on January 27, 2012. We collected the global top 100 users on Twitter. The global top 100 users have the largest number of followers worldwide. For the Twitter collections, we have removed all the organizations to select only individuals as influential twitterers. The top twitterers were ranked by the number of followers. After removing all organizations from top 100 users in Twitter, 80 individuals remained. We use the 80 individuals as our basic dataset in this study. In order to obtain the total number of news articles published that included each name in the global top 80 twitterers, we chose the New York Times (NYT) as our sample. We gathered news articles dating from January 28, 2011 to January 27, 2012 through the NYT’s search page.
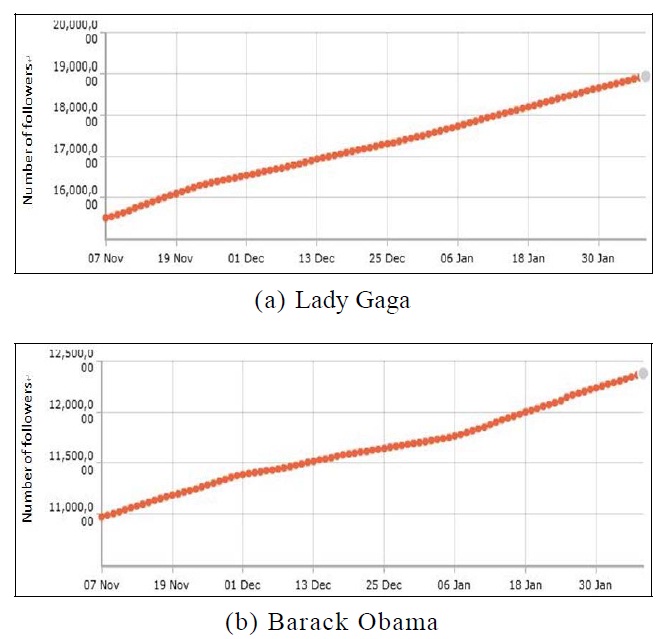
As an example, it may be worthwhile to consider how many followers Lady Gaga lost or gained. With regard to the number of followers, the statistics can help us to discover a twitterer’s influence. Fig. 1 shows the rapidly increasing number of the most popular twitterer’s followers. For example, the number of Lady Gaga’s followers was 15,685,045 on November 11, 2011 and after 3 months it was 19,030,903 on February 10, 2012. Over those 3 months, the number of her followers increased by 3,345,858 as shown in Fig. 1a. Fig. 1b shows that a similar increase appeared in the case of President Barack Obama of the United States.
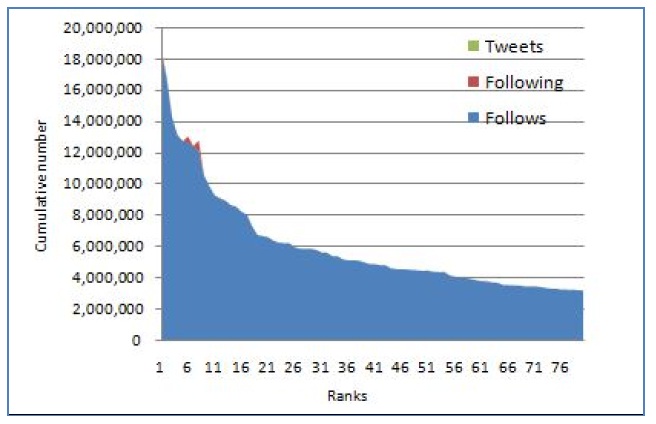
The top 5 users on Twitter ranked by the number of followers are shown in Table 1. The number following and tweets are also shown in Table 1. Even though all of the top 5 users have a large number of followers, they follow few others and have few tweets. There is a large difference between the number of followers and the number following and number of tweets. Fig. 2 shows the top Twitter users who are ranked by the cumulative number of followers, following, and tweets. As shown in this figure, the number of followers captures almost entirely the cumulative distribution.
[Table 1.] Units for magnetic properties top 5 twitters ranked by the number of followers
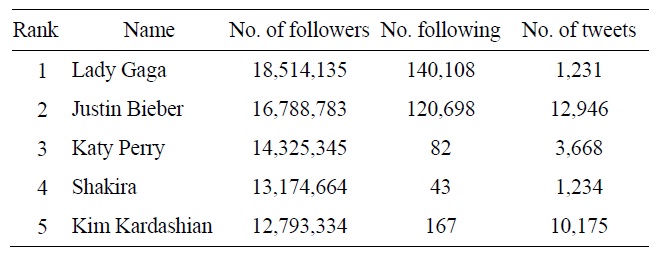
Units for magnetic properties top 5 twitters ranked by the number of followers
To understand the features of the datasets from Twitter and the NYT, we first analyze the datasets.
>
A. Basic Analysis of Twitter Data
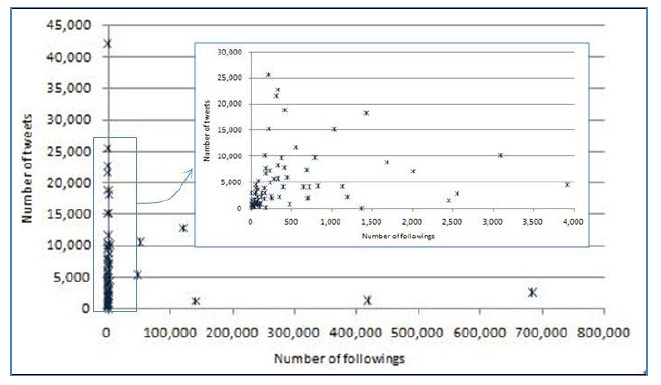
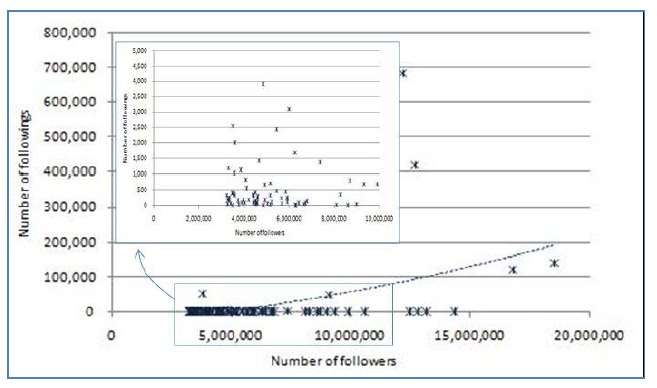
Fig. 3 displays the number following against the number of followers in Twitter; the inside figure shows the number following around 5,000,000 followers in detail. Barack Obama is ranked 8 by the number of followers, and has the most number of 683,249 following. On the other hand, Marshall Bruce Mathers III (Eminem) has the least number others he is following, and he is ranked 15 by the number of followers.
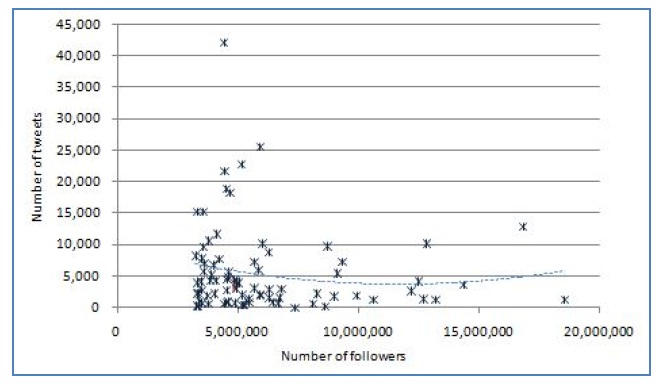
We plot the distribution between the number of followers and that of tweets in Fig. 4. Fig. 5 shows the number of tweets against the number following; the inside magnified figure displays a scale of around 500 following. We can see that there is little correlation between the number of followers, the number of others following, and the number of tweets as shown in Figs. 3-5 and as pointed out previously.
>
B. Basic Analysis of NYT Data
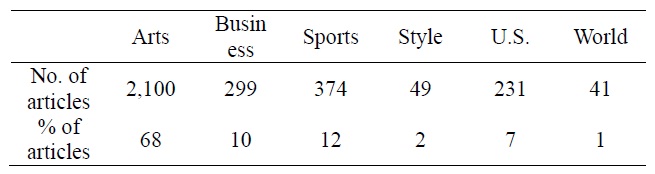
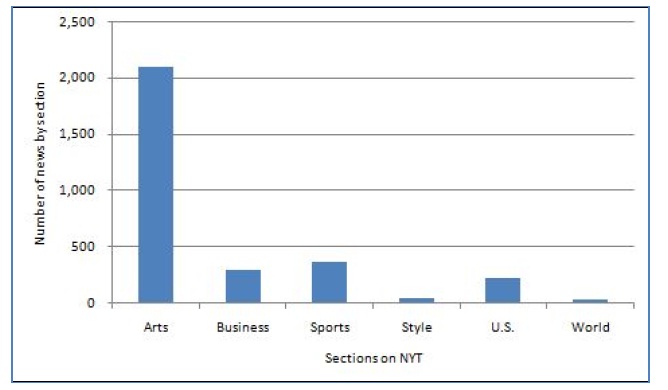
For each of the top 80 twitterers, in order to investigate the number of news articles covering them in the NYT, we queried by the name of each of the top 80 twitterers. Table 2 shows the number of news articles for each section. As we can see from the table, the largest number of news articles that covers the 80 twitterers is found in the Arts section. This means that many popular Twitter users are engaged in the arts. We can see a major difference between the total number of news article in the Arts section and that of others as shown in Fig. 6.
[Table 2.] Proportion of news articles in the New York Times queried by the top 80 twitters

Proportion of news articles in the New York Times queried by the top 80 twitters
>
C. Methodology for Estimating User Influence
1) The Spearman’s Rank Correlation Coefficient
It is not easy to determine whether influential twitterers are also influential or not, even in the news media. Correlations are useful because they can indicate a predictive relationship that can be exploited in practice. In order to quantify correlation, we computed the correlation coefficient between the two different datasets. We used the relative order of users’ ranks as a value of the difference. Each value was sorted, so that the rank of 1 means the most influential user and increasing rank indicates a less influential user. Every user is assigned a rank for each influence measure. Here the Spearman’s rank correlation coefficient can quantify a user’s rank varies across different values. We use the Spearman’s rank correlation coefficient as a measure of the strength of the association between two rank sets:
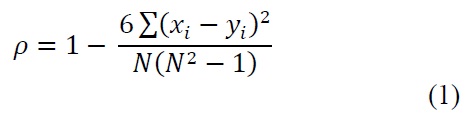
The variables
2) Influence Score
We can compute the influence scores of the users based on the Spearman’s rank correlation coefficient. To do so, we define the influence score (
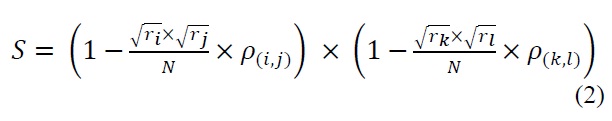
This value
IV. QUANTIFYING INFLUENCE SCORES
We describe the correlation between the top users’ ranking in Twitter and their ranking in the NYT. Normalized influence scores are computed for each of the top twitterers and each of them in the NYT.
>
A. Distribution of the Top Twitter Users and Exposure in NYT Articles
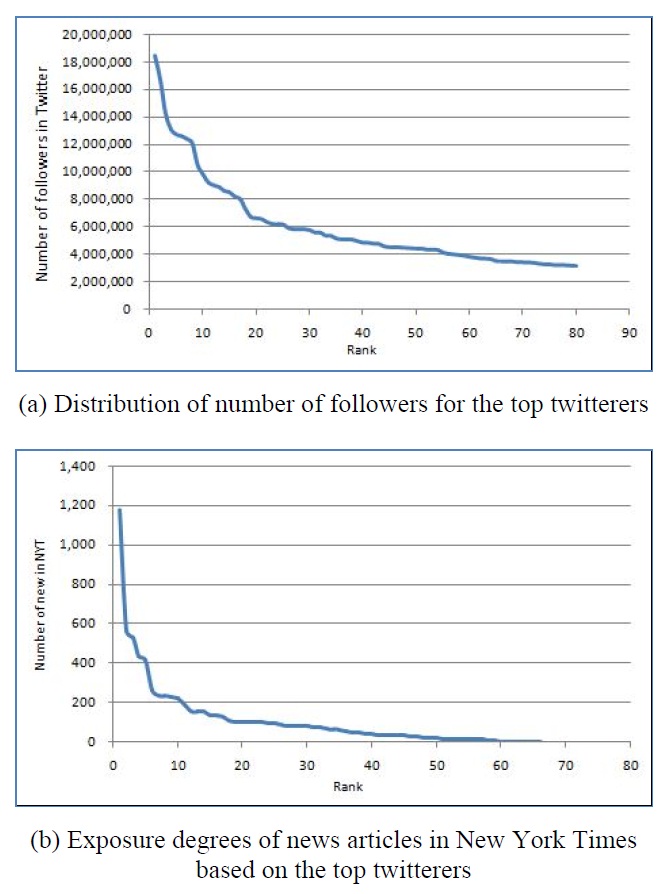
The top 80 twitterers ranked by the number of followers are showed in Fig. 7a. We found the number of news articles that mentioned the names of the top 80 users and sorted the number of new articles. Many of the people who are exposed in the NYT relatively frequently can be referred to as celebrities. The distribution of the celebrities is shown in Fig. 7b.
>
B. Comparing Twitter and NYT based on the Top Users in Twitter
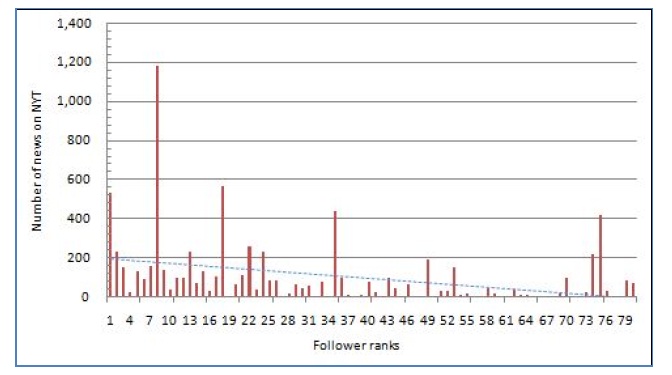
The top 5 users by the number of followers and corresponding rankings by the number of news articles are listed in Table 3. We can see that the high rankings in Twitter are not necessarily high in the NYT in Table 3. Fig. 8 shows the number of news articles against the ranking by the number of followers. This figure means that the popularity of users in Twitter is not proportionate to the amount of exposure in the NYT.
[Table. 3.] Comparison of the top users between Twitter and New York Times
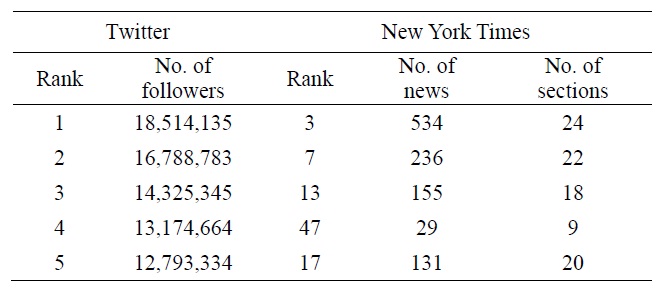
Comparison of the top users between Twitter and New York Times
>
C. Estimating Correlation Coefficient
In order to investigate how the two pairs correlate, we compare the relative influence ranks of all 80 users. We compute the correlation coefficient as shown in Table 4 by the Spearman’s rank correlation coefficient. The value 0.52 in Table 4 is the correlation coefficient between the number of followers in Twitter and the number of news articles in the NYT. We see a moderately high correlation (above 0.5) across all pairs.
[Table. 4.] Spearmans’s rank correlation coefficient
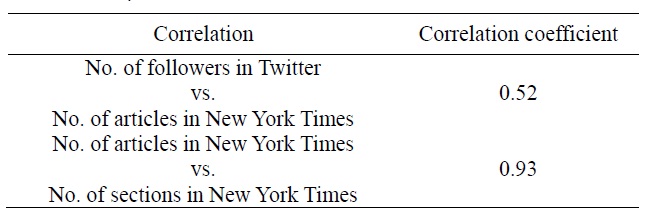
Spearmans’s rank correlation coefficient
>
D. Measuring Influence Score on Twitter and NYT
The popularity of a Twitter user can be easily measured by the number of followers. However, the number of followers in Twitter alone cannot be a measure for estimating influence. We computed the influence score using our proposed expression as defined in section III. The top 20 users by the influence score are listed in Table 5. Lady Gaga ranks 1 after measuring the influence score and Barack Obama’s ranking went up in the second place due to the large amount of exposure in the NYT.
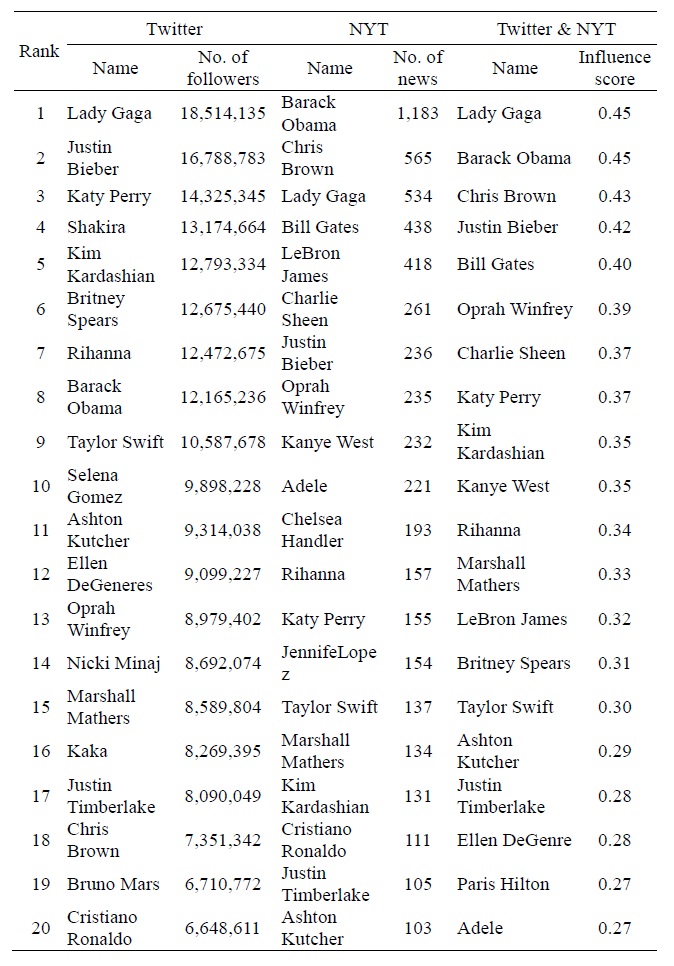
Top 20 users ranked by # of followers, top 20 users ranked by number of articles and top 20 celebrities ranked by influence score
Social media has been growing explosively and provides users the opportunity to share various types information and knowledge in real time. Twitter is one of the most popular social networks on the internet. The popularity of these social networks can be measured by the number of followers. The influence, which is, the individual’s potential to lead others to engage in a certain act, can also be determined by many factors. For studying influence, we prepared a set of global top twitterers’ data and collected news articles mentioning each of their names from the NYT. The number of followers is a significant factor for measuring influence. The exposed number of users in the news media is an important factor used to estimate the influence. We chose Twitter and the New York Times as representative media to analyze the influence. To understand the features of these two datasets, we analyzed the datasets and presented the results. We show that the correlation between the number of followers and the number of top twitterers with strong exposure in the news media is moderately high. The correlation between the exposed number of top twitterers and the number of sections including them is very high. Our proposed expression using these two correlation coefficients computed the influence score for each of the top twitterers ranked by the number of followers. This normalized influence score opens the possibility for discovering influential individuals within all of the social networks and news media.