The dye-sensitized titanium dioxide (TiO2) photoelectrochemical solar cell has attracted much attention due to its low cost, simple fabrication process and reasonably good conversion efficiency [1-3]. In general, the porous semiconductor film consists of a large collection of nano-sized particles of a metal oxide interconnected by meso-sized pores, deposited onto the conductive surface of a transparent electrode. This porous metal oxide film acts as a high surface area support for the sensitizer, a pathway for electrical current and a porous membrane for diffusion of the redox couple [4-6]. The high surface area of the nanocrystalline TiO2 film plays a crucial role in increasing the performance of the photoelectrochemical cell in energy conversion.The available surface area for dye absorption can be enormous in highly porous films of a few micrometers thickness, leading to near extinction of incident light.
A suitable degree of porosity is also another important factor.The pore structure must permit the penetration of the electrolyte containing the redox couples, and permit an effective mass transport of electroactive species by diffusion to guarantee the regeneration of the oxidized dye [7]. Furthermore, the porous film must exhibit interconnected particles, to allow the percolation of injected electrons. The crystallinity of the particles (and the extent of defects) also influences the injection of electrons and their transport through the network of particles in the film[8]. Li et al. [3] reported sol-gel-derived TiO2 thin films for solar cell application, where they showed that nanocrystalline layers of high surface area and a prerequisite for good solar cell performance could be achieved by the sol-gel process. The sol-gel process may also allow more precise control of film thickness,particle size, and porosity by adjusting different parameters,such as sol concentration, and annealing temperature. We have attempted the sol-gel method for the preparation of TiO2 films using titanium tetra-isopropoxide for dye-sensitized solar cell(DSSC) application. Appropriate control over particle size, morphology and the active surface area plays an important role in the application of TiO2 thin films.
The aim of the present work is to obtain nano-sized TiO2 with improved properties that can be used for the development of the photoanode in DSSCs. Special attention is paid to changes in
the microstructure and surface area of TiO2 as a function of the preparation procedure.
TiO2 powder was synthesized by the sol-gel method. 25 mL of titanium tetraisopropoxide (TTIP) was dropped into 250 mL of 0.1 M HCl aqueous solution while stirring at room temperature.Next, the resulting slurry was sonicated and stirred repeatedly for 24 hours. TTIP was dissolved in Millipore water while stirring continuously at ambient temperature and maintained for 2 hours. Centrifugation was performed with a relatively high 4,000 rpm to remove the ethanol. The resulting particles were washed with deionized water three times and dried by freeze-drying. Finally,the powders were sintered at 450°C for 30 minutes in air for crystallization. TiO2 colloidal paste that consisted of synthesized TiO2 powder, polyethylene glycol and triton X-100 was cast onto the pre-cleaned fluorine-doped tin dioxide (FTO, Asahi Glass, 13Ω/cm2) using the squeeze printing method. The coated TiO2 film was heat-treated at 450°C for 30 minutes with a heating rate of 5°C /min. The printed TiO2 film thickness was 10 ㎛, and the active area of the photoelectrode was 0.8 × 0.8 cm2. Platinized FTO,which is similar to that of the photoelectrode onto the FTO substrate,was fabricated using the squeeze technique of the Pt-Sol(Pt catalyst/SP, Solaronix). The obtained photoelectrode TiO2 layer was immersed into the ethanol solution of bis(isothiocyanato)bis(2,2’-bipyridyl-4,4’- dicarboxylato)-ruthenium(II)-bis-tetrabutyl ammonium (N719 dye, Ruthenium 535-bis TBA, Solaronix,0.5m mole) for 24 hours. The electrolyte solution consisted of 0.3 M 1,2-dimethyl-3-propylimidazolium iodide, 0.5 M LiI, 0.05 M I2 and 0.5 M 4-t-butylpyridine in 3-methoxypropionitile.
The crystallinity and crystal phase of the TiO2 film were evaluated by a powder X-ray diffractometry (XRD, Rigaku, RINT2000/PC) using CuKα radiation. The primary crystallite size of TiO2 was calculated from the full width at half the maximum of the XRD peak at 2θ = 25.4° using Scherrer's equation. Extended X-ray absorption fine structure (EXAFS) was used R-XAS (Rigaku, Japan)with Ti k-edge energy (4966.4 eV). The Brunauer-Emmett-Teller(BET) surface area was determined by a nitrogen adsorptiondesorption apparatus (Quantachrome, Autosorb-1). Pore size distribution, pore volume and porosity were also determined by the Barrett-Joyner-Halenda(BJH) method of nitrogen desorption measurements. The film thickness was measured by a profilometer(Veeco, dektack3). The microstructure of films was studied by field emission scanning electron microscopy (FE-SEM, S-4700;Hitachi, Japan).
The sandwich-type solar cell was assembled by placing a platinum-coated conducting glass (counter electrode) on the N719 dye-sensitized photoelectrode (working electrode), and clipped together as open cells for measurements. Sealed cells were also tested in this study. The two electrodes were separated by a surlyn spacer (25 ㎛ thick) and sealed by heating the polymer frame [9]. The redox electrolyte was introduced into the space of
inter-electrodes through the two holes pre-drilled on the back of the counter electrode. The two holes were sealed using a surlyn film, on which a glass slide was pressed under heat. The redox electrolyte used was 0.1 M LiI, 0.05 M I2, 0.3 M dimethyl propyl imidazolium iodide, and 0.5 M tert-butylpyridine in dried acetonitrile.The current-voltage characteristics of the cells were measured with electrochemical workstation (CHI 660A, USA).An AM1.5 solar simulator (Thermo-Oreal with a 1000-W Xe lamp and an AM 1.5 filter) was employed as a light source. The incident light intensity was calibrated with a standard Si solar cell produced by Japan Quality Assurance Organization (JQA). Four parallel samples for each kind of layer structure were made for J-V measurement, and the reproducibility of TiO2 photoelectrode was quite good.
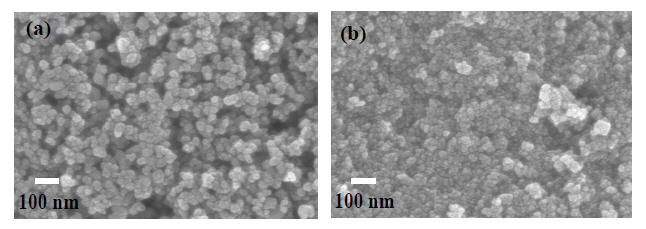
Figure 1 displays SEM images of a commercial TiO2 film deposited on FTO glass and synthesized TiO2 film. The TiO2 spherical nanoparticles are well distributed and the film has a porous structure, in which the nanoparticles are all bonded together through a sintering process. Such a porous structure permits the adsorption of a greater number of dye molecules and the formation of networking among the TiO2 intramoleculars. The synthesized TiO2 film is smoother than the P25 film and appears to have smaller crystallites.
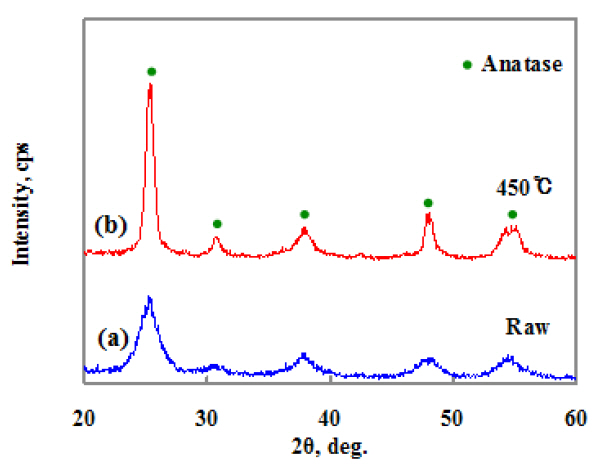
Figure 2 shows the XRD patterns of the synthesized TiO2. Figure 2(a) is the XRD pattern of the TiO2 synthesized without heat-treatment. Figure 2(b) is the XRD data of the sintered TiO2 particle at 450°C for 30 minutes in air. Figure 2 shows heat-treatment is necessary to improve the crystallinity and the synthesized particles have an anatase structure. The average particle size (Lc = kl/bcos q) for all samples was calculated by Scherrer's equation [10], where k is related to the shape of the polycrystals,l is the x-ray wavelength, b is the full-width at half maximum(FWHM) of the respective diffraction peak and q is the Bragg angle. The obtained diffraction patterns were fitted by a Gaussian function to obtain the value of the FWHM of a peak from the XRD pattern.
The particle size of TiO2 synthesized is about 14 nm. These particle sizes are calculated from the FWHM of the (200) peak.Thus, the particle size was decreased. Figure 1(b) shows the particle size of synthesized TiO2 is smaller than that of commercial Degussa P25 powder. Figure 2 revokes the XRD pattern,indicating clear peaks of the anatase phase without those of the
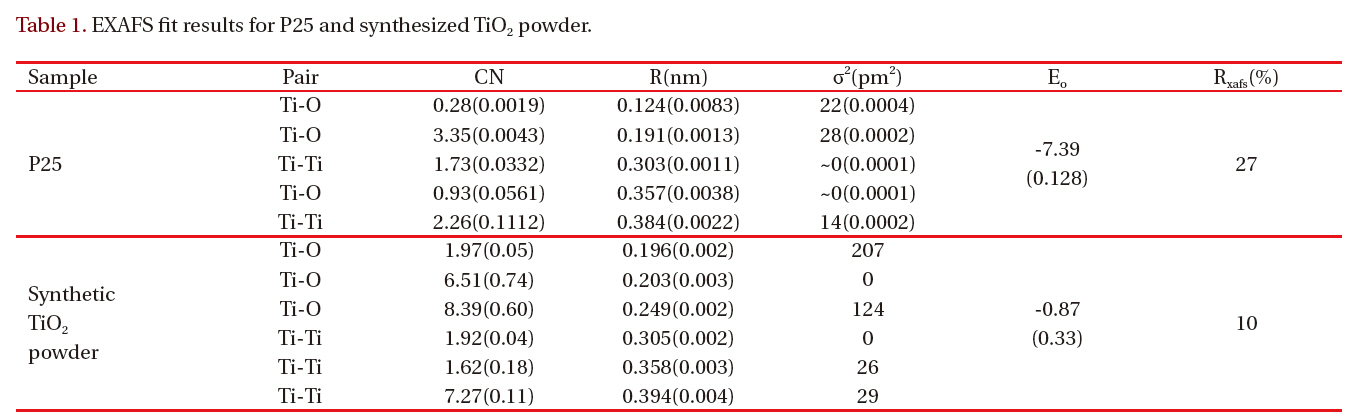
[Table 1.] EXAFS fit results for P25 and synthesized TiO2 powder.

EXAFS fit results for P25 and synthesized TiO2 powder.
rutile phase, as for the TiO2 nanoparticles before and after heattreatment at 450°C for 30 minutes. The XRD peaks are intense and well-resolved suggesting that the TiO2 particles synthesized at 450°C for 30 minutes have high crystallinity.
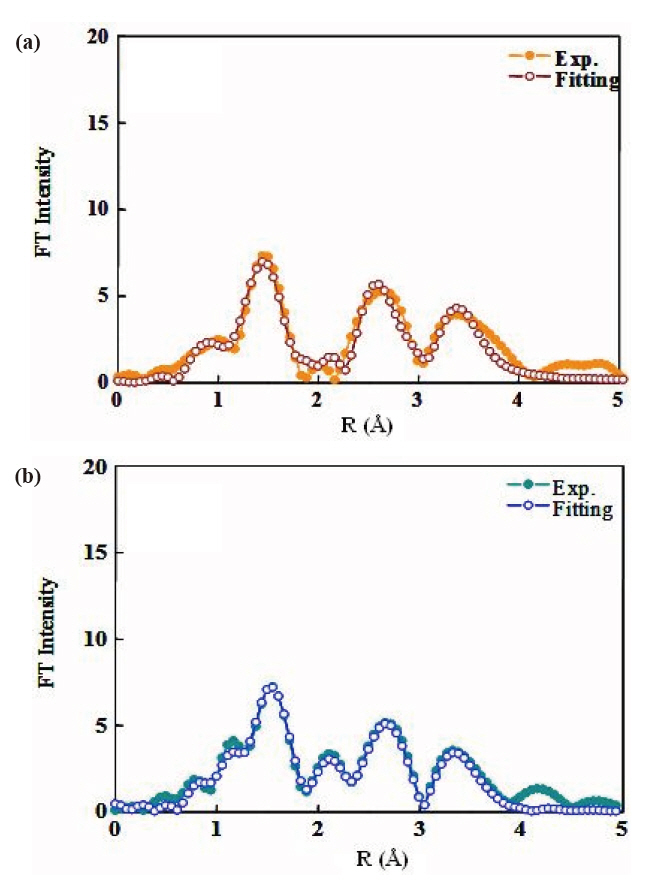
The EXAFS spectra of TiO2 powder were obtained to investigate the local environment of the titanium ion, such as the coordination state and geometry that strongly depends on the presence of different molecules around the metal ion. Figure 3 shows the EXAFS spectra of P25 TiO2 powder and synthesized TiO2 particles. The experimental data for synthesized TiO2 particles are represented by the solid line and the fitting data for bulk anatase by the dotted line. Table 1 gives the best-fit parameters for the EXAFS data. Figure 3(b) shows the EXAFS spectra of the anatase TiO2 nanoparticles. The Fourier transform similarity
of parameters from the change of the phase, so the peak positions are similar to values below those in the original spectrum.The coordination number CN and the nearest Ti-O interatomic distance R were evaluated via the best fit of k3x (k), calculated by inverse Fourier transform of the moduli, to the theoretical one,using a non-linear least squares method.
Table 1 shows the structure parameters of first-shell Ti-O in synthesized TiO2 nanoparticles are quite different from the standard bulk crystallographic data: Ti-O distance close to 1.96 Acorresponding to coordination number 2. There are two different nearest-neighbor Ti-O distances in anatase: four Ti-O bonds at 1.93 A and two at 1.96 A [11]. The derivation from the standard anatase structure suggests that the larger Ti-O distances result from the surface -Ti-OH. This contrasts the conclusion of Chen et al. [12] and Wu et al. [13].
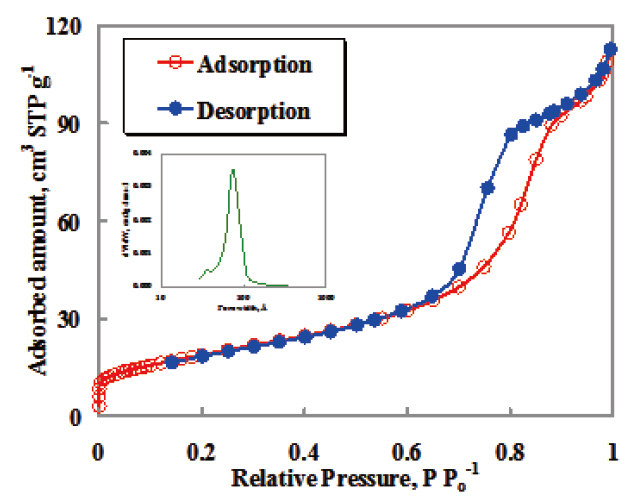
Synthesized TiO2 particles compared to P25 are clearly shown in the difference of the BET surface areas. The synthesized TiO2 film and the P25 film show remarkable difference in their pore size distribution. Both films have very small pores at 10 nm.However, the synthesized TiO2 film possesses a large number of mesopores, of around 10 nm. In contrast, the P25 film reveals a very broad pore size distribution, even larger than 20 nm. The synthesized TiO2 film is characterized by the predominant presence of the mesopores. The smaller particles size and the homogeneous particle size distribution of synthesized TiO2 film should result in the characteristic pore size distribution of synthesized TiO2 film.
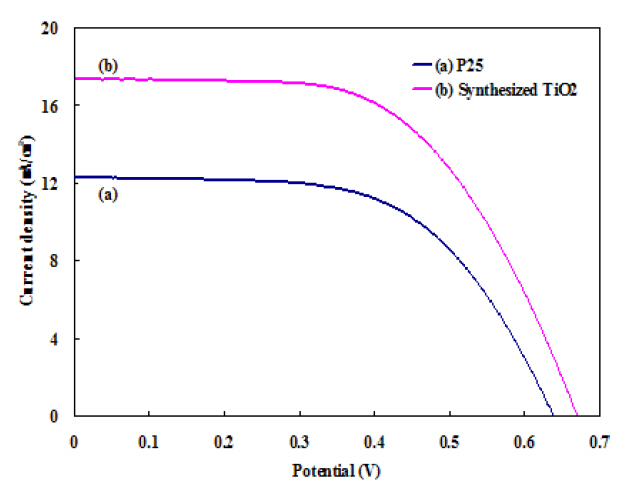
Figure 5 shows the photovoltaic performances of DSSCs prepared using P25 powder and synthesized. TiO2 powder has been evaluated using J-V measurements. Figure 5 shows the J-V curves of DSSC prepared by Degussa P25 powder and synthesized TiO2 particles. The fill factor (ff ) and energy conversion efficiency (η)were calculated using the following equations.
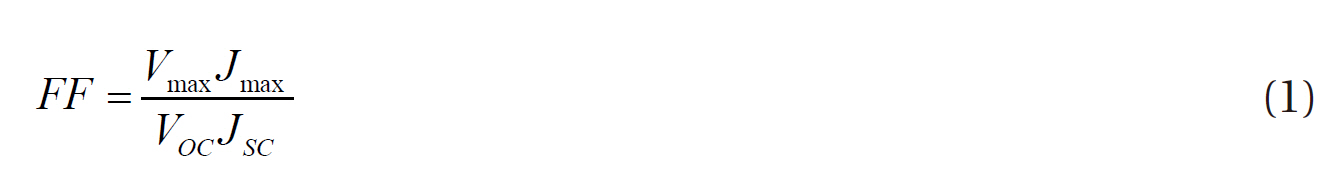
Where, Vmax is the maximum potential and Jmax is the current at the maximum power point of the current-voltage (J-V) in the fourth quadrant.
The energy conversion efficiency of a photovoltaic device is given by
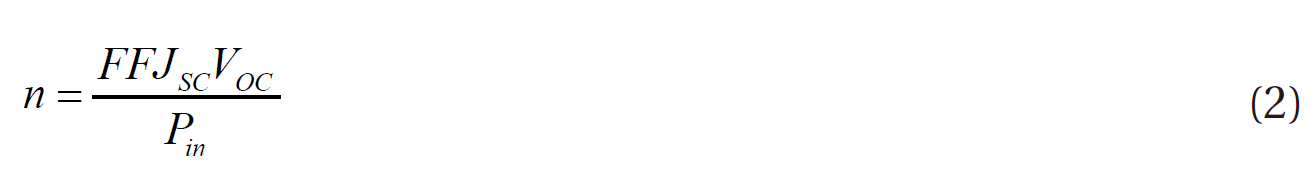
Where VOC (mV), JSC (mA/cm2), fill factor (FF), and Pin (mW/cm2) are open circuit voltage, short circuit current, FF, and incident light power, respectively.
A short circuit current density (Jsc) of 12.3 mA/cm2, an open circuit voltage (Voc) 0.64 V, a FF 57% and an overall power conversion efficiency (η) of 4.5% is obtained for the conventional P25 TiO2 powder. In contrast, the DSSC of the TiO2 electrode prepared by synthesized TiO2 powder achieved 6.1% conversion efficiency;Jsc = 17.4 mA/cm2, Voc = 0.67 V, and FF = 52%. This corresponds to a 135% efficiency increase.
The particle size of TiO2 synthesized is about 14 nm smaller than that commercially available. The XRD pattern and EXAFS data indicate clear peaks of anantase phase without those of the rutile phase for the TiO2 nanoparticles. Nanoparticles are essential to increase surface area, and hence, the amount of dye, while large particles are required to enhance absorption of red light through light scattering. It is impossible to increase surface area and light scattering simultaneously, because they oppose each other. Therefore, a balance between them must be maintained.Such a balance is controlled by tuning the layer structure. An energy conversion efficiency of 6.1% is obtained using synthesized TiO2 powder.