Several kinds of mesoporous silicalites or aluminosilicate have attracted worldwide interest in many areas of physical, chemical,and engineering sciences since the discovery of mesoporous silica at Mobil in 1992 materials [1,2]. Tuning techniques are also important in the field of silica-based materials for the expansion of pore size from micro- to meso-scale due to the increasing demands in both industrial and fundamental studies [3-6].
Pore structures with uniform sizes can be induced and prepared by a self-assembled organic template array. Many kinds of mesoporous silicalites have been identified to be lamella, hexagonal,and cubic phases, in which the pores possess high regular arrays in the 1.5-10 nm size range, depending on the template used [2,6-8]. The mesoporous materials are known to offer new opportunities for their applications in catalysis, chemical separation,adsorption media, supports, ion-exchangers, host systems,and advanced composite materials [9-19].
The structures and the properties of mesoporous materials can be diversely adjusted by a sophisticated choice of organic templates, reaction parameters, and auxiliary cationic framework sources [1,6,20-26]. Especially, some organic silanes, such as alkylalkoxysilane, SiR'(OR)3, (R' and R = methyl, ethyl, or propyl), have been used to prepare amorphous silicalites [27-32]. Therefore, the addition of organic silanes can change the pore structures of typical mesoporous silicalites. In this work, we prepared a series of mesoporous silicalites using various com-
positions of methyltriethoxysilane (MTES). Increased amounts of MTES in silicalite composites changed the structural orders,and the corresponding properties. We have deliberately investigated the structural changes of silicalite composites with various amounts of MTES. In addition, we studied the relationship between their structures and properties.
All the reagents were used as received, without further purification.Cetyltrimethylammonium bromide (CTAB) and tetraethylorthosilicate(TEOS) were purchased from Sigma-Aldrich (USA)and MTES from Gelest Inc. (Morrisville, PA, USA). Water was distilled using a water purification system (Barnstead D12651).
In this work, mesoporous silicalites were prepared with various compositions of TEOS and MTES. CTAB was used as a structure-directing agent. Compositions of MTES were adjusted from 0% to 30% (molar ratio) with respect to TEOS. For example, MS 7/3 indicates that 70% TEOS and 30% MTES were fed into a matrix composition. Mesoporous silicalites were synthesized following the method described in [33]; 0.800 g (2.195 mmol) of CTAB was added to 0.112 M aqueous solution of NaOH heated at 60°C with vigorous stirring. 3.738 g (17.945 mmol) of TEOS was added dropwise to the CTAB solution under the same conditions. After 2 hours, the resultant silicalite solution was washed several times with water. The washed sample was dried in an oven at 80°C for 1 day. Finally, the dried sample was calcined at 500°C for 5 hours to prepare mesoporous silicalite. The same procedure was followed to prepare MTES-mixed silicalites.
X-ray diffraction (XRD) measurements were performed in reflection goniometry using a Rigaku vertical diffractometer (model RINT 2500). The Cu-Kα radiation (1.54 A) was operated at 40 kV and 60 mA. Field emission transmission electron microscopy(FE-TEM) was conducted in a Tecnai F30 S-Twin (FEI, The Netherlands)and operated at 300 kV. TEM samples were prepared on a carbon grid of 400 mesh by dip-coating in dilute solutions (~1 wt% solid content). Nitrogen adsorption measurements were performed at 77 K on ASAP2420 (Micromeritics, Nocross, GA,USA). The calcined samples were outgassed for 2 hours at 573 K in vacuum before adsorption analysis. In addition, thermogravimetric analysis (TGA) (Q50, TA instruments) was used to investigate the thermal property of mesoporous silicalites.
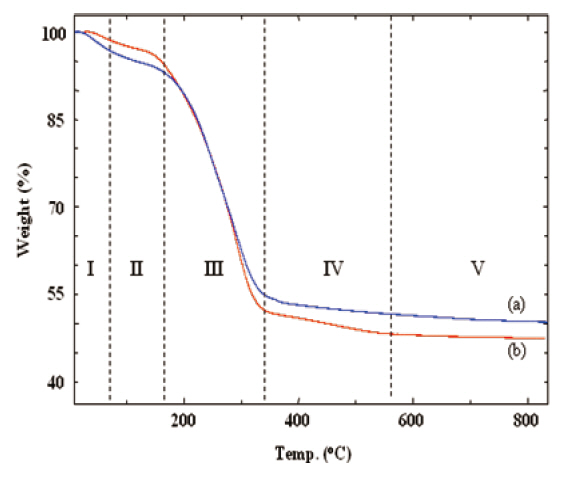
The curing and the thermal decomposition steps of the silicalites were analyzed from their TGA thermograms. Figure 1 shows that the as-made silicalites went through several thermal steps. These thermal steps are shown in Roman numbers separated by vertical dotted lines. In step I, a small drop in weight occurred up to 80°C due to the elimination of residual water.Further drying and the slow curing process were continued up to 160°C (step II). The large weight loss at step III resulted from the removal of the decomposed CTAB and from the evaporation of byproducts, generated by the polycondensation of TEOS and MTES. Further curing of the silicalite networks proceeded over 800°C through steps IV and V. a slow and gradual weight loss In the case of MS 10 sample (curve (a)), was observed due to the curing process (steps IV and V). However, there was a small drop in weight at step IV in the case of MS 7/3 sample (curve (b)) that could be distinguished from the same curve appearing at step V.This small weight loss of MS 7/3 in step IV was mainly caused by the cessation of chemical bonds and removal of methyl groups from the MTES in association with further curing.
Fourier transform infrared spectra were analyzed to identify the formation of such silicalites. These are not shown here,because the spectra were closely similar to our previous result[34]. C-H stretching at 3,000 cm-1 originated from CTAB, but this stretching disappeared completely after the calcination of asprepared silicalites, indicating the elimination of CTAB. Si-C stretching of MTES at 1,270 cm-1 was also moved out in calcined silicalites, suggesting the decomposition of methyl groups of MTES[ J1]. Vibrations of Si-O-Si bonds appeared within the 1,000-1,200 cm-1 range. Similar results were obtained from other silicalites prepared using different compositions of TEOS and MTES.
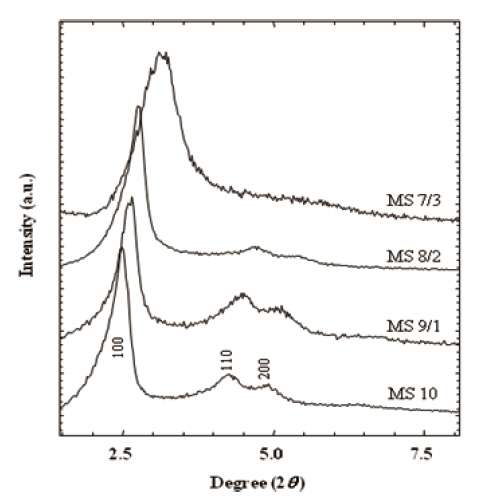
XRD patterns in Fig. 2 provided information on pore size and structural integrity. Well-resolved peaks of MS 10 represented typical MCM-41 structure (hexagonal, p6mm) [35,36]. The main peaks of (100) spacing were broadened with the increase of the MTES portion in the silica matrix from 0 % (M S10) to 30 % (MS 7/3). This broadening of (100) spacing was attributed to the pore size. Similarly, higher ordered peaks of (110), and (200) were broadened with the increase of the MTES content, and finally they were obscured in MS 7/3. In addition, peak positions shifted toward the larger 2θ angles. These results suggest that the addition of MTES in silica matrix disrupt the structural order in the mesoporous silicalites and prevent the characteristic pore gen-
eration resulting in a decreased pore size. Broadening of the XRD patterns was mainly caused by the deficiency of structural integrity.As the MTES ratio increased in the silicalites, so the 2θ peaks of (100) spacing shifted toward the higher 2θ angle from 2.48° to 3.14°. Therefore, the pore sizes corresponding to the peaks were estimated to change from 3.4 nm to 2.8 nm. The structure and the pore size of the calcined silicalites are discussed in the following TEM results.
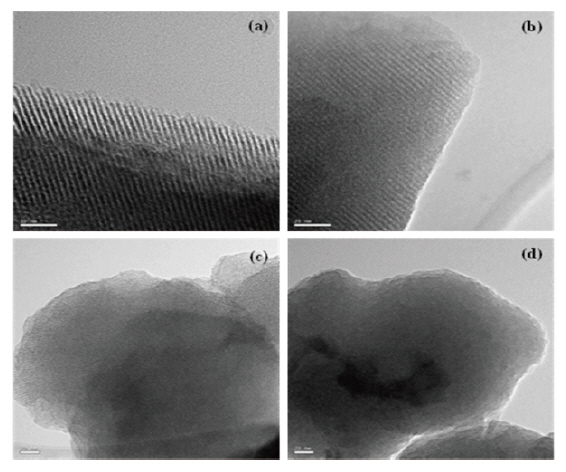
Figure 3 presents the TEM images of the mesoporous silicalites prepared in this work. All of the samples were calcined at 500°C for 5 hours to remove organic template (CTAB) completely. Long and regular pore channels were evidently observed in MS 10 and MS 9/1 samples (Figs. 3(a) and (b)), prepared with 100 and 90% TEOS, respectively. These images were identified to have the characteristic MCM-41 structure. However, the structural orders were destroyed in MS 8/2 (Fig. 3(c)) and MS 7/3 (Fig. 3(d)) that had a MTES content of 20% and 30%, respectively. Some bent and unclear pore channels were found in the edges of the MS 8/2 sample. No trace of pores was found in the MS 7/3 sample.As shown in the XRD study of Fig. 2, the pore structures collapsed in these mesoporous silicalites (MS 8/2 and 7/3). Methyl pending groups of MTES hindered the structural ordering of≡Si-O- frameworks, resulting in an amorphous structure. This was caused by the insufficient formation of the supramolecular assembly with organic template used as a surfactant. The TEOS precursor completely turned into the silicate anion during mesoporous silicalites synthesis. This silicate anion was assembled with surfactant and formed well-ordered mesoporous silicalites.However, during surfactant-induced silicalite synthesis, methyl groups of MTES remaining in the silicalite frameworks prevent the formation of ordered mesoporous structures. For instance,we reported in our previous literature [27-32] that polymethylsilsesquioxane(PMSSQ) prepared from CH3SiX3 precursor (X =-OCH3, -OC2H6, -Cl3, etc.) formed an amorphous thin film on a substrate. When the spacings related to (100) peak of XRD were estimated from TEM image, d-spacings of mesoporous silicalites corresponded to 3.3 A for MS 10, 3.1 A for MS 9/1, and 2.7 A for MS 8/2. The silicalite containing 30% MTES was completely amorphous (Fig. 3(d)). These estimations agreed with XRD analysis,with the exception of MS 7/3. Wide broadening of characteristic(100), (110), and (200) spacings of MS 7/3 in Fig. 2 indicates an amorphous structure that strongly supports the TEM image of the MS 7/3 sample.
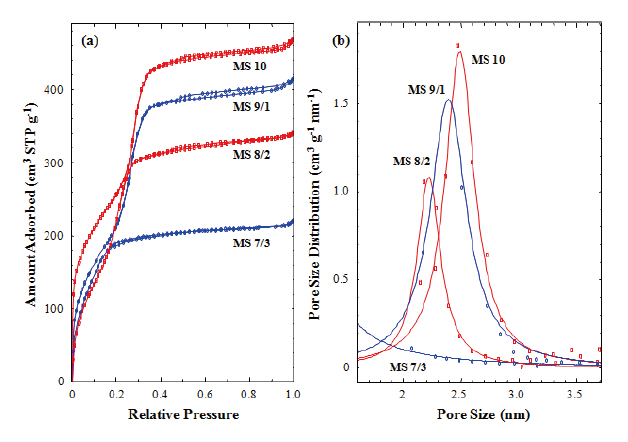
Figure 4(a) shows nitrogen adsorption isotherms of the calcined silicalites. Capillary condensation steps were found in
those silicalites (MS 10, 9/1, and 8/2), which contained 0-20% of MTES, but not found in the MS 7/3 sample, which contained 30% of MTES. In addition, the capillary condensation steps shifted toward the lower relative pressure with increasing MTES content.This result was caused by the reduction of pore size generated in the silica matrix during calcinations. The absence of the capillary condensation step in the MS 7/3 sample suggests that uniform and meso-sized pore structure had not been formed in the calcined sample (MS 7/3). This result agrees with the TEM image of MS 7/3, in which an amorphous structure was observed. We have already mentioned that the methyl groups of MTES prevented the generation of mesopores in the silica matrix. Pore size distribution was calculated from the isotherms measured in this work using the Barrett-Joyner-Halenda (BJH) method. Figure 4(b) shows the pore size distributions of the calcined silicalites(MS 10, 9/1, and 8/2). The peak maxima decreased from 2.5 to 2.2 nm with increasing MTES content but there no peak was found in the MS 7/3 sample. This result also agrees with the TEM analysis.The pore sizes calculated from Fig. 4(b) were smaller than those estimated from XRD and TEM were. This underestimation of pore size might be caused by the exclusion of wall thickness(~0.5 nm) and by the inaccuracy of the BJH method used for the determination of pore size [37].
A series of methyltriethoxysilyl-mediated mesoporous silicalites were prepared by sol-gel reaction in basic aqueous medium.Their detailed structures were characterized. The MTES component hindered the formation of mesopore channels induced by the self-assembly of organic template (CTAB). Thus, the structure transformed into an amorphous state and the pore size of the calcined silicalites reduced with the increase of MTES content. This result was supported by TEM, XRD, and N2 adsorption analysis.Mesoporous structures in calcined silicalites maintained up to 10% loading of MTES in a matrix composition with a slight decrease of pore size. The pore structure of a calcined silicalite was suddenly destroyed on 20% loading of MTES, and its morphology converted completely into an amorphous state on 30% loading of MTES. The pore sizes of calcined silicalites estimated from TEM images agreed with XRD analysis. The pore size distributions obtained from N2 adsorption were reasonably comparable to their pore structure observed in TEM and XRD analysis.