A need for greater awareness of and education about information systems security has been growing worldwide and resulted in security initiatives in many international organizations [European Network and Information Security Agency 2007; The World Bank 2004; Council of Europe 2011]. Despite the increasing recognition, efforts to address information systems security assessments as a personal problem are rarely found. But in fact, personal-level security has a great impact on organizational security. More specifically, the security-relevant behaviors of workers outside their workplace can seriously impair the overall security readiness of an organization.
The ever-increasing use of portable computing and storage devices makes the correlation between the household Internet security and larger organizational network security even stronger. For example, corporate employees often take their laptops home and connect them to their home network. If the home network contains a computer already compromised by a malicious software application, the newly-connected work laptop is likely to be infected. Once the employee comes back to work the next day,the infected laptop puts the entire corporate network in danger. This scenario also applies to portable storage devices such as USB thumb drives and external hard drives.
Despite its importance, household security has not attracted the sufficient attention it deserves. Most literature on information systems security assessment has focused on information systems management at a larger organizational level [Payne 2010;Bartol et al. 2009; Reznik 2003; Swanson et al. 2003] rather than at the level of households that are as equally susceptible to security threats as any other social sector.
Even those fully acknowledging the importance of household level Internet security have been overlooking the assessment issue, working mostly on the identification of security threats and defensive strategies [Jones 2007; Torrellas 2004; Nahid et al.2001; Rabinovitch 1997; Littlewood et al. 1993].
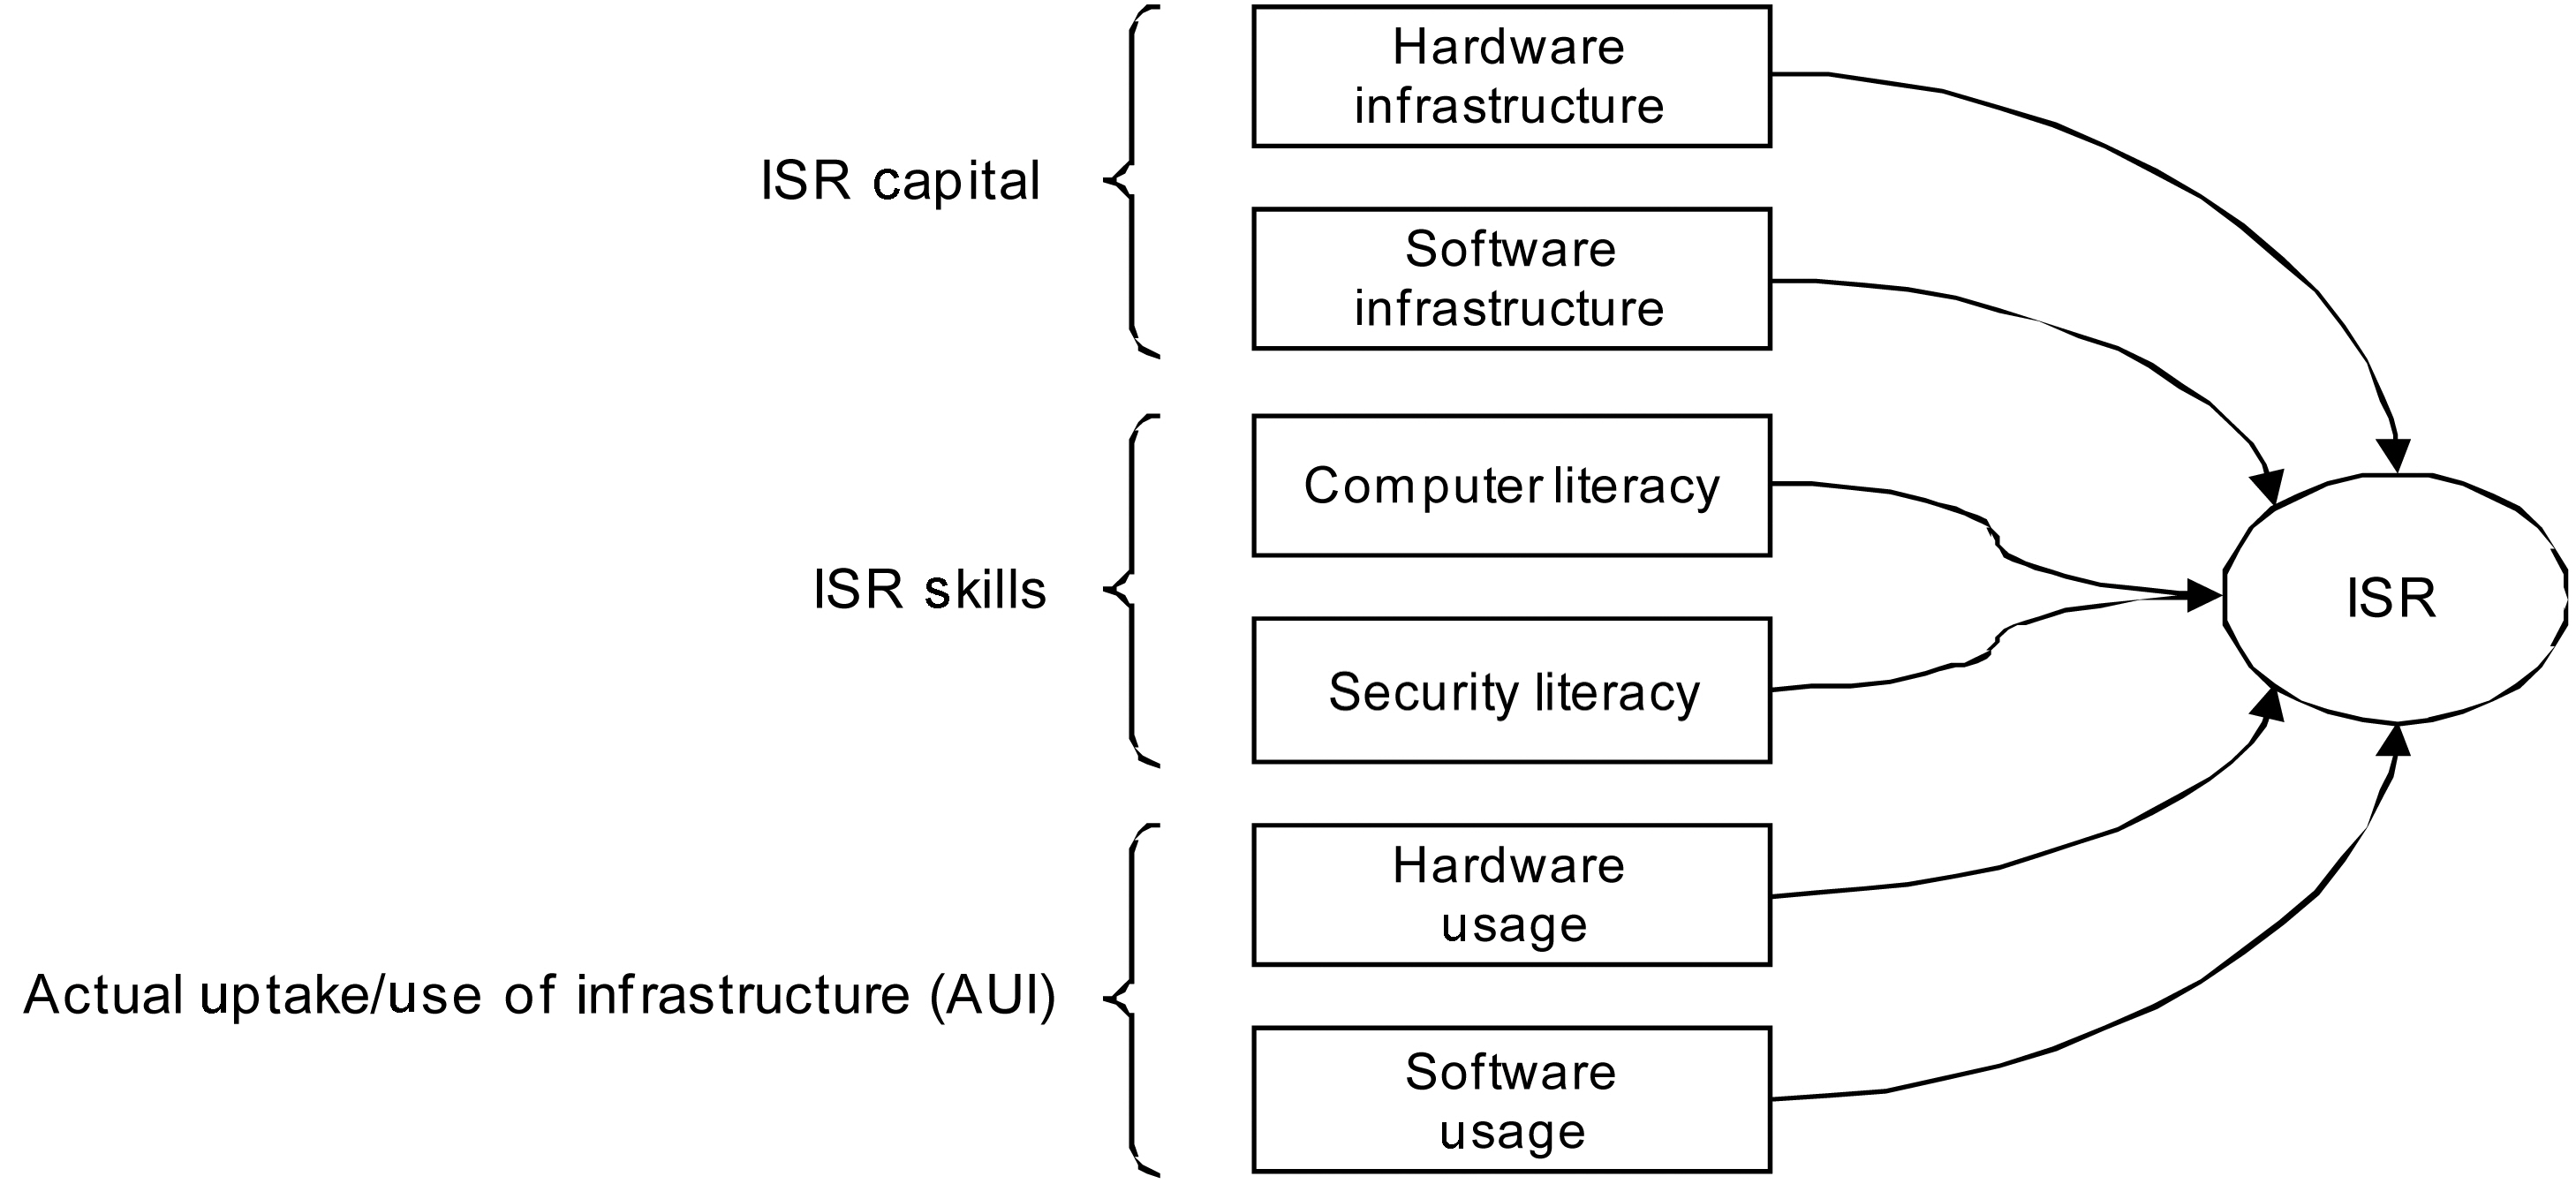
Recognizing the significance of a practical analysis framework for the measurement and evaluation of household readiness against Internet security threats, we proposed a quantification framework for internet security readiness (ISR) in a household setting [Ryoo et al. 2006] (depicted in Figure 1).
The proposed ISR framework consists of three core evaluation criteria such as readiness levels in capital, i.e., ISR capital measured in hardware and software infrastructure; ISR skill measured in computer literacy and security literacy; and ISR actual uptake/use of infrastructure (AUI). We also proposed a formula that combines
the three readiness measurement results and produces an index that intuitively shows the overall ISR of a household. To test the validity of our framework, thus, we conducted a household survey among the faculty and staff members of a major university in 2006.
This paper is an extension of our previous study to finish several uncompleted tasks. The newly conducted research can be summarized as follows. First, the ISR framework was applied to the household survey to produce ISR indices per household. The procedure to construct an index was enumerated into several steps. Second, the relationships among the sub-categories (ISR capital, ISR skill, and ISR AUI) of the ISR framework were examined. Third, the influence of Internet usage level on ISR and the association between security threat awareness and ISR were analyzed. The main research objective of this paper is to present the findings from this more thorough evaluation of the ISR indices computed based on the data we collected from our prior research and to provide new insights into the relationships between different ISR readiness evaluation criteria.
Depending on the focus of its scrutiny, security assessment can address one or more of the following technology-centric areas [Whitman and Mattord 2007]:
? Application security, which means how resilience is factored into a software application against threats throughout its lifecycle including design, implementation, deployment, and maintenance. Other software and hardware solutions can also be considered as part of application security when they are meant to help keep the application from being compromised.
? Data security, which is the way of stopping data corruption, breach of data confidentiality, and attempts to make data unavailable.
? Internet/Network security, which refers to countermeasures taken to ensure that no unauthorized access be made, which could harm a computer network and eventually render it unreliable, unusable, or unavailable. The lack of internet/network security often discourages more pervasive use of the Internet in the form of electronic commerce [infoDev 2005].
? Physical security, which concerns safeguards designed to limit physical access to sensitive information systems equipment and buildings containing them to prevent damage or theft.
Having access to the most advanced and expensive technologies is, however, insufficient to provide maximum possible security. Often factors other than those related to technologies (e.g., human factors) are more important. These non-technology-centric areas of security assessment are collectively referred to as procedural security. Examples of the threats procedural security tackles range from minor violations of security policies to social engineering that exploits weaknesses in human nature to trick people into damaging actions ultimately leading to serious security breaches.
Although it is possible to partially assess security readiness by concentrating only on one of the aforementioned security assessment areas, such a practice is deemed incomplete and ineffective in measuring the overall security readiness of an organization of any size. Therefore, an ideal security readiness assessment effort must be comprehensive and address all the different aspects of information systems security (i.e., application,data, network, physical, and procedural). The proposed model by Ryoo et al. [2006] addresses and assesses these multiple facets of security (Figure 1).
Increasing awareness in security is generally regarded as a positive trend [McLean 1992; Siponen 2000; Spurling 1995; Thomson and von Solms 1997; von Solms and Thomson 1998]. However, little research has been conducted to scientifically verify the relationship between security awareness and security readiness. In fact, the research projects most related to ours are those showing that too much awareness of security can sometimes act as a hindrance to a person’s effort to be a productive member of our ever-more-connected society as shown in the research of Economist Intelligence Unit [2005], infoDev [2005], Bohlin et al. [2004], and OECD [2002]. Therefore, it is important to learn how to strike a balance between awareness and paranoia in the context of information security so that we can encourage the positive individual use of the Internet while ensuring that people behave both cautiously and responsibly in cyberspace. Our interest in discovering a connection between security awareness and ISR stems from our academic curiosity on the role awareness plays in information security.
2.2 Internet Usage Level and ISR
There are ample discussions in the literature on the topics such as how people use the Internet [Larose et al. 2001; Teo et al. 1999], their shopping patterns on e-commerce sites [Khosrowpour 2004], the impact of Internet usage on an individual [Simmers and Anandarajan 2002; Anandarajan et al. 2000], or the addictive nature of the Internet [Morahan-Martin 2005]. Still, few of these papers explore Internet usage level and its security implications. One may assume that more exposure to the Internet produces a technology-savvy user who can evade many potential threats from cyber criminals. A counter-argument is also possible since one can put oneself into more danger by accidentally visiting websites riddled with malicious software as time spent on the Internet increases. The significance of learning more about the relationship between one’s Internet usage level and ISR is that the new discoveries may both objectively and systematically expose security risks associated with activities on the Internet in low, medium, and high usage level environments.
Thus, drawing upon the survey results, this research produces ISR indices to discover how aware households are of security threats and how well they are prepared to protect themselves from security attacks in terms of the security infrastructure of information systems and their actual uptake/usage. Second, correlations among ISR capital, ISR skill, and ISR AUI are examined. We hypothesize that hardware and software infrastructure is positively related to both computer and security literacy, but we do not think that the ownership of infrastructure is positively related to the actual uptake/use of the infrastructure in any way [Furnell et al. 2007]. Third, we investigate whether or not there are significant differences in the combined values of the three respective ISR indices at different levels of Internet usage and security threat awareness. This practical composite index per household can be treated as the overall measurement of a household’s Internet security readiness while its constituent indices provide valuable indicators for which part of the ISR categories should immediately be addressed by the policy makers and the consumer industry.
More specifically, we will attempt to answer the following concrete research questions:
(1) How should the categorical variables be combined to be used as an overall ISR measure?
(2) What are the correlations among ISR capital, ISR skill, and ISR AUI?
(3) Are there significant differences in the composite ISR values at different levels of Internet usage and security threat awareness?
The data for this study was collected from a Web survey entitled Home Network Security Questionnaire. Fifteen hundred faculty and staff members at a large public university in the Northeastern United States were asked to fill out a questionnaire through an email invitation, and a total of 296 surveys were submitted by the participants. Out of the 296 surveys, 21 surveys were discarded because respondents without a computer at home were not qualified to complete the survey.
The respondents who had one or more computers at home were allowed to continue to take the entire survey. Excluding uncompleted surveys, a total of 273 valid questionnaires were analyzed. Of the 273 participants, 51% were male and 49% were female. Of those participating, 34.4% were teachers, 14.1% were information technology (IT) staff, 17% were in clerical positions, 14.9% were in supervisory positions, and 19%were in other positions. The majority of the respondents (87%) were between 30 and 59 years old, 8.2% were between 18 and 29, and 5% were over 60 years old.
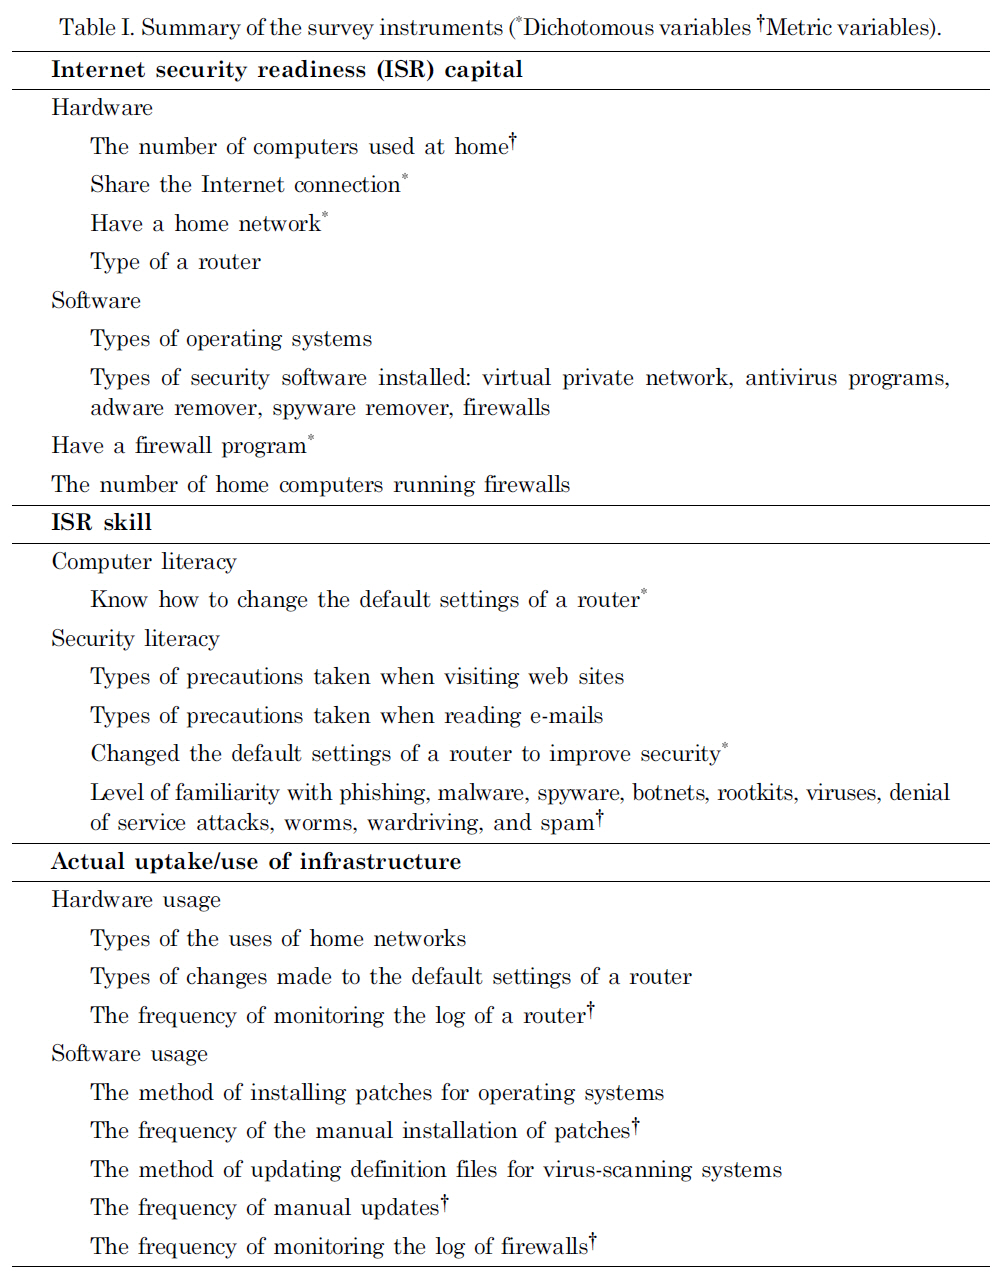
The survey instruments consist of a total of 38 questions measuring the demographic characteristics of the respondents such as age, gender, position title, and campus, and assessing the security readiness of the participants’ households against security threats. Mainly the questionnaire assessed the households’ Internet security-relevant infrastructure, the actual uptake/use level, and the level of computer and security literacy as independent variables (Table I).
The Internet usage level was defined as the total amount of Internet use per week by the household. It was measured by asking “how much time per week (in total) does your household collectively spend on the Internet at home?” If the answer was “less than 5 hours a week,” the response was classified as a low level group (Low). If the answer was from 5 to 20 hours per week, the response was classified as a medium level group (Medium). More than 20 hours per week qualified the household as a high level group (High).
The operational definition for security threat awareness was the respondent’s selfevaluation of the household’s preparedness for either preventing or responding to security attacks. The explanatory variable was categorized into three groups: high, medium, and low. The high group evaluated the level of their households’ preparedness against security attacks as either very secure or very unsecure. The assumption for this is that if people were very well aware of security threats, they would be more realistically aware of the status of their network and computer security environments, and could evaluate the status as either very secure or very unsecure. The medium level
[Table 1.] Summary of the survey instruments (*Dichotomous variables †Metric variables).

Summary of the survey instruments (*Dichotomous variables †Metric variables).
group moderately evaluated the level as either secure or unsecure. If the respondent answered “not sure,” this was categorized as the low level group of security threat awareness.
4. CONSTRUCTION OF ISR INDICES AND DATA ANALYSES
4.1 Producing the Measurements for the Latent Variables
The main purpose of this survey study was to obtain numerical measurements for ISR. As described in Figure 1, the desired composite ISR value is a combination of ISR capital, ISR skill, and ISR AUI. Each component of ISR also contains two variables that are each linked to several different survey instruments. However, all of these variables just mentioned were not measured directly by the survey. As a result, these unmeasured variables or latent variables refer to a set of unobserved factors [Kutner et al. 2004]. For example, ISR capital contains two parts: hardware and software. However, the survey does not directly measure the hardware or software readiness in a quantifiable manner. Therefore, hardware and software are considered latent variables. Numerical measures for hardware and software are needed to produce the indices for ISR capital and the composite ISR value.
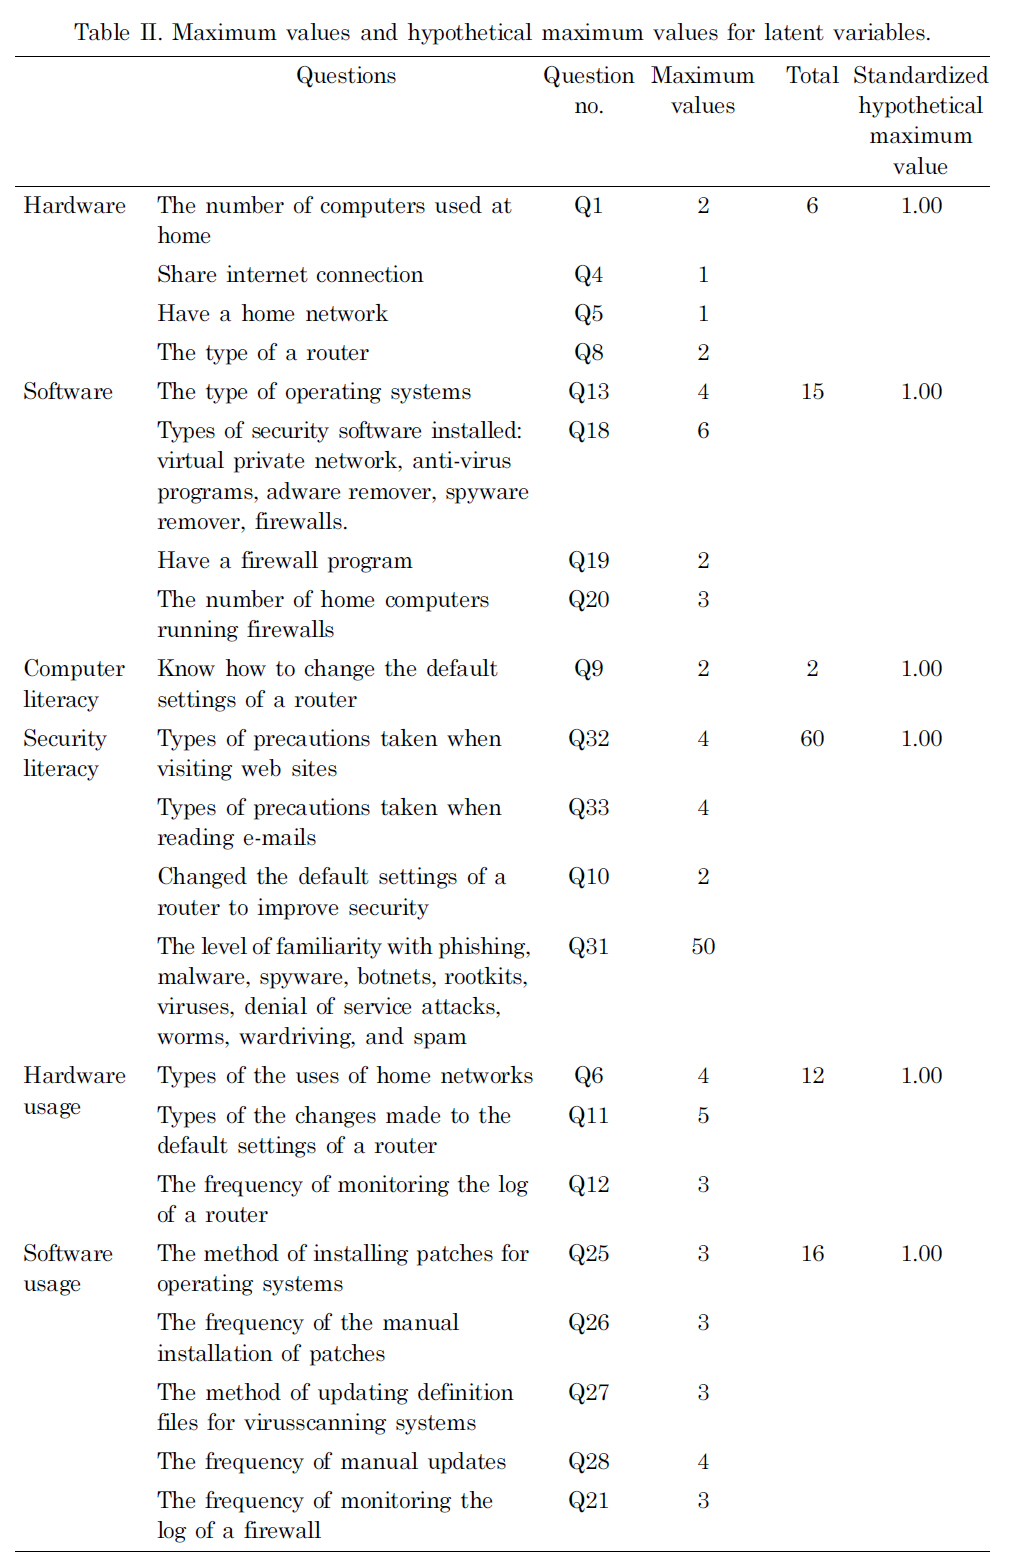
One easy and meaningful way to produce the measurements for latent variables is to sum up all the answer values related to those latent variables if they are metric values. Since there are missing values in the data set, the weighted mean function method was used instead of the summation method. Table II summarizes the maximum value for each question and the corresponding latent variable values.
To directly use a mean value for all related questions (obtained for the measurements of the corresponding latent variables) as a representative measurement, potential weights must be added to each question. For example, if we use a mean value for Questions 13, 18, 19, and 20 as the measure for the software capital readiness variable, we can add weights 4/15 to Question 13, 6/15 to Question 18, 2/15 to Question 19, and 3/15 to Question 20 based on the total number of individual questions for each category. Before using the mean function method to obtain the measures for the latent variables,each question was standardized so that all questions have the same weights. After standardizing all the variables, the responses for all the questions were re-scaled to a numerical value between 0 and 1. Thus, the same weights were given to each question when the mean method was used to produce the measurements for the latent variables. For example, to obtain a measurement for the hardware latent variable, since this latent variable involves questions 1, 4, 5, and 8 as shown in Table II, the mean function method can be used on these four questions to obtain the measurement for hardware.
4.2 Producing Indices for Component ISRs
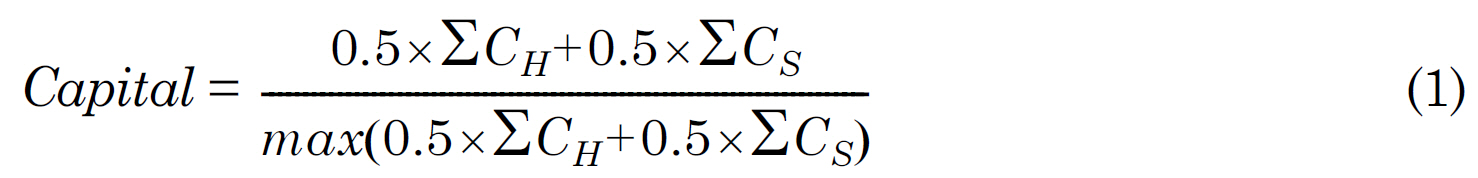
After obtaining the numerical measurements for all the latent variables in Table II, we calculated a composite index value combining the values of the component ISRs using the formula in Table III.
Note that in all of the formulas,
It is assumed that the ISR capital-related latent variables (i.e., hardware and software) are equally important. Thus, their wi and wj should be both 0.5 in this case.
[Table 2.] Maximum values and hypothetical maximum values for latent variables.

Maximum values and hypothetical maximum values for latent variables.
[Table 3] Formula for calculating the composite internet security readiness (ISR) value.
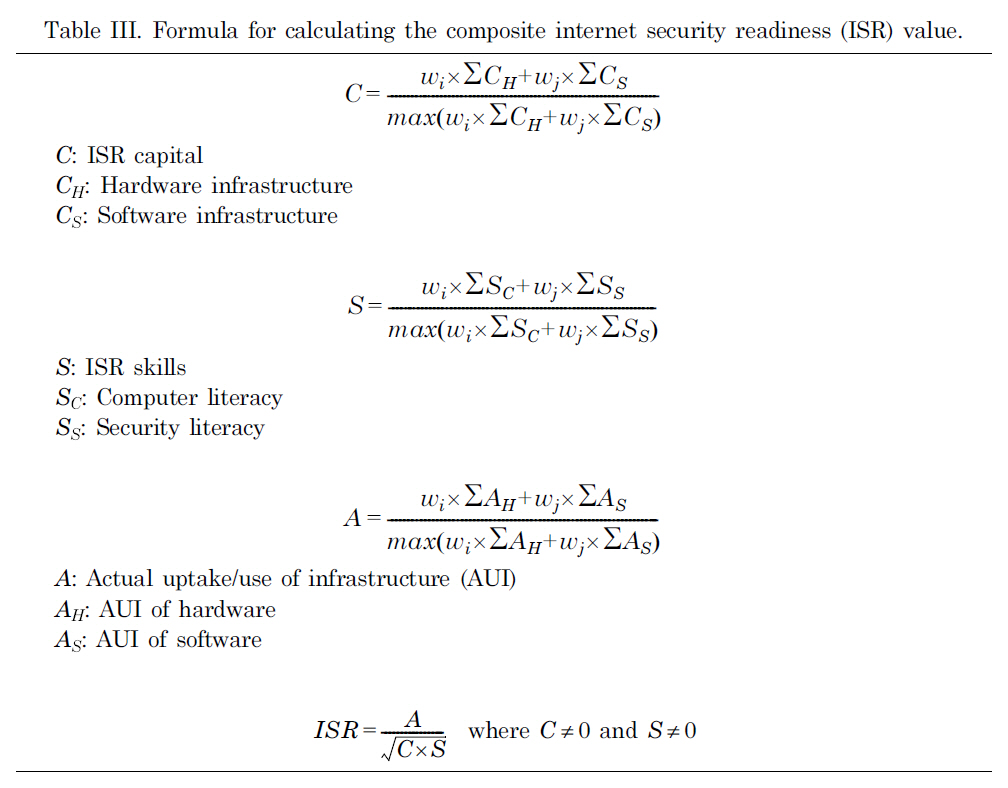
Formula for calculating the composite internet security readiness (ISR) value.
The denominator above ensures that the result is a number between 0 and 1, which would be the desired index for ISR capital. In fact, since both hardware and software are the mean values of the answers for the corresponding questions, the maximum values of the weighted sum of these two latent variables are the weighted sums of the maximum value for each latent variable. Because of the standardization, the maximum value for the re-scaled responses of each question is 1 (Table II). Thus, after using the mean function on the corresponding questions, the maximum values for the hardware and software are both 1. Therefore, the formula for the denominator in equation 1 changes to be 0.5 × 1 + 0.5 × 1.
4.3 Producing Indices for Composite ISR
Using the indices for ISR capital, ISR skill, and ISR AUI obtained in the previous section, the composite ISR value was calculated based on the last formula in Table III.
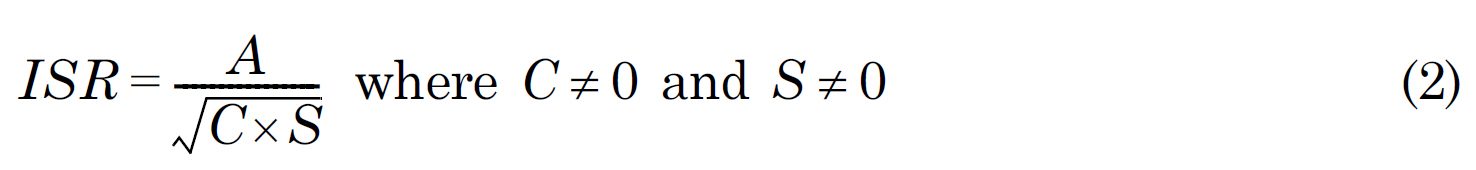
The square root used over C × S is mainly to even out the effect of the multiplication of the two indices, C and S, compared with A. It is possible that ISR is larger than 1 as long as A2 ? C × S. So, in this case, the total ISR is an index that is no longer between 0 and 1. In addition, in Table III, the formula for calculating the composite ISR value requires that both C and S be not 0. Otherwise, the ISR would be infinity.However, in reality, it is possible that indices C and S are 0. One possible method to solve this problem is to add a very small positive number, for example 0.001, to both C and S.
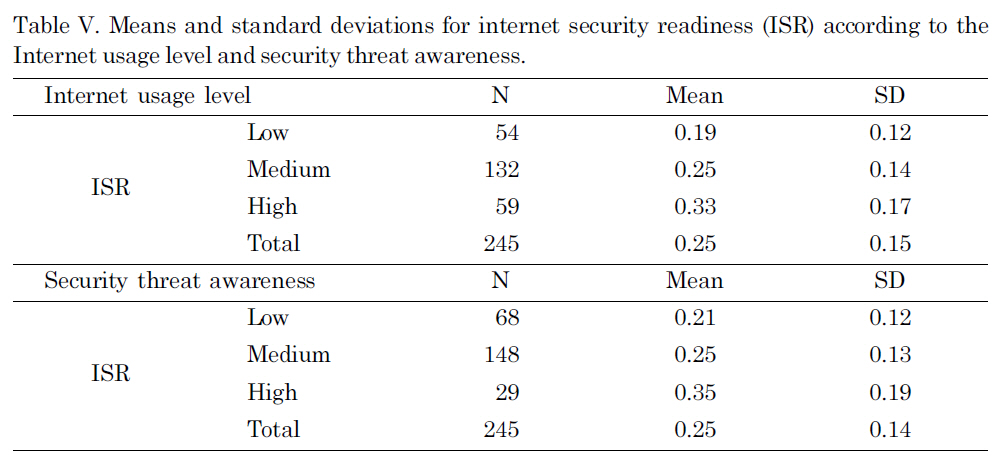
After producing the ISR index value, the descriptive statistics of each segment of data were obtained and presented in the Tables IV and V. Since the hypothetical and standardized threshold for each component of the composite ISR value was 1, they could be easily compared. In this table, the composite ISR value was converted into an ISR mean with the maximum value of 1 for easier comparison. Both ISR Capital(M for mean = 0.41, SD for standard deviation = 0.34) and ISR skill (M= 0.44, SD = 0.24)produced higher means than ISR AUI (M = 0.21, SD = 0.16). This suggests that respondents who took this survey tend to have security-relevant infrastructure and skills, but they do not utilize these resources.
The average ISR mean value for the high Internet usage group was 0.33 (SD = 0.17),which is higher than the medium group (M = 0.25, SD = 0.13) and the low group(M = 0.19, SD = 0.12). This result lets us conclude that the higher Internet usage group is more likely to be prepared for security risks compared with the medium group and the low group. The security threat awareness groups also produced similar results of the high awareness group with a higher mean (M = 0.35, SD = 0.19) than the two other two groups.
6. CORRELATION BETWEEN COMPONENT ISRS
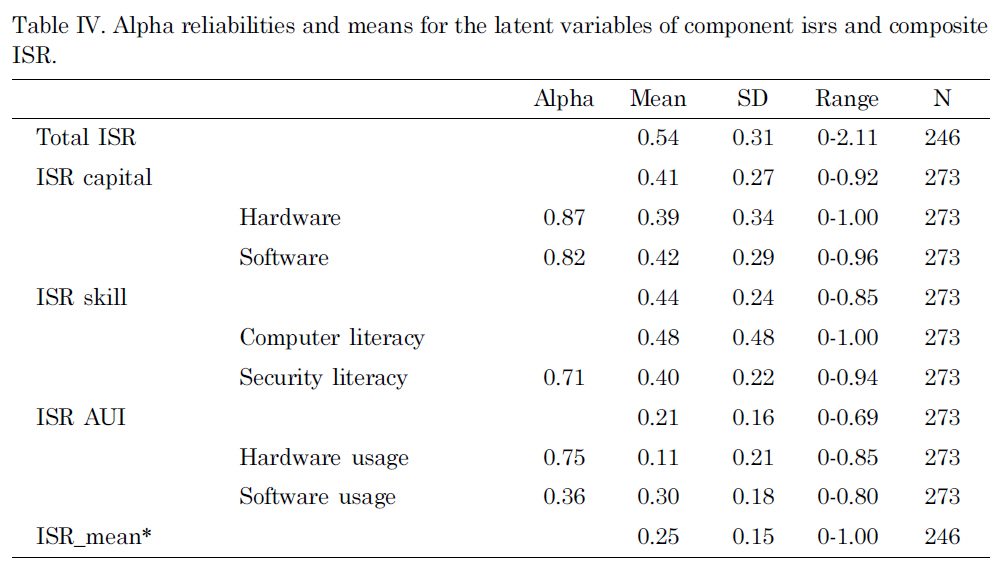
Alpha reliabilities and means for the latent variables of component isrs and composite ISR.

Means and standard deviations for internet security readiness (ISR) according to the Internet usage level and security threat awareness.
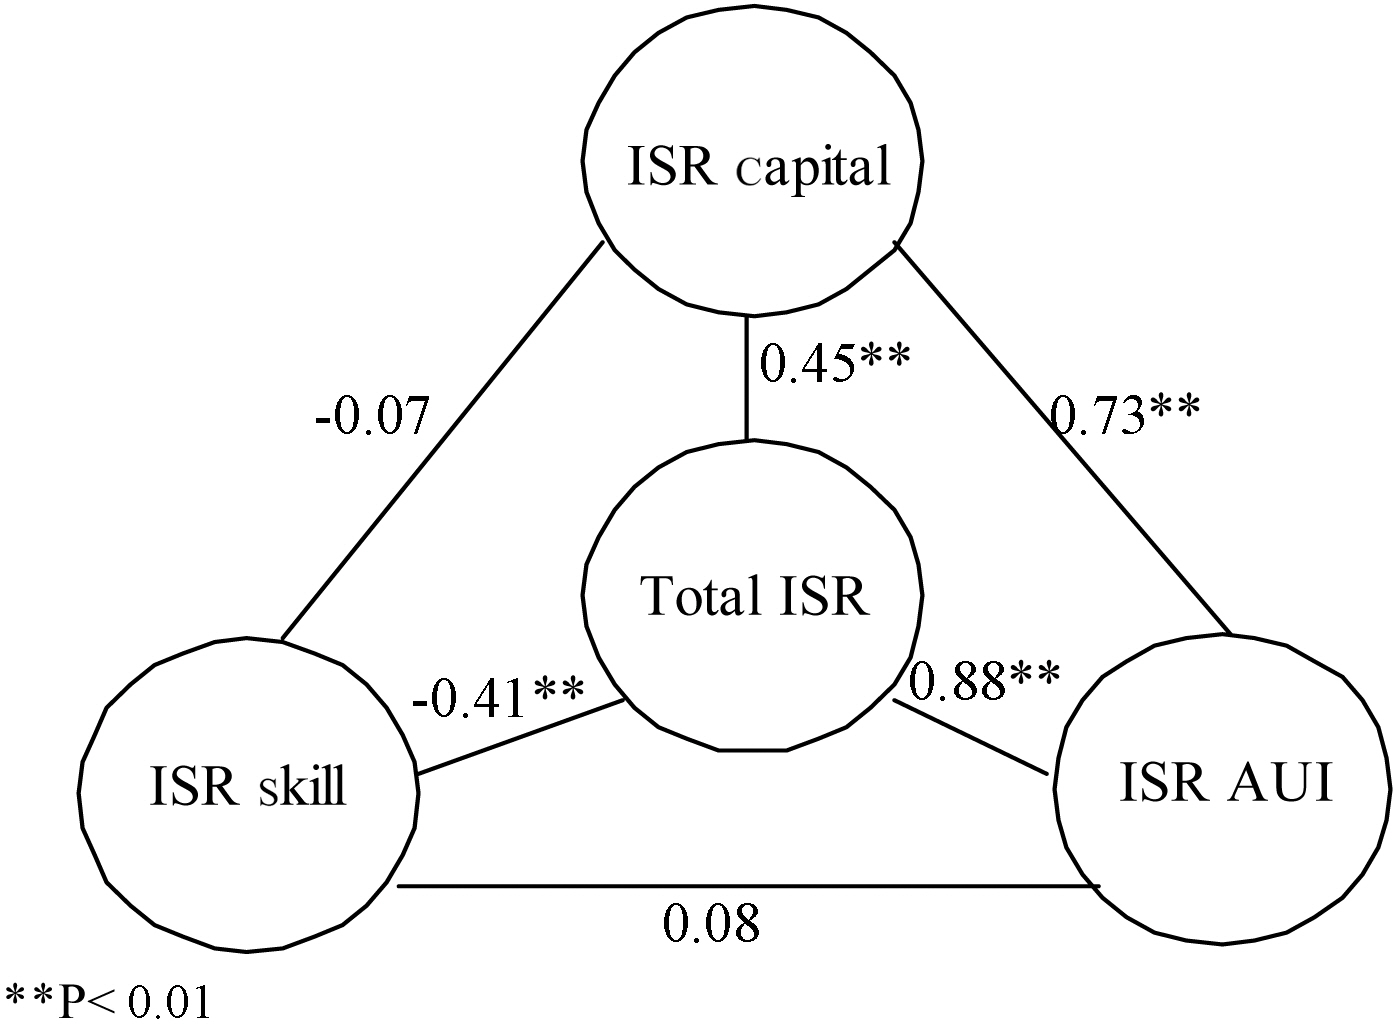
[Figure 2.] Pearson correlation coefficients between component internet security readinesses (ISRs).

Obtaining the component ISRs and the composite ISR for each household allows us to investigate if there is any relationship or specific correlation among the three components of the composite ISR value. The results are summarized in Figure 2.
As shown in Figure 2, there was a significant positive correlation between ISR capital (C) and ISR AUI (A), r (273) = 0.73, p ? 0.001. The strong positive relationship between ISR capital and ISR AUI indicates that households with security-relevant infrastructure, both hardware and software, may be more likely to actually use their infrastructure. The correlation between ISR capital (C) and ISR skill (S) was negative but not significant, r (273) = -0.07 at p ? 0.05. It seems obvious that the extent of possessing infrastructure does not guarantee the household members’ computer literacy and security literacy. Interestingly, however, the association between ISR skill (S) and ISR AUI (A) was not significant either, r (273) = 0.08 at p ? 0.05. This insignificant relationship may indicate that ISR skills do not assure people’s actual use or uptake of their infrastructures.
7. ISR ACCORDING TO DIFFERENT INTERNET USAGE LEVELS AND SECURITY THREAT AWARENESS
The final research question we raised was if the composite ISR value is significantly
[Table VI.] Results of one-way ANOVA according to Internet usage levels
Results of one-way ANOVA according to Internet usage levels
different for different levels of Internet usage and security threat awareness. A oneway ANOVA analysis of the variance model can address this question. A one-way ANOVA model examines whether or not the mean response will be different under different categories of one variable [Agresti and Finlay 1997]1.
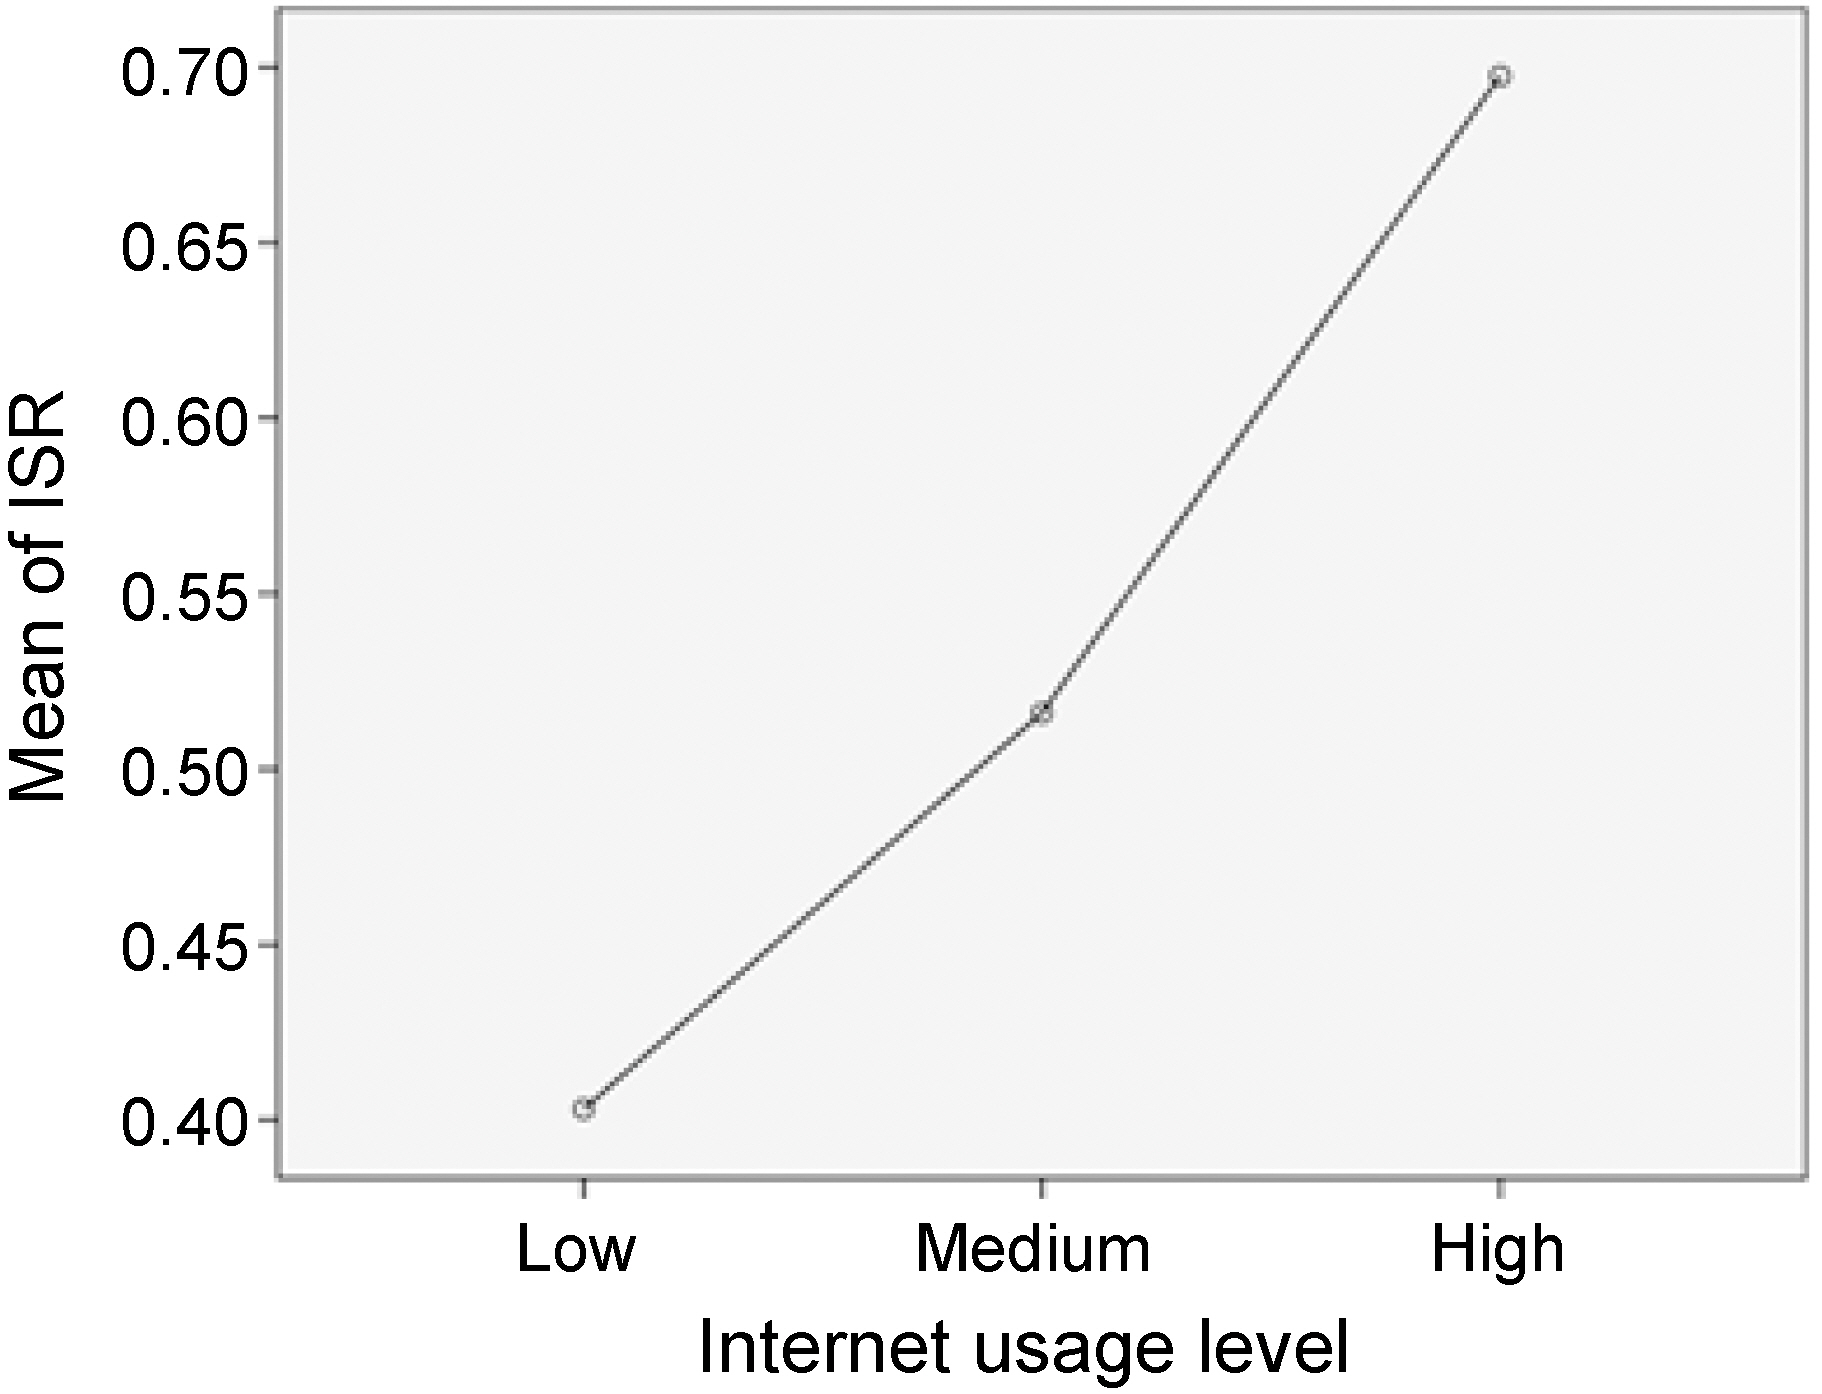
The composite ISR value differed significantly across the three different Internet usage groups, F (2, 242) = 14.47, p = 0.000 (Table VI). Thus, where the difference lies should be questioned. The Tukey post-hoc multiple comparisons of the three groups indicate that the high-level Internet usage group (M = 0.70) gave a significantly higher composite ISR index than the medium level group (M = 0.52), p = 0.003 and the low level group (M = 0.40), p = 0.000 (Figure 3). A comparison between the medium level Internet usage group and the low level group was not statistically significant at p ? 0.05.
On the other hand, using the same steps as discussed earlier, it was checked to see if there was a difference for the composite ISR value under the different levels of security threat awareness (high, medium and low). Table VII shows that the composite ISR values differed significantly across the three different security threat awareness
[Table 7] Result of One-way ANOVA according to the level of security threat awareness
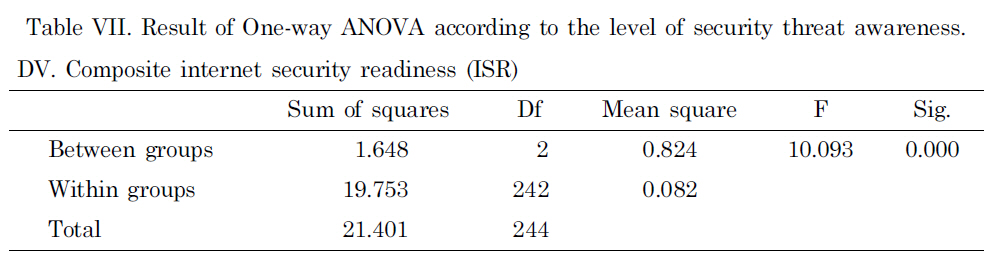
Result of One-way ANOVA according to the level of security threat awareness
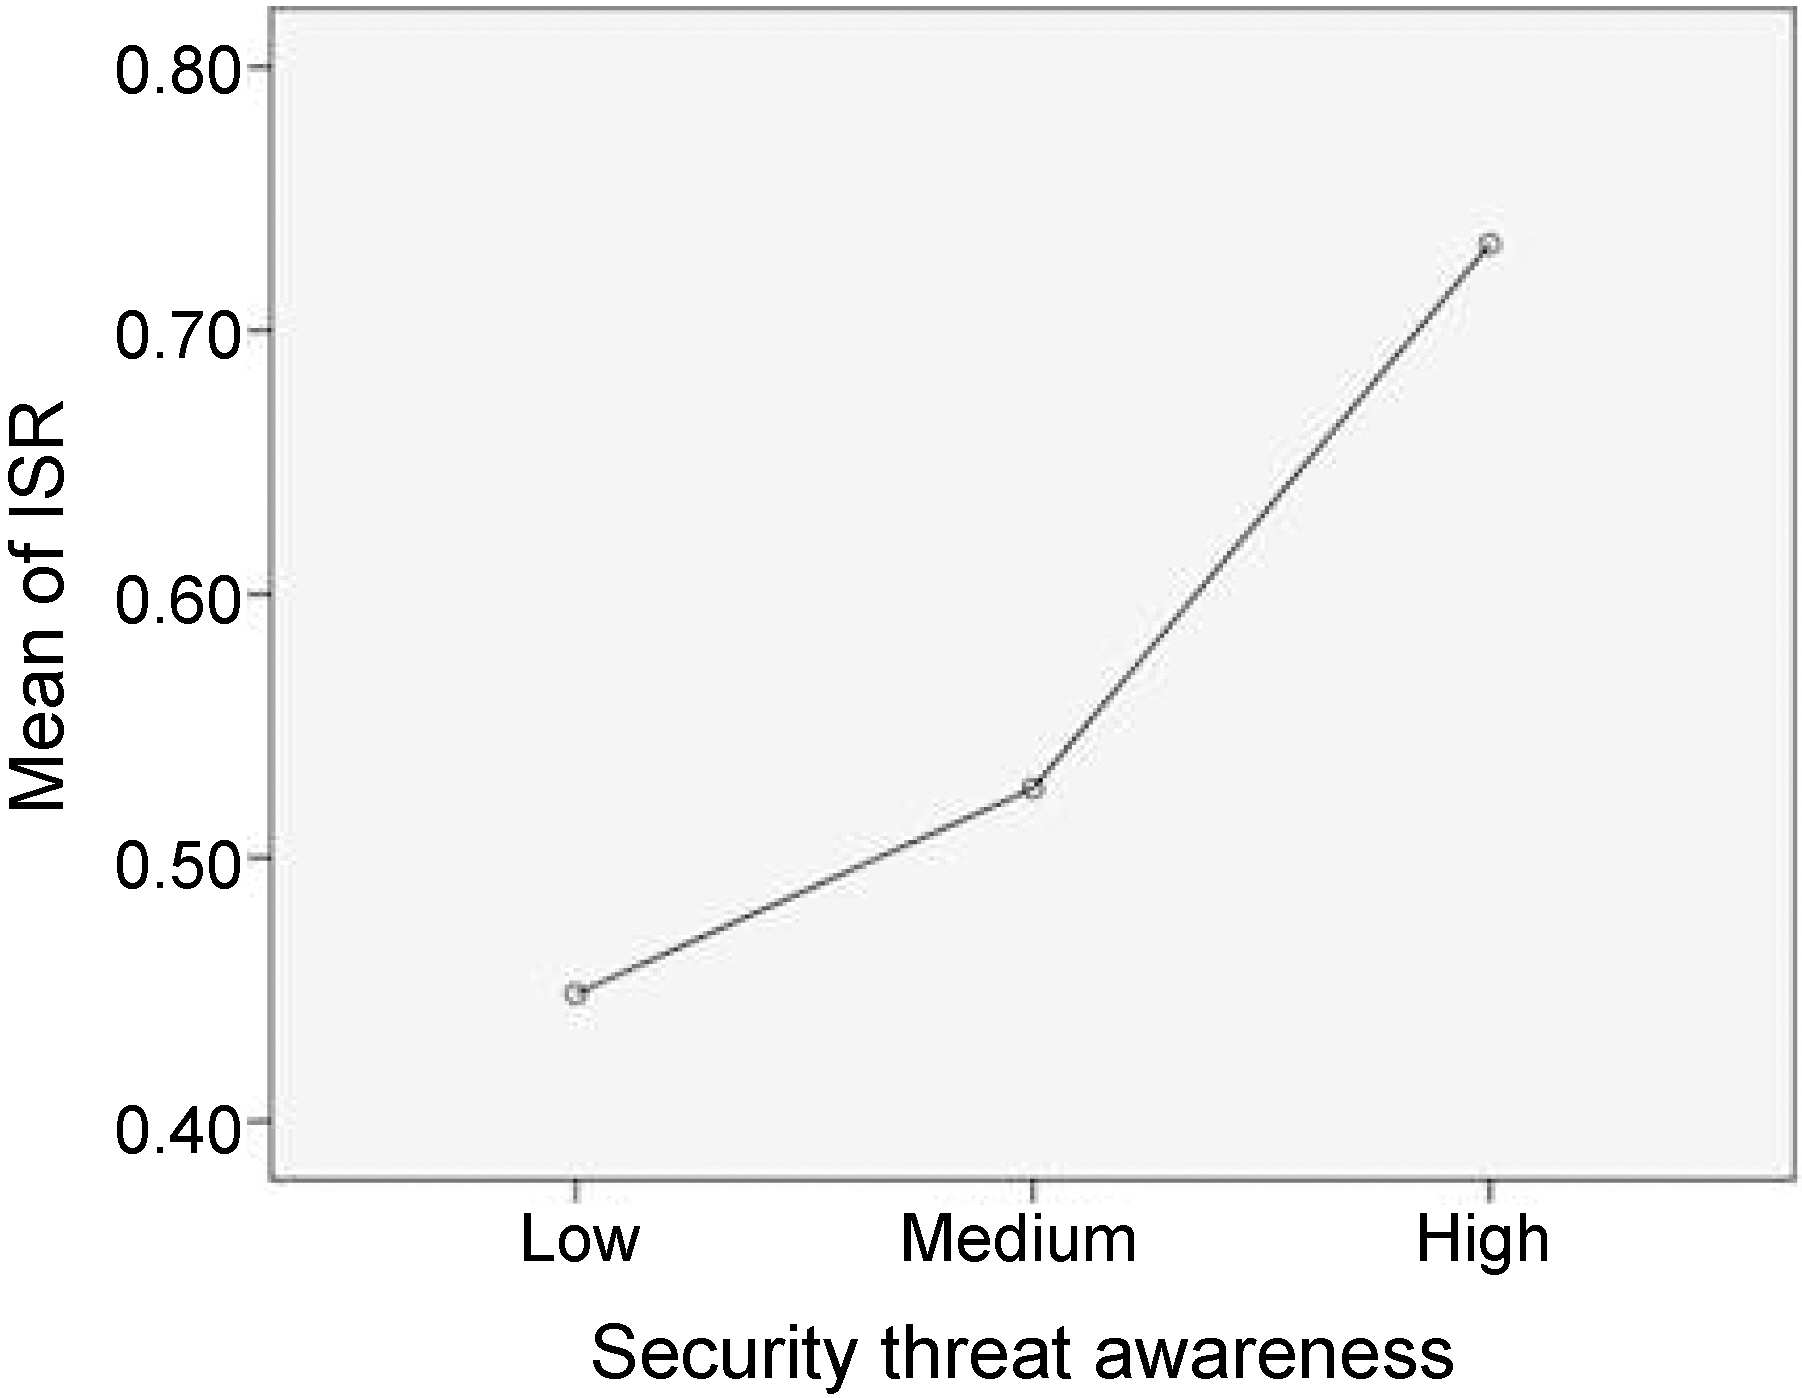
groups, F (2, 242) = 14.95, p = 0.000. Again, the Tukey post-hoc comparisons of the three groups indicated that the high level security threat awareness group (M = 0.73)produced a significantly higher ISR index than the medium level group (M = 0.53),p = 0.001 and the low level group (M = 0.45), p = 0.000. Again, a comparison between the medium level Internet usage group and the low level group was not statistically significant at p < 0.05 (Figure 4).
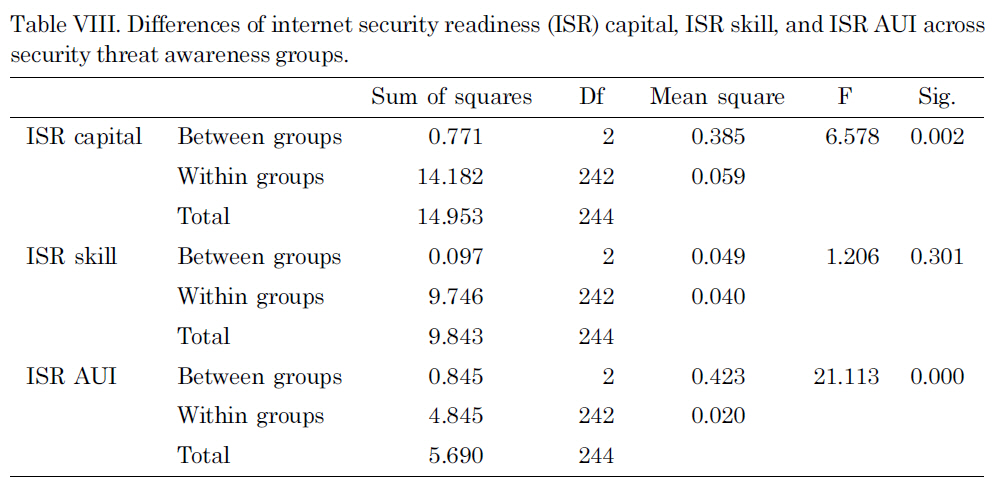
Finally, the differences between ISR capital, ISR skill, and ISR AUI across the three security threat awareness groups were tested. ISR capital and ISR AUI were significantly different across the different security threat awareness groups, F (2,242) = 6.58, p = 0.002 and F (2, 242) = 0.42, p = 0.000 (Table VIII). First, the Tukey post-hoc comparisons of the three groups for ISR Capital indicate that the high-level security threat awareness group (M = 0.59) produced significantly higher ISR Capital than the medium level group (M = 0.44), p = 0.008 and the low level group (M = 0.40),p = 0.001. A comparison between the medium level group and the low level group was not statistically significant at p ? 0.05. Again, comparisons across the three groups for ISR Skill were not statistically significant at p ? 0.05, and this indicates that there were no differences across the groups regarding ISR Skill.
On the other hand, the comparison of ISR AUI shows that all three groups are different with a statistical significance. The high level of security threat awareness group (M = 0.37) produced higher ISR capital than the medium level group (M = 0.23),

Differences of internet security readiness (ISR) capital ISR skill and ISR AUI across security threat awareness groups.
p = 0.006 and the low level group (M= 0.17), p = 0.000. A comparison between the medium level group and the low level group was also statistically significant at p ? 0.001.
1For example, the one-way ANOVA model can identify if the mean Composite ISR value is different under the different levels of Internet usage (high, medium, and low) and security threat awareness (high, medium, and low).
This paper demonstrated the generation of ISR indices for households using a previously proposed framework that quantitatively assessed household preparedness for security threats. The framework offers generic measurements that can be customized and applied to various domains including diverse forms of government and business organizations.
To validate the proposed framework, the measurements of latent variables and the procedure for generating ISR index values were elucidated. During the process of producing ISR indices, it was noticed that the following further enhancements could be made to improve the quality of the measurements. First, a mean function method was preferable to a summation method since there are missing values in the data set. Second, we gave the same weights to the components of ISR, which are hardware and software infrastructure, computer literacy and security literacy, and hardware use/uptake and software use/uptake. We assumed that each latent variable is equally important to constitute general preparedness. This assumption is an intuitive one rather than theoretical. Therefore, a further theoretical study should be followed to clarify the relative importance of each latent variable for producing the component ISRs. Third, the reliability check of the latent variables of the component ISRs produced low alpha (= 0.36) in latent variables for ISR AUI and Software Use/Uptake. Although the questions for this subset were cautiously based on expertise on security issues, a more highly structured scale could be developed and tested.
The findings of the correlations among the ISR components suggest that the households with more ISR capital (i.e., security-related hardware and software) are strongly associated with the actual use/uptake of the infrastructure. Although the proposed ISR framework assumes that the availability of ISR capital is different from the actual adoption, and the adoption itself does not necessarily guarantee the efficient and effective use of the infrastructure, the results of this research show that ISR capital is strongly related to ISR AUI. This indicates that the promotion for the deployment of ISR capital would be more desirable to encourage households to practice prevention strategies.
On the contrary, ISR capital was not automatically associated with ISR skill.
This rejects the prevalent perception that advanced computer users with knowledge and expertise would be more likely to adopt security-relevant infrastructure. Furthermore, ISR skill was not associated with ISR AUI, either. This corresponds to the previous finding that a majority of respondents who claimed to have knowledge regarding computer use did not demonstrate effective security practices such as efforts to understand security functionality in applications, performing regular updates to security software, etc. [Furnell et al. 2007]. Furnell et al. [2007] further suggested that users’ awareness of security threats matters, and the education issue should be addressed by developing new models of engagement and awareness promotion.
This paper also examined the differences of ISR on the varying levels of Internet usage and security threat awareness. Its findings provide evidence on the hypothesized relationships among a composite ISR value, Internet usage levels, and security threat awareness. First, one-way ANOVA analyses found out that the surveyed households which spend much more time on the Internet (more than 20 hours per week) at home tend to be better prepared for cyber crimes compared to the households that spend less than 20 hours per week. The high usage group produces higher ISR probably because the more time the users spend on the Internet, the more knowledgeable they become on security issues, and they are more likely to practice security precautions. Indeed, the high usage group produced more ISR capital and ISR AUI on average, and the differences were statistically significant.
Second, ANOVA analyses for security threat awareness discovered that responding households with high security threat awareness are more likely to defend themselves against possible security attacks. These households are also more likely to be equipped with essential security hardware and software, and at the same time they are more likely to actually use that hardware and software compared to the households with low awareness. However, ISR skill did not significantly differ in the three groups of security threat awareness. Thus, we can conclude that ISR, ISR capital, and ISR AUI are positively associated with the responding households’ security threat awareness except for ISR skill.
Before concluding, some limitations should be mentioned for the purposes of future research. First of all, this survey was conducted in an academic community, not in a general residential community. Respondents were presumably more knowledgeable and well-educated in terms of computing than the general public. Therefore, this study cannot be fully interpreted to be representative of the behavior of the general public. Generalization can be achieved by conducting future research in a different, more generic demographic group.
In addition, a causation issue can be raised in this type of study. Even though ANOVA analyses were conducted with explanatory variables (Internet usage level and security threat awareness) and dependent variables (ISR and component ISRs), it is not statistically clear whether or not higher ISR leads to higher security threat awareness or whether higher security threat awareness results in higher ISR. To make such causal inferences valid, one must gather data by experimental means, controlling extraneous variables that might confound the results [Agresti and Finlay 1997]. Accordingly, inferences from ANOVA analyses should be cautiously made. The results indicate that although composite ISR and component ISRs are different across the three levels of Internet usage and security threat awareness, their causal relationships are not apparent.
This research is an extension of our previous research that investigated critical factors (or major indicators) involved in deciding the overall Internet security readiness of a household. Unlike prior work that stopped short of actually computing the ISR values for the individual households, this paper developed a new methodology to overcome the categorical nature of the measurements we originally developed and to successfully quantify the survey results into ISR index values. This allowed us to examine the various relationships between the component variables of ISR, such as capital, skill, and uptake/use. The correlation between composite ISR values and Internet usage has been analyzed as well as the correlation between composite ISR values and awareness. The findings from this research provide valuable insights into which part of the ISR categories should be addressed by policymakers and the consumer industry to immediately improve security.