Generation of reactive oxygen species (ROS) is an unavoidable process in most aerobic organisms.Although ROS are important in host defenses against invading microorganisms as well as in certain cellular signaling events, excessive ROS cause oxidative stress, accompanied by significant damage to cellular macromolecules including lipids, proteins, and DNA(Zelko et al., 2002). Of variety of enzymes involved in the antioxidant pathway in aerobic organisms,copper/zinc-superoxide dismutase (Cu/Zn-SOD; SOD1;EC 1.15.1.1) plays pivotal roles in the first line of defense against oxidative stress. This enzyme primarily scavenges cytosolic ROS via the dismutation of the ROS to hydrogen peroxide, which is then converted to water by the catalytic action of catalase(EC 1.11.1.6) (Zelko et al., 2002). Given that in aquatic animals, many stimulatory factors often enhance the formation of ROS in a variety of organs, SOD has been proposed as a versatile biomarker that can be used to detect environmental problems as well as health risks for animals (Almeida et al., 2002;Regoli et al., 2002; Hansen et al., 2006).
Genetic determinants of Cu/Zn-SODs have been isolated from a variety of teleost species; however,most previous studies focused on coding sequences at the mRNA level (cDNAs), and there is little information on this gene at the genomic level in teleosts. This lack of knowledge regarding the regulatory region of the fish sod1 gene may be an obstacle in the pursuit of getting a deeper insight into the molecular mechanism of sod1 regulation in response to biotic and abiotic stressors.
Hemibarbus mylodon (Teleostei; Cypriniformes) is an endemic freshwater species found along the Korean peninsula. Over the last decade, the habitats of this species have been largely destroyed by anthropogenic and/or industrial activities, raising serious concern about the extinction of wild populations (Jang et al., 2003; Kim et al., 2008).Recently, the Korean Ministry of Environment launched a research program for the conservation of endangered fishes, including H. mylodon, and studies addressing the biological and ecological issues involved in successful restoration are underway(Ministry of Environment, Korea; http://nre.me.go.kr/eweb/main/index.jsp). The development of fine molecular biomarkers for a threatened species can provide an improved understanding of stress phyiology and adaptive capacity at both the cellular and organismal levels, which could be of importance in the development of conservation strategies (Snape et al., 2004; Miracle and Ankley, 2005; Cho et al.,2008).
Consistent with our long-term goal to provide comprehensive information on a variety of molecular biomarkers that could aid in in situ and ex situ restoration activities for H. mylodon, the objective of this study was to cast knowledge on the molecular structure and mRNA expression of sod1, a key antioxidant enzyme gene from H. mylodon. Thus, we isolated and characterized the cDNA and genomic sequences of H. mylodon sod1; determined the molecular features of the 5'-flanking regulatory regions by genome walking method; and examined basal and induced mRNA expression upon immune challenge.
We conducted a survey of our H. mylodon expressed sequence tag (EST) database (Bang et al.,2007), which revealed a clone (HMM-152) obtained from the muscle cDNA library that matched preiously determined vertebrate sod1 sequences. This EST clone appeared to contain potentially the fulllength sod1 cDNA sequence, including the 5'-untranslated region (UTR) and the ATG start codon.The insert DNA was further sequenced in both directions using the primer walking method. The sod1 open reading frame (ORF) fragment was amplified from liver total RNA (500 ng) by RT-PCR amplification using the primers HM SOD1 FW and HM SOD1 RV.
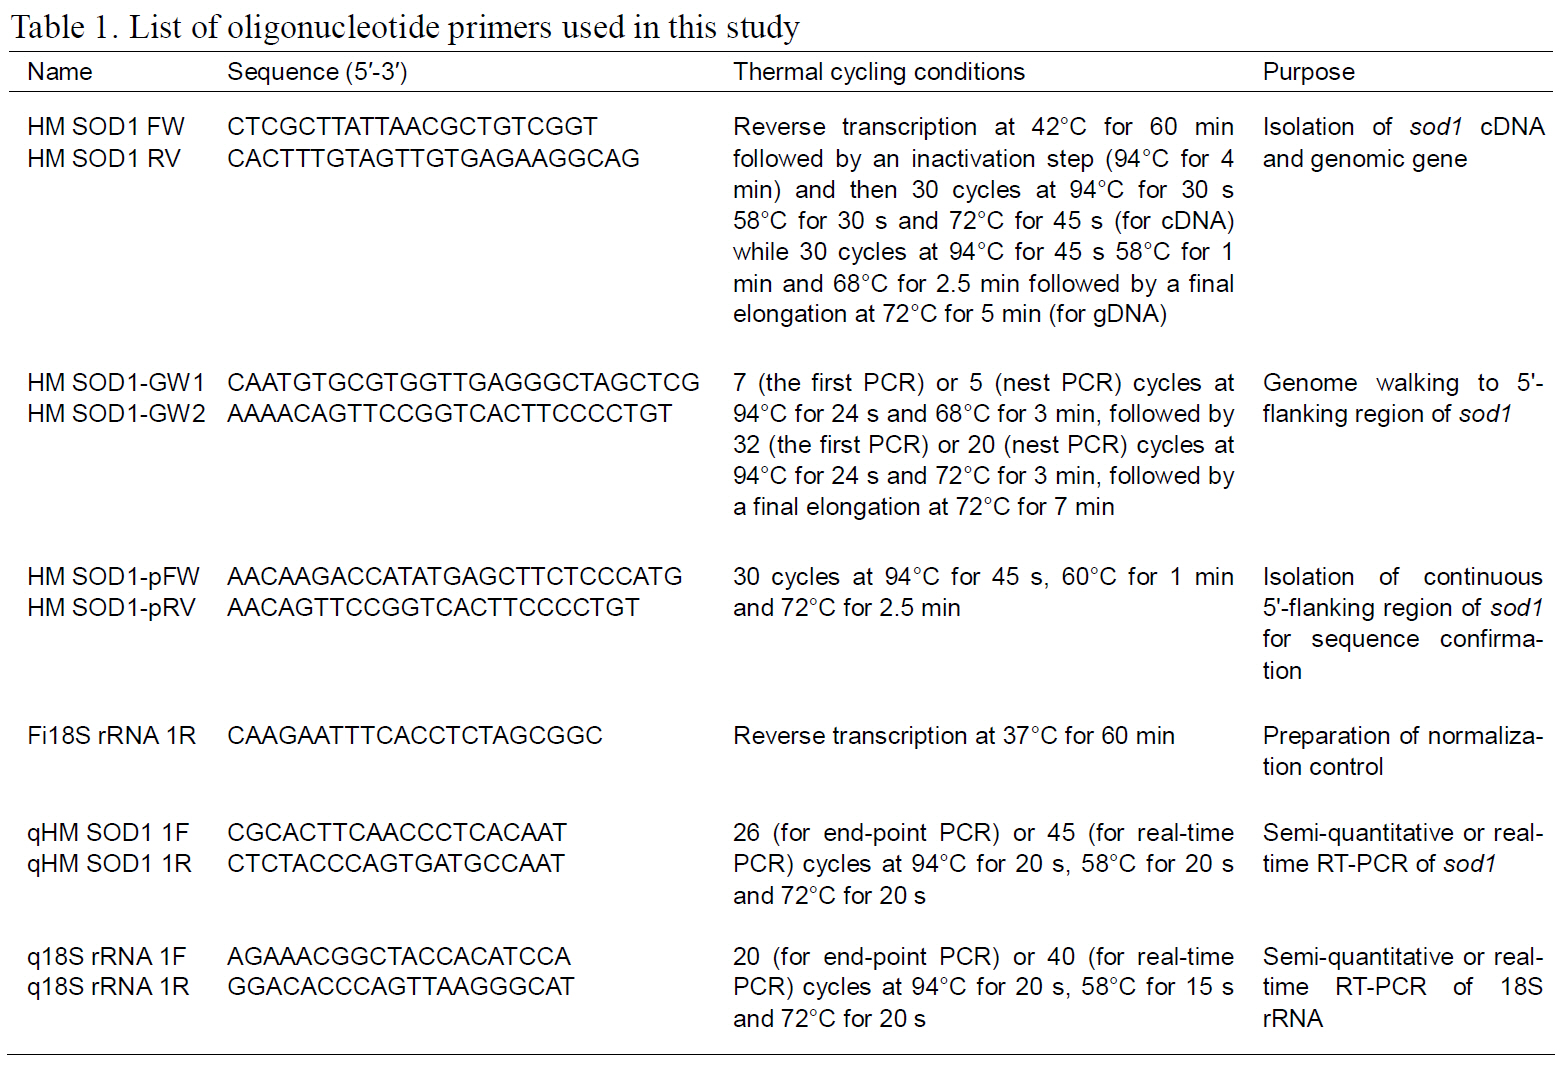
Information regarding the primers and thermal cycling conditions used in this study is provided in Table 1. RT-PCR was carried out using the AccuPower RT-PCR Premix (Bioneer, Daejeon,Korea) according to the manufacturer’s recommendation. Purified RT-PCR product was cloned into the pGEM®-T Easy Vector (Promega, Madison, WI,USA), and the insert DNA was sequenced from six randomly chosen recombinant clones.
Genomic gene sequence of H. mylodon Cu/Zn-SOD (hmsod1), containing a fragment spanning the start codon to the stop codon, was isolated by PCR amplification. Genomic DNA was prepared from fin tissue using a conventional SDS/proteinase K method(Cho et al., 2008), and 100 ng of purified genomic DNA was subjected to PCR amplification using the FidelityPlus PCR System (Roche Applied Science,Mannheim, Germany). The HM SOD1 FW and HM SOD1 RV primers were used, and PCR product was gel-purified using the AccuPrep Gel Elution Kit(Bioneer), TA-cloned, and sequenced (n=6) as described above.
Genome walking was performed using the GenomeWalker™ Universal Kit (BD Biosciences Clontech, Mountain View, CA, USA) to obtain the sequence of the 5'-upstream regulatory region of hmsod1. Briefly, genomic DNA (2.5 μg) was digested with a restriction endonuclease (EcoRV, DraI, PvuII,or StuI) and ligated with the adaptors according to the manufacturer’s instructions. First and second rounds of PCR amplifications were performed using two primer pairs, AP1 (adaptor forward primer provided in the kit; BD Biosciences Clontech) with HM SOD1-GW1, and AP2 with HM SOD1-GW2.Amplified products were TA-cloned and sequenced to generate a contiguous sequence. This 5'-upstream sequence was confirmed by sequence analysis of the PCR clones (n=5) amplified directly from the genomic DNA using HM SOD1-pFW and HM SOD1-pRV primers. The sequence data have been submitted to the GenBank databases under accession numbers FJ975147 (cDNA) and FJ975148 (genomic sequence).
cDNA sequence of hmsod1 was subjected to
NCBI BLASTx search (http://www.ncbi.nlm.nih.gov/blast) to examine homology with previously known vertebrate sod1 orthologs. The full-length cDNA sequence was also analyzed to identify putative ORFs using the ORF Finder in the NCBI web page (http://www.ncbi.nlm.nih.gov/gorf/gorf.html). Predicted molecular mass and theoretical pI values were calculated using the ProtParam tool(http://www.expasy.org/tools/protparam.html). Multiple sequence alignments at the nucleotide and amino acid levels were performed using ClustalW (http://align.genome.jp/). To compare the genomic structure and organization of hmsod1 with representative orthologs, we deciphered animal sod1 genes from the GenBank and Ensembl databases (http://www.ensembl.org/index.html) using text and BLAST searches.
Putative transcription factor binding sites in the 5'-flanking upstream region were identified using TFSEARCH (http://www.cbrc.jp/research/db/TFSEA RCH.html) and Transcription Element Search System(TESS; http://www.cbil.upenn.edu/cgi-bin/tess/tess).
Nucleotide sequences of the sod1 genes for representative teleosts were retrieved from GenBank and Ensembl and compiled. An abalone Haliotis discus discus (Mollusca; Gastropoda) sequence was used as an outgroup. The sequence data were aligned using ClustalW (Thompson et al., 1994) with the default setting for gap penalties in BioEdit 7.0.5 (Hall,1999). The aligned nucleotide sequence data matrix was subjected to maximum likelihood (ML) analysis in PAUP* 4.0b10 (Swofford, 2002). Model selection strategy using the Akaike Information Criterion(AIC) implemented in Modeltest 3.7 (Posada and Crandall, 1998) was used to determine the best-fit evolutionary model of nucleotide substitutions. ML tree was reconstructed with the GTR+I+Γ model using the likelihood settings, determined from Modeltest. ML analysis was performed using the heuristic search option with random addition of sequences (10-replicates) and tree-bisectionreconnection branch swapping. Robustness of tree topologies was evaluated by bootstrap analysis with 1,000 pseudoreplicates. Bayesian inference (BI)analysis was carried out using MrBayes 3.1.2(Ronquist and Huelsenbeck, 2003). A model selection strategy of AIC implemented in MrModeltest 2.3(Nylander, 2004) was used to determine the best-fit evolutionary model, and the GTR+I+Γ model was selected. Two independent Markov chains were performed with four simultaneous chains (three heated and one cold) with random starting trees for 1,000,000 generations, sampling trees at intervals of 10 generations. A total of 1000 of 10,001 resulting trees were discarded as ‘‘burn-in.’’ The remaining trees were used to construct a 50% majority-rule consensus tree and to estimate statistical supports for tree topologies determined on the basis of posterior probabilities.
To examine the tissue distribution and basal expression of hmsod1 transcripts, semi-quantitative RT-PCR assay was performed. Total RNA was extracted from eight somatic tissues including the brain, gill, heart, intestine, kidney, liver, muscle and spleen. Tissue samples were obtained from 16 healthy individuals (16.5±2.0 g body weight) and pooled within each tissue type prior to RNA extraction.Preparation of total RNA was carried out using the RNeasy Midi Kit (Qiagen, Hilden, Germany)including the DNase I treatment step according to the manufacturer’s recommendations. The integrity and purity of extracted total RNA were checked using 28S : 18S rRNA ratio in ethidium bromide (EtBr)-stained gels and/or spectrophotometry. A 2-μg of total RNA in a reaction volume of 20 μL was reversetranscribed at 37°C for 60 min using the Omniscript RTase (Qiagen) and the oligo d(T)20 primer (1 μM final concentration) according to the manufacturer’s protocol. To prepare a normalization control, a conserved reverse primer for fish 18S rRNA, Fi18S rRNA 1R primer (Cho et al., 2008), was also included in the reverse transcription (RT) reaction at 0.05 μM.When the RT reaction was finished, the cDNA was diluted two-fold (for sod1) or eight-fold (for 18S rRNA) with sterile water and then 1 μL of the diluted sample was subjected to PCR amplification using the AccuPower PCR Premix (Bioneer). PCR primers for sod1 (qHM SOD1 1F and qHM SOD1 1R) and 18S rRNA (q18S rRNA 1F and q18S rRNA 1R) were designed to amplify the 280- and 338-bp amplicons,respectively. Triplicate amplifications were carried out in independently. The amplified product was separated on agarose gel (1.5%) and visualized by EtBr staining. EtBr-stained bands for sod1 were normalized against 18S rRNA bands using the image analysis software, Quantity-OneTM implemented in VersaDoc 4000 (Bio-Rad, Hercules, CA, USA).
To examine the effect of bacterial challenge on the transcriptional modulation of hmsod1, an experimental injection of pathogenic bacteria, Edwardsiella tarda Gram (-) (FSW910410) was performed. Preparation of bacterial culture was carried out as described previously (Cho et al.,2009a). A freshly grown E. tarda (5×10³ cells) was resuspended in 100 μL of 0.85% NaCl solution. H.mylodon juveniles (13.2±2.5 g body weight; n=6)were given an intraperitoneal injection of the bacterial suspension. Similarly, a control group (n=6)was also prepared by injecting 0.85% NaCl solution only. Fish were transferred to cages within a tank containing 100 L of 5 ㎛-filtered tap water. The water temperature was held at 24±1°C and dissolved oxygen was 6±1-ppm. Fish were not fed after injection. Two days post-injection, the kidney and spleen tissues were surgically removed from each individual and pooled within tissues prior to total RNA extraction. Reverse transcription was performed using the total RNA samples from the kidney and spleen as described above. A 1 μL aliquot of the diluted cDNA template (two-fold for sod1 and eightfold for 18S rRNA) was subjected to real-time PCR amplification using 2× SYBR Green Supermix (Bio-Rad) and iCycler Real-Time Detection Module (Bio-Rad) according to the manufacturer’s protocol. The oligonucleotide primers were the same as those used for the end-point RT-PCR. Fluorescence was measured after each elongation step to estimate the average threshold cycle number (CT). The dissociation curve was examined after the final elongation to confirm the specificity of the PCR.Based on the standard curves, sod1 transcript levels were normalized against the 18S rRNA levels, and the relative expression of Mn-SOD transcripts in the bacteria-challenged group was expressed as a fold change relative to the saline-injected control using the comparative CT method described by Schmittgen and Livak (2008). Assays were carried out in triplicate per cDNA sample in an independent fashion.
The relative levels of basal expression of hmsod1 transcripts across different tissues were assessed by ANOVA followed by Tukey’s post-hoc test at a confidence level of 95% to ascertain whether any differences between the tissue groups were statistically significant. The difference in hmsod1 expression between bacteria- and saline-injected groups was tested by Student’s t-test using the SPSS software (ver. 10.1.3). Differences were considered significant when P<0.05.
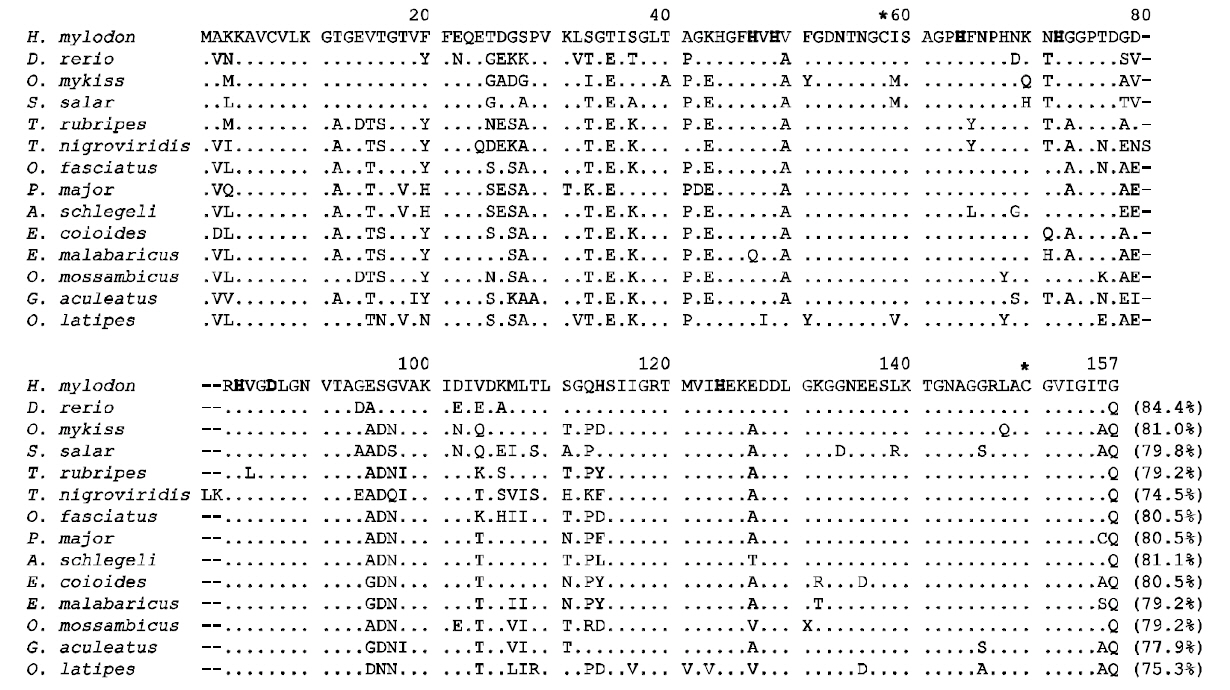
H. mylodon sod1 cDNA (796 bp) consisted of a 68 bp 5'-UTR, a 462-bp ORF encoding 154 amino acids, a 266-bp 3'-UTR including the stop codon and 20 bp poly (A+) tail (see GenBank accession number FJ975147). A putative polyadenylation signal(AATAAA) was found 16 bp prior to the poly (A+)tail. The deduced amino acid sequence contained putative Cu ligands (His47, His49, His64 and His124;positions in Fig. 1) and Zn ligands (His64, His72, His84 and Asp87), as well as two Cys residues (Cys58 and Cys150) that potentially form a disulfide bridge (Fig.1). Calculated molecular mass was 15755.64 Da, and the theoretical pI was 6.28. H. mylodon SOD1 exhibited considerable similarity in amino acid sequence to previously characterized teleost SOD1s,with the highest similarity of 84.4% to zebrafish SOD1 (Fig. 1). Common features, particularly with respect to the metal-coordinating residues, were clearly conserved in all of the species examined. Due
to the essential role of the SOD1, the structure and function are remarkably conserved across diverse organisms (Fukuhara et al., 2002; Zelko et al., 2002).The two Cys residues (Cys58 and Cys150; Fig. 1),forming a disulfide bridge, have been reported to play an important role in stabilizing the electrostatic loop located at the C-terminal region of the SOD1 enzyme(Ciriolo et al., 2001; Zelck et al., 2005). The clustering of charged residues (i.e. Glu136, Glu137,Lys140 and Arg147 in Fig. 1) within the electrostatic loop region is important for the electrostatic attraction of substrates toward the active site (Ciriolo et al.,2001).
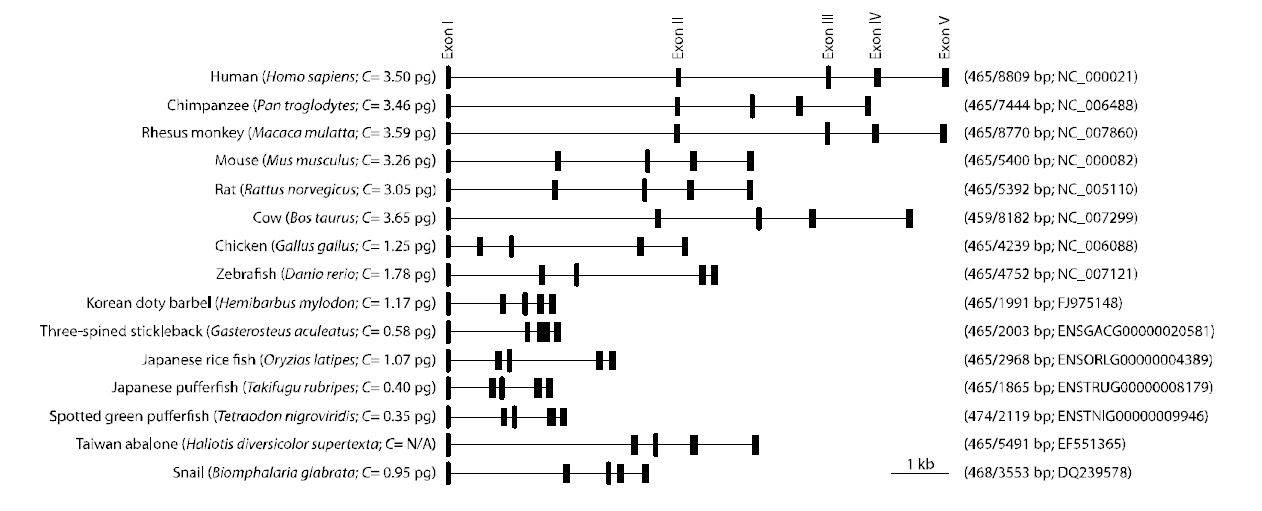
A single band for the sod1 fragment from H.mylodon genome was successfully produced by PCR.The amplified fragment for hmsod1 (2,171-bp)contained a 1,911 bp genomic sequence from the start codon to the stop codon, in which five exons (72, 97,70, 118 and 108-bp for exons I to V, respectively)were interrupted by four introns (875, 303,177 and 91 bp for introns I to IV, respectively). The coding sequences of the genomic clearly matched the cDNA sequence. The consensus GT/AG rule was conserved at all exon/intron boundary regions. The quinquepartite organization (five exons interrupted by four introns) is a typical structure for most known animal sod1 genes (Fig. 2). Despite the relative abundance of cDNA information on fish sod1, the genomic sequence of the teleost sod1 gene has not been fully determined. We also deciphered several preliminary sod1 gene sequences from publically available fish genome databases. We found that all of the fish species examined, with the exception of Gasterosteus aculeatus, which possesses only four exons, showed highly conserved quinquepartite genomic organization of the sod1 genes (Fig. 2). Exon sizes were as follows: 72-75 bp for exon I, 91-99 bp for exon II,66-70 bp for exon III, 115-120 bp for exon IV, and 108-111-bp for exon V (also refer to GenBank accession numbers or Ensembl IDs provided in Fig.2). Thus neither sizes of each exon in the hmsod1 gene nor the total exon length differed significantly from those of other animal species. In contrast, intron lengths were quite variable depending upon species,with human sod1 exhibiting the largest introns (8,344 bp in total). Consequently, the genomic length from the ATG start codon to the stop codon of sod1 was related, but only roughly so, with the genome size (C value) of the animal species.
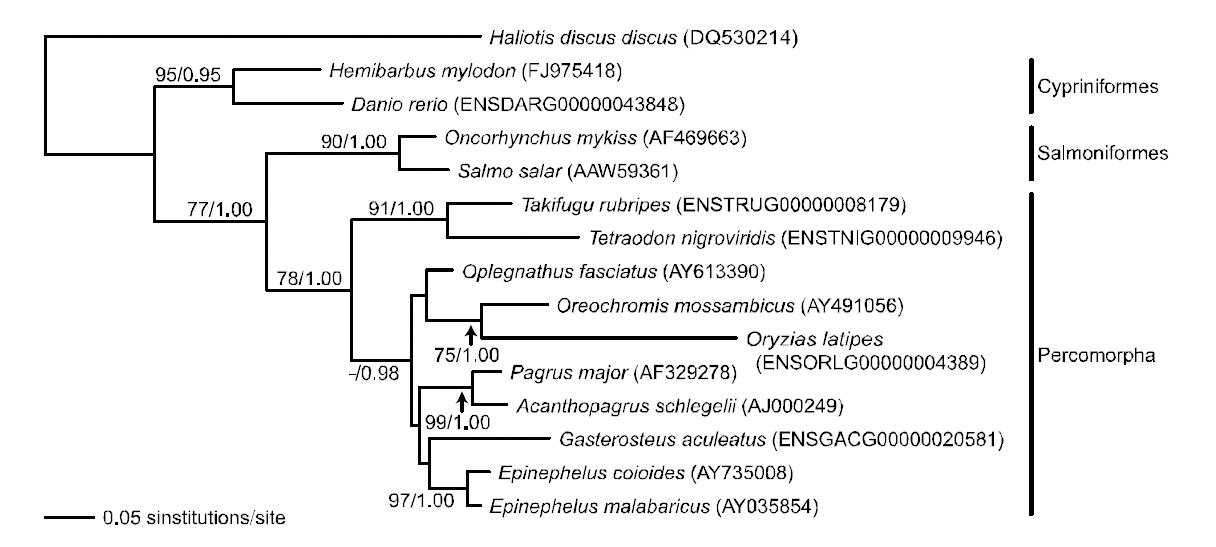
Phylogenetic tree was reconstructed based on sod1 sequence data matrix (Fig. 4). In ML and BI trees,teleost fishes were divided into two major clades; Danio rerio and H. mylodon belonging to the order Cypriniformes in the Ostariophysi formed a monophyletic group and were phylogenetically separated from the other teleosts, which formed another monophyletic group. The overall structure of the
phylogenetic relationship among fishes was similar to previous relationships established using sod1 sequences (either nucleotide or amino acid sequences) in the vertebrate lineage (Kim and Nam,2006). Within the latter clade, Oncorhynchus mykiss and Salmo salar belonging to the Salmoniformes in the Protacanthopterygii, and the other teleosts belonging to the Tetraodontiformes, Perciformes or Beloniformes in the Percomorpha were subdivided into two monophyletic groups. Within the percomorph clade, tetraodontiform T. nigroviridis came up first and was followed by a monophyly of perciform and beloniform fishes in the BI analysis,although this relationship was not supported statistically in the ML analysis. Overall, the phylogenetic assumption inferred from the fish sod1 gene was in accordance with the conventional higherlevel teleostean relation-ships estimated using the complete mitogenome sequences of Miya et al.(2001), which showed the sequential ramification of Ostariophysi-Protaca- nthopterygii-Percomorpha.
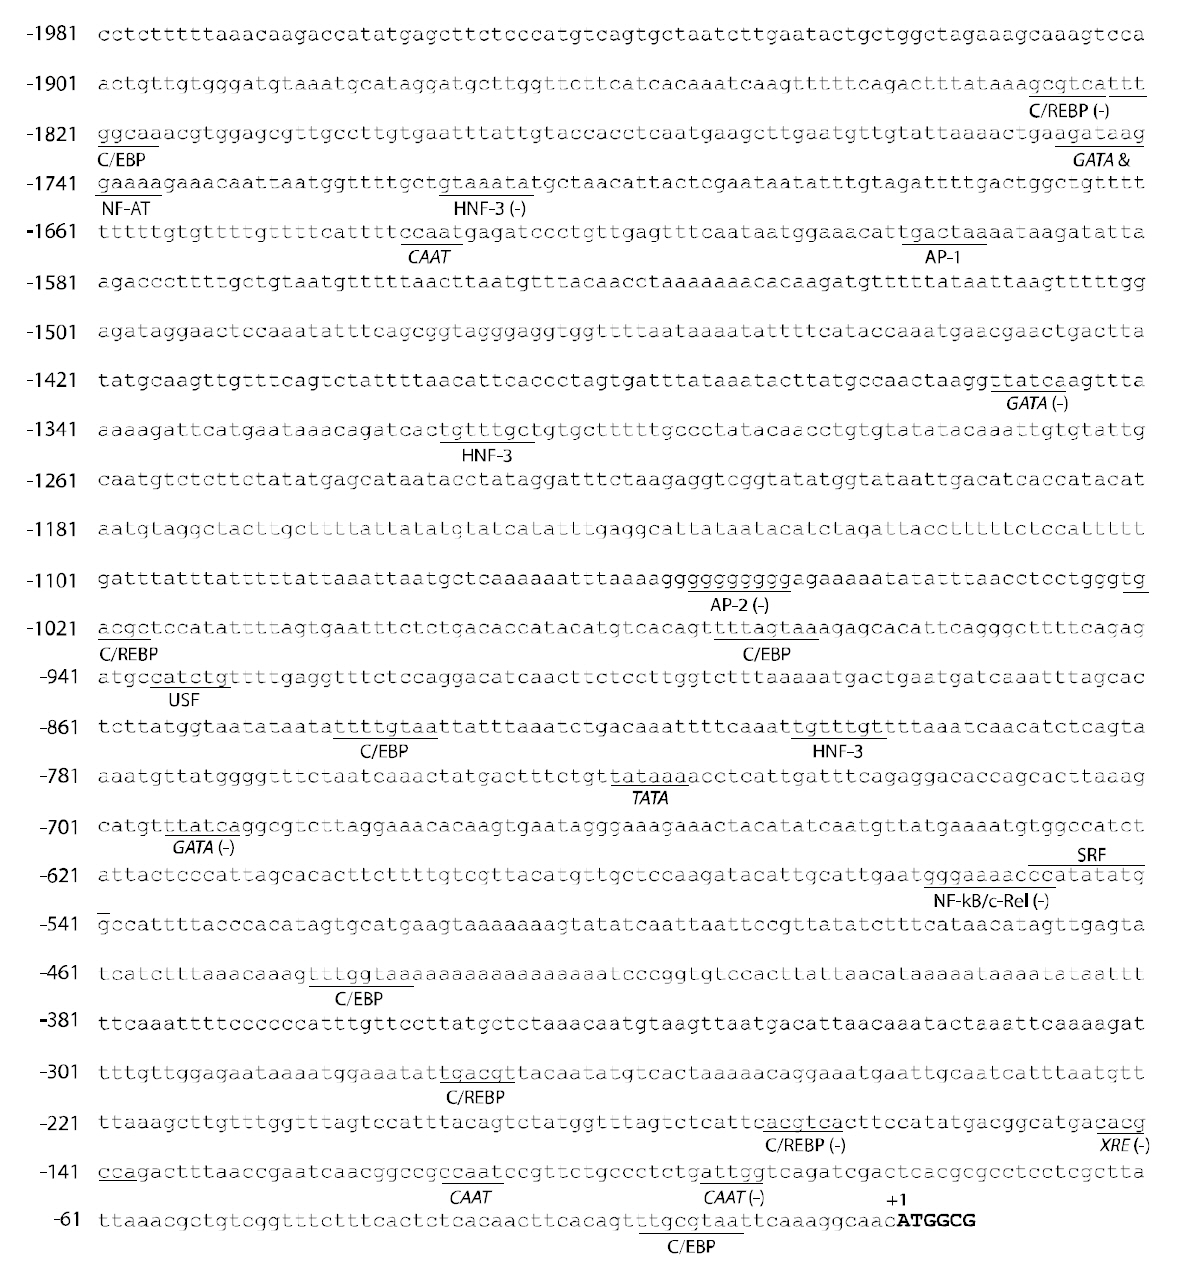
A 1,981-bp 5'-flanking upstream fragment was obtained by the genome walking and putative transcription factor binding sites were predicted (Fig.3). The upstream region of hmsod1 exhibited a TATA box (TATAAA) at a relatively distant position (742 bp before the start codon) and three CAAT boxes(CCAAT; two copies at the proximal region and one at the distal region). In addition to these universal
transcription factor binding elements, the hmsod1 regulatory region represented a variety of binding motifs for transcription factors involved in stress- and immune-responses. These included cAMP-response element binding protein (C/REBP; consensus binding sequence=TGACGY), CAAT-enhancer binding protein(C/EBP; TTDNGNAA), nuclear factor for activated T-cells (NF-AT; WGGAAA), activating protein-1 (AP-1; TGASTMA), AP-2 (CCCMNSSS),upstream stimulatory factor (USF; CANNTG),nuclear factor kappa B (NF-κB; GGGRNNYYCC)and serum response factor [SRF; also known as a CArG box binding protein; CC(A/T)6GG]. The hmsod1 promoter also contained a copy of xenobiotic response element (XRE; TNGCGTG) in the proximal region (145-bp from the start codon in a reverse orientation). Although the specific roles of these factors in the orchestration of the sod1 gene expression remain to be explored in teleosts, many of them are known to be involved in the transcriptional regulation of mammalian sod1s under stimulatory or inflammatory conditions (Rojo et al., 2004; Afonso et al., 2006). Thus, extensive examinations of hmsod1 expression in response to designed stress treatments or immune challenges are needed to better hypothesize the specific or coordinated roles of these transcription factors. Conversely, the XRE is the target of a protein complex including a ligand-
activated aryl hydrocarbon receptor (AhR), widely known to be responsible for the recognition of exogenous environmental pollutants in eukaryotic cells (Ryu et al., 1996). XRE is usually found in the promoter region of xenobiotics-metabolizing battery genes, such as cytochrome P450 (Ryu et al., 1996),glutathione S-transferase (Pimental et al., 1993), and UDP-glucuronosyltransferase 1A1 (Yueh et al., 2003),as well as mammalian sod1 (Yoo et al., 1999a; Park and Rho, 2002). The identification of XRE in this study is also in agreement with previous observations on the differential modulation of sod1 in other fish species exposed to xenobiotic compounds (Pedrajas et al., 1998; Shi et al., 2005; Vega-Lopez et al., 2007).However unlike murine sod1 (Yoo et al., 1999b), the hmsod1 did not possess a metal-responsive element(MRE) in its promoter region, although heavy metal exposure could stimulate sod1 transcription in this species as well (see Cho et al., 2009b). This suggests that the induced expression of hmsod1 during heavy metal exposure might be related to the general defense mechanism against prooxidative forces arising from excess heavy metal ions rather than a direct MRE-mediated pathway (however see, Yoo et al., 1999b).
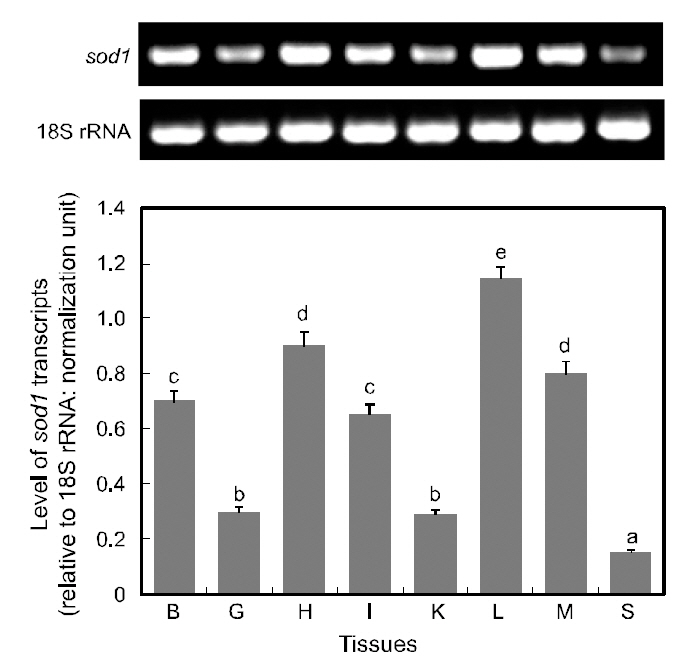
RT-PCR assay detected ubiquitous expression of sod1 transcripts in all the tissues examined, with various basal expression levels among tissues (Fig. 5).Of the eight tissues examined, the liver displayed the highest expression of sod1 transcripts, and followed by the heart and muscle (P<0.05). The brain and intestine exhibited moderate levels of sod1 expres-
sion, while gill and kidney tissues expressed only weak level expression levels and spleen exhibited the lowest level of sod1 transcripts (P<0.05). The detection of sod1 transcripts in a wide array of tissue types is not surprising, given that superoxide dismutase is one of the key housekeepers involved in general host protection against biological oxidation(Zelko et al., 2002). The results of this study are consistent with many previous reports on the variable basal levels of sod1 transcripts across different tissue types (Cho et al., 2006; Nam et al., 2006). Furthermore,our finding of robust expression of sod1 transcripts in the liver is consistent with the presence of multiple binding motifs for liver-enriched transcription factors such as C/EBP and hepatocyte nuclear factors (HNFs), in the 5'-upstream regulatory region of hmsod1[see Cho et al. (2009a)]. The important role of C/EBP in the liver-predominant expression of rat sod1 has also been reported previously (Kim et al., 1997).
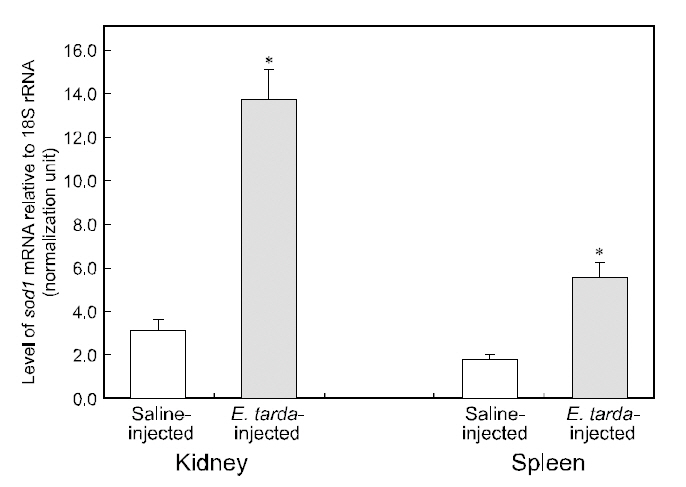
No mortality was detected during the period (48 h)of the bacterial challenge using E. tarda. However injection of E. tarda suspension induced significant up-regulation of hmsod1 transcripts in kidney and spleen. Rreal-time RT-PCR assay revealed that the amounts of hmsod1 transcripts in kidney and spleen from bacteria-challenged fish were more than fourfold and three-fold, respectively higher than those observed in saline-injected control fish (P< 0.05). To date, the transcriptional regulation of fish sod1 in response to bacterial challenge has rarely been exploited in other species; however, previous observations on non-teleostean species have indicated that exposure to endotoxic agents can induce oxidative damage (Ghosh et al., 1996; Choi et al.,2006; Li et al., 2008; Ji et al., 2009). The present expression data for hmsod1 are also consistent with the presence of binding sites for immune-relevant transcription factors in its 5'-upstream regulatory region. Several studies on aquatic invertebrate species(e.g., mollusks or crustaceans) have also indicated that sod transcription could be significantly modulated by infection with bacterial pathogen(s)(Cheng et al., 2006; Wang et al., 2008; Li et al., 2010).Additionally, Reyes-Becerril et al. (2008) reported that dietary supplementation of live yeast resulted in the elevation of SOD activity in the gilthead seabream (Sparus aurata) liver, which may support,at least in part, our finding of the stimulated transcription of hmsod1. Further, results of this study are similar to our recent observations of the upregulated expression of the mitochondrial type of manganese SOD (Mn-SOD; sod2) from this species upon bacterial challenge (Cho et al., 2009c).Increased sod expression upon bacterial challenge has been generally recognized as an antioxidant defense action to scavenge or neutralize the ROS released during the proinflammatory cytokine response to bacterial toxins (Marikovsky et al., 2003). Further studies examining fish-to-fish variability in the transcriptional response to immune challenges would be of value. Specifically, real-time PCR analysis should be performed with individual samples rather than pooled RNA samples.
In summary, the molecular structure of the sod1 gene was characterized in H. mylodon, an endangered freshwater fish species. The results of this study indicate that hmsod1 exhibits the typical structure of vertebrate sod1 genes at both the mRNA and genomic levels. A bioinformatic analysis of the 5'-flanking region suggested that various transcription factors may confer stress-related and/or tissue-specific modulation of hmsod1. From this basis, further studies should examine the unique or coordinated roles of predicted transcription factors in the regulation of hmsod1 in response to different biotic and abiotic factors.