The earth may be considered as a huge magnet and thus it has magnetic poles. At present, the magnetic north deviates from the earth’s axis of rotation, the true north, by about 12°, and it rotates around the true north in a period of 2,000-3,000 years. Hence, the two magnetic poles, the magnetic north and the magnetic south, are not identical to the true north and the true south, the declination has been defined. The variation of the declination is related to the variation of the geomagnetic field that is known to have a certain pattern. It is significant that the variation of the geomagnetism has regularity because the geomagnetic variation is closely related to our daily life (electrical power, communication, and watercourse system, etc.). The geomagnetic variation is also closely related to the cosmic radiation at an altitude of commercial aircrafts (Hwang et al. 2010).
In this study, we performed a statistical analysis using the data from the magnetometer established at Mt.Bohyun for the years of 2008 and 2009. This study is significant in that it is the first statistical study using the magnetometer at Mt. Bohyun (BOH magnetometer). We statistically investigated the trend of the individual elements of the geomagnetism (the horizontal magnetic field component H, the declination D, and the vertical component Z) as well as their correlations according to the external changes. For this, we analyzed the trend of the diurnal variation in each month, the seasonal variation and the variation depending on the local time (LT) of the H, D and Z components. In addition, considering that the geomagnetic variation may be influenced by the solar activities, directly and indirectly, we attempted to analyze the pattern of the geomagnetic variation in connection with various geomagnetic activity indices. It is notable that the geomagnetic observation data were not classified according to the geomagnetic activity levels in this preliminary analysis. For instance, the analysis might have been conducted by differentiating the geomagnetic activity levels using indices such as Kp index, we did not try this in this article. Because this study is very preliminary result to be extended to the more detailed analysis, we leave that kind of analysis as a future research topic.
The Korean Astronomy and Space Institute established three types of magnetometers at Mt. Bohyun Observatory in 2007 and 2009, and it has operated them until now. The magnetometer (RFP-523C) installed at the Mt. Bohyun Observatory is composed of the fluxgate sensor that measures the three-axis components, H, D and Z, and the Overhauser proton sensor that measures the absolute total magnetic field flux. The fluxgate sensor measures the three-axis components at one-second intervals and the Overhauser proton sensor measures the absolute total magnetic field flux at five-second intervals. The left of Fig.1 shows the fluxgate sensor and the middle is the Overhauser proton sensor. The magnetometer data are recorded on the basis of the universal time (UT) 24 hours a day. Table 1 shows the geographic and geomagnetic positions of BOH magnetometer. Table 2 shows the period when BOH magnetometer data are available. In this article, we used the fluxgate data between 2008 and 2009. We use following methods to investigate the tendency of the data.
The three components of the geomagnetic field (H, D and Z) showed similar patterns. Thus, we selected following four positions, recorded the approximate time at each position and investigated how the time at these four positions changed in each month in order to understand not only the diurnal variation but also the annual variation.Each of the components showed a similar pattern in the variation but the four positions were not clearly identified on some specific days. Hence, we defined following requirements to select the four positions:
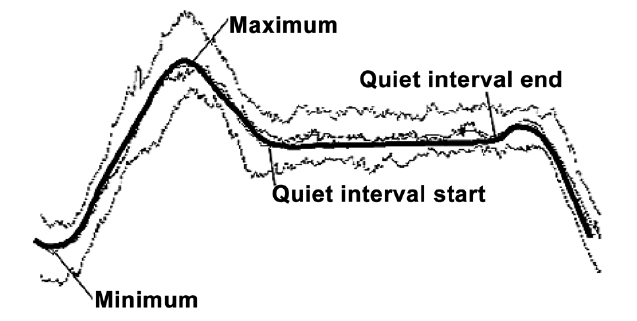
(1) The four positions are defined as follows as described in Fig. 2:
- Minimum: the smallest value among the local minima
- Maximum: the greatest value among the local maxima
- Quiet interval start: the initial point where the gradient is drastically changed following the minimum or the maximum (the point where the interval of which gradi-
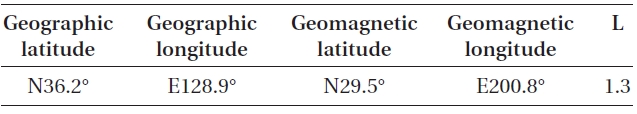
[Table 1.] Geographic and geomagnetic location of BOH magnetometer.

Geographic and geomagnetic location of BOH magnetometer.
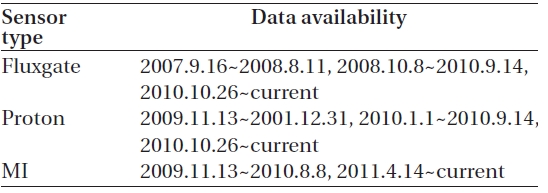
[Table 2.] Data availability of BOH magnetometer.

Data availability of BOH magnetometer.
ent is relatively closer to zero than that of other intervals is started.)
- Quiet interval end: the initial point where the gradient is drastically changed following the minimum or the maximum after the quiet interval has started (the point where the interval of which gradient is relatively closer to zero than that of other intervals is ended.)
(2) Basically, the four points are selected with reference to the mean plot (black line).
(3) If there are a few minimums or maximums and their magnitude is not clearly distinguished, the local minimum or the local maximum located at the times near to the minimum or the maximum of the previous or next plot is designated as the minimum or the maximum.
(4) If there is no minimum or maximum in the range of one or two hours, the point at the time for the minimum or the maximum of the previous or next plot is designated as the minimum or the maximum, considering the pattern.
(5) If the starting point or the end point of the quiet interval is not clearly identified, the point that has the mean gradient of two lines that have almost constant gradients in the range to the both sides, wider than three hours and near to the start point or the end point of a quiet interval of the previous or next plot, is designated as the start point or the end point of the quiet interval.
We investigated the diurnal variation pattern in each month by defining the four points in such a way, recording the time for the four points and comparing the time with each other.
The diurnal variation in each season represents the mean, the median, the first quartile and the third quartile of the three geomagnetic components during a day, and its pattern is similar to that of the diurnal variation in
each month. Hence, for the diurnal variation in each season,the minimum, the maximum, the start point and the end point of the quiet interval were defined in the same manner for the diurnal variation in each month.
We investigated the diurnal variation in each season by recording the time for the four points defined in the similar method for the diurnal variation in each month and comparing the time with each other.
2.3 Annual Variation at Four Time Sections
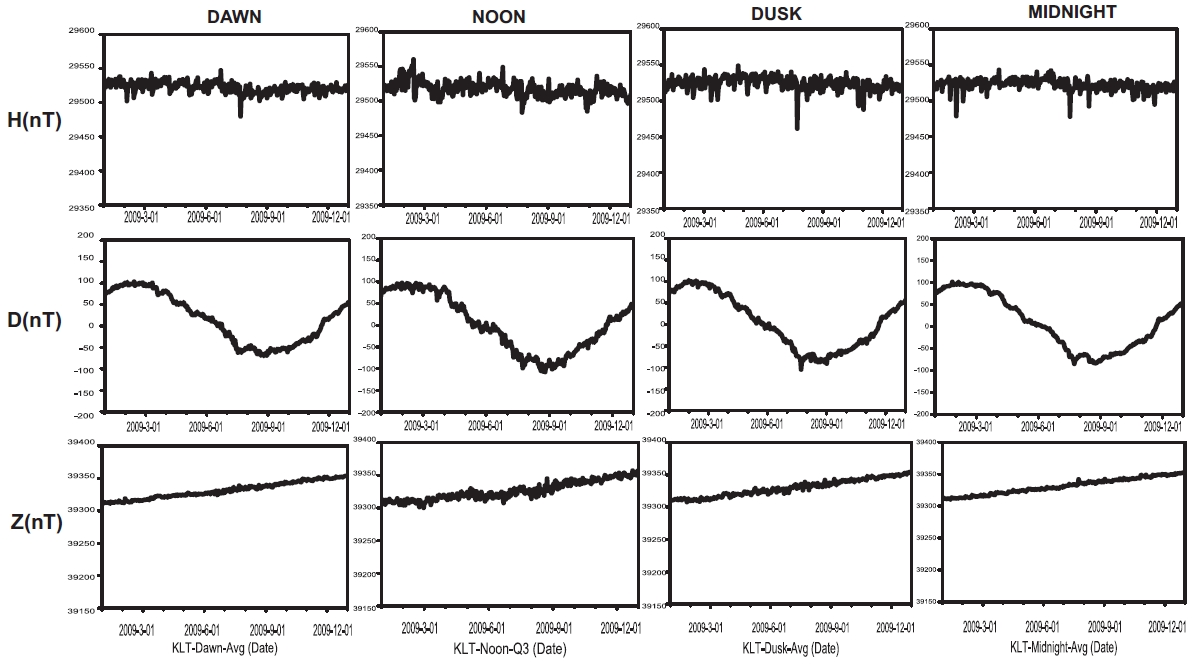
The annual variation at each time interval was shown as a plot by converting the geomagnetic data presented in UT into the LT of Korea and dividing them into the four time sections including dawn (03-09 LT), noon (09-15 LT), dusk (15-21 LT) and midnight (21-03 LT). Since each of the geomagnetic components showed a different and distinctive variation pattern in a year, we summarized the variation patterns.
2.4 Comparison with Activity Indices
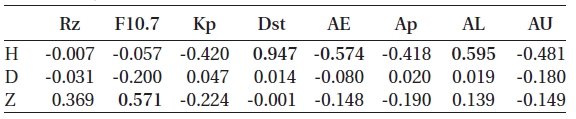
We calculated the Pearson correlation coefficients for each geomagnetic component (H, D and Z) using the scatter plots with respect to the activity indices (Rz, F10.7, Dst, Kp, Ap, AU, AL and AE) to find out the correlation between the geomagnetic data and the activity indices.
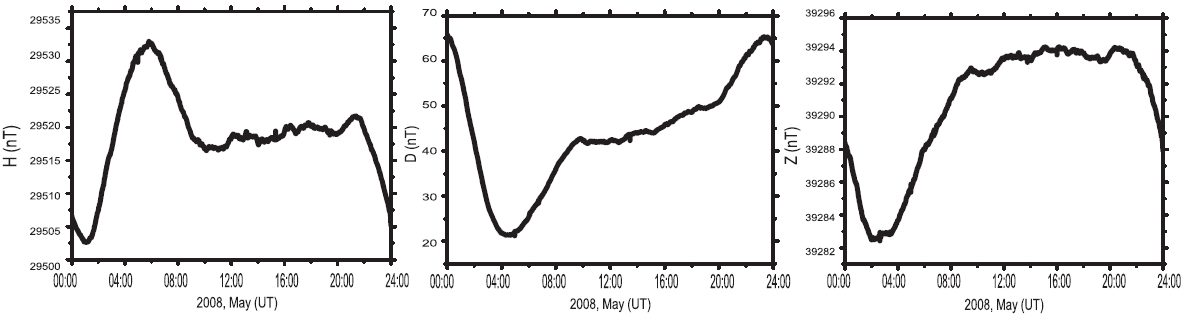
Although the length and width of the intervals of the variation of H, D and Z were different from month to month, they showed a pattern shown in Fig. 3 in general. Fig. 3 shows the mean of the geomagnetic variation in one month of May, 2008. Table. 3 and 4 show the time intervals of the four points defined for the pattern of H in each month (the minimum, the maximum, the start point and the end point of the quiet interval). The minimum was at 02:28, the maximum at 06:28, and the start point of the quiet interval at 10:06 and the end point of the quiet interval at 21:40 in average. These values are all UT and conversion to the LT of Korea (KLT, UT+9) gives the minimum at 11:28, the maximum at 15:28, the start point of the quiet interval at 19:06 and the end point of the quiet interval at 06:40. Considering the values in connection with the location of the sun in a day, the time for the minimum, 11:28, is the time about 32 minutes before the meridian. The time for the maximum, 15:28, is the time 3 hours and 28 minutes after the meridian. The time for the start point of the quiet interval, 19:06, is close to the sunset time whereas the time for the end point of the quiet interval, 06:40, is close to the sunrise time. This indicates that the quiet interval ends as the sun rises and the H value starts to decrease gradually. It continues to decrease to the minimum at the time 30 minutes before the meridian, and then it gradually increases three or four hours after the meridian, reaching the maximum. Later, it gradually decreases again until the quiet interval begins around the sunset time. The H value is almost constant in the quiet interval between the sunset and the sunrise, which indicates that the H value is varied by the sun.
The length and width of the intervals of the variation of Z were also different from month to month; they showed the pattern shown in Fig. 3 in general. Different from the pattern of the H value that showed a wide range of variation,the Z component showed a more distinctive pattern in general and the range of variation was relatively small. Table. 5 and 6 show the time for the three points (the minimum and the start and end points of the quiet interval) defined with respect to Z in each month. The maximum was not designated since it was hard to find a consistent maximum point of Z. The minimum was at 02:55, the start point of the quiet interval at 09:07, and the end point of the quiet interval at 21:33 in average. These values are all UT and conversion to the KLT gives the minimum at 11:55, the start point of the quiet interval at 18:07 and the end point of the quiet interval at 06:33. Considering the values in connection with the location of the sun in a day, the pattern is similar to that of H to some extent, except that there was not a distinctive maximum. The quiet interval is ended and the Z value gradually decreases as the sun rises. It continues to decreases until the time about 35 minutes before the meridian, reaching the minimum. Later, it gradually increases until 18:07 when the quiet interval starts and then it remains constant.
Also in the case of D, the length and width of the intervals of the variation were different from month to month, but they showed the pattern shown in Fig. 3 in general. The pattern was almost same with that of H and X, but the deviation was much greater. Table. 7 and 8 showed the times for the four defined points in each month. The minimum was at 04:47, the maximum at 00:12, and the start point of the quiet interval at 09:06 and the end point of the quiet interval at 21:22 in average. These values are all UT and conversion to the KLT gives the minimum at 13:47, the maximum at 09:12, the start point of the quiet interval at 18:06 and the end point of the quiet interval at 06:22. Considering the values in connection with the location of the sun in a day, the interpretation on the variation of D is similar to that of H and Z.
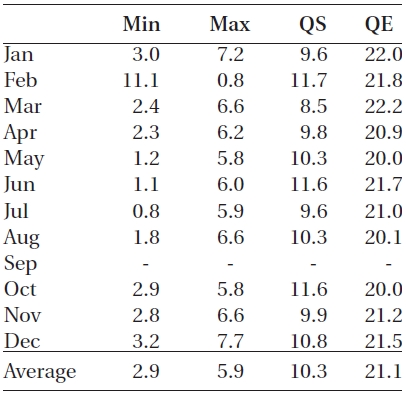
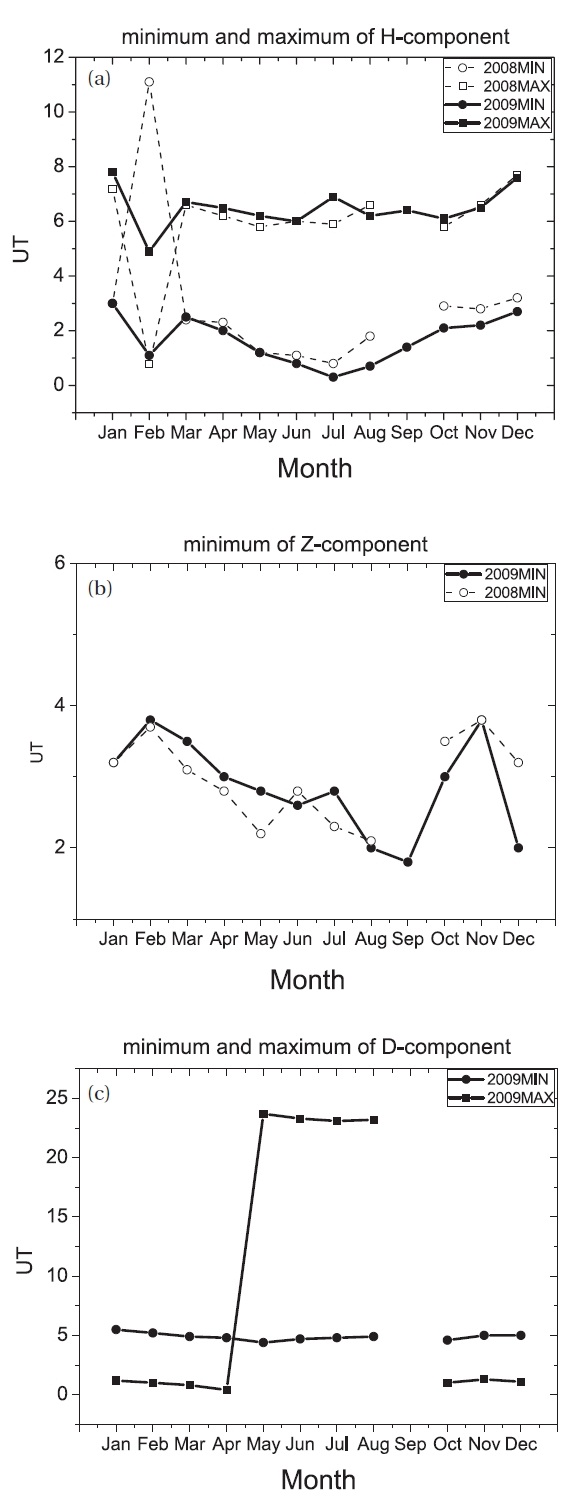
In Table 3, the time for the minimum is around 3 o’clock and that for the maximum around 6 o’clock. Conversion to the KLT gives the minimum around 12 o’clock and the maximum around 15 o’clock. The diurnal variation of the magnetic field shows the minimum and the maximum because of the effect of the Sq current. When the eddy type's Sq current system firstly confronts the Mt. Bohyun Observatory, the geomagnetic field of the Sq current system is directed downwards and thus the H component of the geomagnetic field experiences decrease. At that time, the H component value reaches the minimum. As the center of the Sq current system passes through the Mt. Bohyun Observatory, the geomagnetic field of the Sq current system is directed upwards and thus the H component of the geomagnetic field is increased. At that time, the diurnal variation of H reaches the maximum. When the eddy type's Sq current system comes out of the Mt. Bohyun Observatory, the H component remains constant.One thing notable was that the time for the minimum and the maximum in February was greatly deviated from the general trend as shown in Table 3 and Fig. 4a, of which reason has not be clarified yet. We presumed the possibility that a great change in the geomagnetic activity might have affected but there was not a geomagnetic storm or substorm that was great enough to affect the geomagnetic variation in February.
For a precise analysis of pure geomagnetic diurnal variation, the analysis should be performed only for the geomagnetically quiet days when the Kp is small (for example,international quiet days). Although we did not adopt such a method in this study, as the observation period (2008-2009) is near the solar minimum where the
[Table 3.] Monthly variation of defined four points of H component during 2008 (UT hour).

Monthly variation of defined four points of H component during 2008 (UT hour).
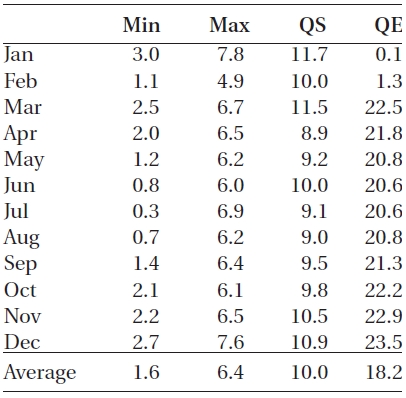
[Table 4.] Monthly variation of four points of H component during 2009 (UT hour).

Monthly variation of four points of H component during 2009 (UT hour).
[Table 5.] Monthly variation of three points of Z component during 2008 (UT hour).

Monthly variation of three points of Z component during 2008 (UT hour).
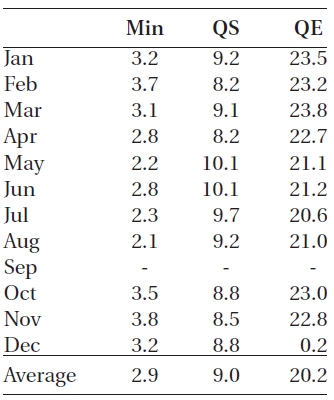
[Table 6.] Monthly variation of three points of Z component during 2009 (UT hour).
Monthly variation of three points of Z component during 2009 (UT hour).
[Table 7.] Monthly variation of four points of D component during 2008 (UT hour).
Monthly variation of four points of D component during 2008 (UT hour).
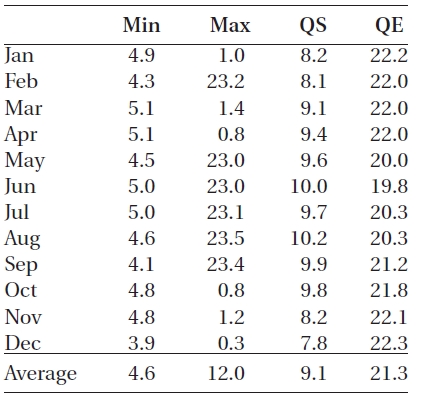
[Table 8.] Monthly variation of four points of D component during 2009 (UT hour).

Monthly variation of four points of D component during 2009 (UT hour).
solar activity is weak, the effect of the Sq current was observed relatively well. However, it is definite that the effect of the geomagnetic activity with a high Kp is mixed in the result somehow.
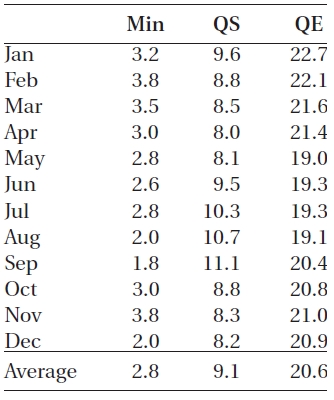
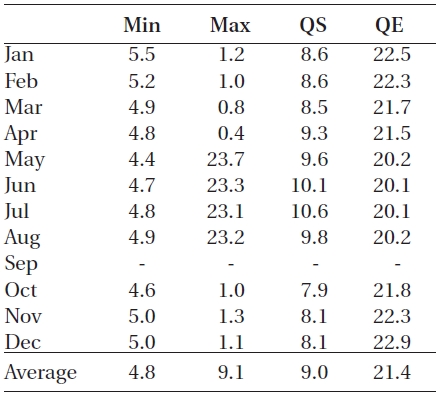
In the case of H component, the time of the points that we defined was continuously changed as time changed from January to December. We found there are a certain pattern in their change; it was sometimes fast and sometimes slow. In the case of the minimum, the time when the H value reached the minimum continuously became earlier (the earliest in summer between July and August) and then it became late. The maximum and the end point of the quiet interval showed a similar pattern. On the contrary, the start point of the quiet interval continuously became later in winter from January (the latest in summer in July) and then it became early. Since the start point of the quiet interval is around the sunset time, it became late in summer between July and August, while it became early in winter around January, which indicates that the start point of the quiet interval follows the sunset time. This result shows that the geomagnetic field depends on the seasons. That the geomagnetic field is affected by the seasons means that the different periods of time when the sun is up in the sky in each season causes the geomagnetic variation because the earth’s axis of rotation is tilted.
The Z value also showed a trend for the time intervals in each month to some extent as in the case of the H value. The time when the Z value reached the minimum continuously became earlier from January (the earliest in August) and then it grew late. The end point of the quiet interval also became earlier from January, reaching the earliest in August, and then it grew late. On the contrary, the start point of the quiet interval continuously became later from January (the latest between July and August) and then it grew early. Hence, it was verified that the Z value also has a regular pattern for each season.
In the case of the D value, as in the cases of the H and Z values, the minimum, the maximum and the end point of the quiet interval were late in winter and early in summer.However, the start point of the quiet interval was early in winter and late in summer. This showed that all the components of the geomagnetic field have a regular variation pattern over the seasons. Fig. 4 shows the summary of the minimums and the maximums of the H, D and Z values in Table. 3 to 8 with the plots in order to present the seasonal variation pattern more clearly.
3.3 Annual Variation at Four Time Sections
While a similar pattern was found in the diurnal variation of H, D and Z, each of them showed a unique annual variation pattern. To examine the trends of the H, D and Z components according to the LT, the LT interval was divided into four time sections; dawn (03-09 LT), noon (09-15 LT), dusk (15-21 LT) and midnight (21-03 LT). The plot in Fig. 5 shows the variation between 2008 and 2009. We performed a superposed analysis: all the data in the dawn section for all the days in the year of 2008 were superposed together and the mean, the first quartile, the median and the third quartile of the H, D and Z values were found at each time section. The bold line in Fig. 5 represents the mean values. In the case of the H component, the value was irregularly varied, as if fluctuating, and it increased little by little between the fluctuations but it sometimes decreased drastically. In the case of the D component, the pattern was almost constant, having the maximum around March and the minimum around September. The D component showed a periodicity in each year, different from the H and Z components. Some of the values deviated from the trend, but the deviation was less than that of the H and Z components. In the year 2010, the maximum was found on March 2nd, and the minimum on August 28th. The Z component showed an overall increase though the value was varied irregularly as if fluctuating. In addition to the overall trend, we investigated the gap between the first quartile and the third quartile (deviation, hereafter). The deviation
was relatively larger in the noon section than in other intervals, while it was the smallest in the midnight section. The dawn and dusk sections had a similar deviation which was between those of the noon and the midnight sections. Considering the annual geomagnetic variation depending on the LT, the noon section, between 9 o’clock in the morning and 3 o’clock in the afternoon, is the time after the sunrise, including the meridian, and a little before the sunset, when the observation location is influenced by the sun the most. On the contrary, the midnight section, between 9 o’clock in the afternoon and 3 o’clock in the morning, is the time after the sunset and a little before the sunrise, when the observation location is influenced by the sun the least. Therefore, the deviation in each time interval showed that the geomagnetic variation may take place locally by the sun and that there is almost no deviation in the geomagnetic variation in the time interval when the solar effect is less as at night. Moreover, it can be assumed that the geomagnetic variation over days may be because of the sun.
3.4 Comparison with Activity Indices
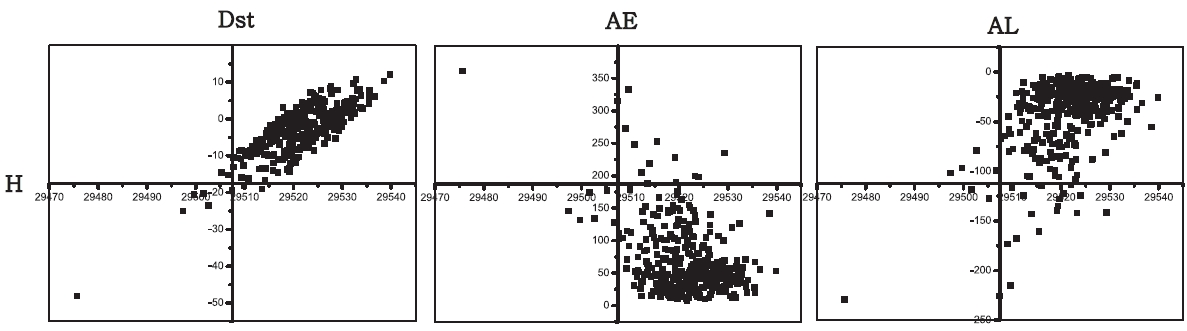
We employed the Pearson’s correlation coefficient to investigate the correlation between the activity indices and the geomagnetic field more clearly. We summarized the correlation coefficients among the H, D and Z values and the activity indices in terms of the Pearson correlation coefficient as shown in Table 9. Fig. 6 shows the mean value of the H component in a day and the mean values of the individual geomagnetic activity indices in a day in a scatter plot, which contains 365 points. The highest correlation was found between H and Dst (r = 0.947). The activity indices that showed a relatively higher correlation with the H component were AL, AE and AU in order. Hence, it was found that the geomagnetic data we used contained the effect of the ring current and auroral current, caused by the geomagnetic storms and substorms. The Dst index, which is the mean H value near the equator, and the geomagnetic field at Mt. Bohyun had a similar variation pattern. A strong correlation coefficient (r = 0.947) was found between these two data. However, the Dst index showed a different pattern with respect to the AE, AL and AU indices. Basically, the AL index showed a positive correlation, but the AE and AU showed a negative correlation. The AL index showed a considerably strong positive correlation in general (r = 0.595), which indicates that the geomagnetic field and the AL index may be correlated with each other to some extent. The AE and AU indices also showed a strong correlation(r = -0.574 and -0.481). Thus, the AE and AU indices were not totally out of the correlation with the geomagnetic field but there was a negative correlation to some extent; the movement toward the opposite direction of the horizontal geomagnetic component variation
[Table 9.] Pearson correlation coefficients between H D Z and geomagnetic activity indices.

Pearson correlation coefficients between H D Z and geomagnetic activity indices.
should not be neglected. This indicates that the Dst index based on the equator region is more correlated with the horizontal component, H, in Korea than that of the AE, AL and AU indices. Additionally, it is also inferred that the ring current generated in the equatorial region may have a greater effect on the horizontal component, H, in Korea than that of the auroral jet current generated the auroral region near to the polar regions.
All the correlation coefficients between D and the activity indices are ?
The Z component showed a relatively strong correlation with the F10.7 index, which indicated that the vertical geomagnetic component was relatively highly correlated with the Rx and F10.7 indices representing the solar activity, than with the ring current or the auroral jet current representing the effect of the geomagnetic field. Hence, it is presumed that Z is affected more by the direct solar activity than the H and D components.
About four years have passed since the magnetometer was established at the Mt. Bohyun Observatory and the data has been accumulated stably. We expect this statistical analysis of the diurnal, seasonal and annual variation of BOH magnetometer data might provide basis of more detailed and expanded analysis in the near future. Responding to such a need, we performed this study for the reliability of BOH magnetometer data and providing the basic statistical information about the data that had been accumulated since it was installed.
The diurnal variation plot in each month showed that all the H, D and Z components had a similar trend: the minimum was about 30 minutes before the meridian (11:28), the maximum about 3 hours and half after the meridian (15:28), the start point of the quiet interval was near to the sunset (19:06), and the end point of the quiet interval was near to the sunrise (06:40). As the sun rises, the quiet interval is ended and the H value begins to decrease gradually. Since the H component was in its quiet interval, having a constant value, after the sunset until the time before the sunrise, it was found that the H value was varied by the effect of the sun. It is well-known that the maximum and the minimum of the diurnal geomagnetic variation were by the effect of the Sq current. When the eddy type's Sq current system firstly confronts the Mt. Bohyun Observatory, the geomagnetic field of the Sq current system is directed downwards and thus the H component of the geomagnetic field experiences decrease. At that time, the H component value reaches the minimum. As the center of the Sq current system passes through the Mt. Bohyun Observatory, the geomagnetic field of the Sq current system is directed upwards and thus the H component of the geomagnetic field is increased. At that time, the diurnal variation of H reaches the maximum.
As for the seasonal variation, H, D and Z all showed a similar trend. The time for the minimum became earlier continuously, the earliest in summer between July and August, and then grew late. The time for the maximum and the end point of the quiet interval showed the same pattern. On the contrary, the start point of the quiet interval continuously became later from winter in January, the latest in summer in July, and then it grew early. This result was predictable to some extent because the start point of the quiet interval is around the sunset time.
Considering the annual geomagnetic variation according to the LT, the noon section, between 9 o’clock in the morning and 3 o’clock in the afternoon, is the time after the sunrise, including the meridian, and a little before the sunset, when the observation location is influenced by the sun the most. On the contrary, the midnight section, between 9 o’clock in the afternoon and 3 o’clock in the morning, is the time after the sunset and a little before the sunrise, when the observation location is influenced by the sun the least. Therefore, the deviation in each section showed that the geomagnetic variation may take place locally by the sun and that there is almost no deviation in the geomagnetic variation in the section when the solar effect is less as at night.
The correlation between the geomagnetic variation and the space environment variation was analyzed more quantitatively in terms of the Pearson correlation coefficient.The strongest correlation was found between the H component and the Dst index (r = 0.947). The activity indices that showed a relatively higher correlation with the H component were AL, AE and AU in order. Hence, it was found that the geomagnetic data we used contained the effect of the ring current and auroral current, caused by the geomagnetic storms and substorms. One thing interesting was that the Z component showed a relatively strong correlation with the F10.7 index, indicating that the vertical geomagnetic component was more affected by the direct solar effect than by the geomagnetic field effect including the ring current or the auroral jet current.