The solar magnetic cycle can be studied in terms of the latitudinal variation of the location of sunspots with time(Antalova & Gnevyshev 1965, 1983, Pelt et al. 2000, Temmer et al. 2002, 2006, Zolotova & Ponyavin 2006, 2007,Donner & Thiel 2007, Chang 2007, 2008, 2009, Ternullo 2007a, 2010a, Solanki et al. 2008, Goel & Choudhuri 2009,Li et al. 2008, 2009a, b, 2010a, b, Zolotova et al. 2009, Li 2010). For instance, Tuominen (1952) noticed the existence of a difference in the meridional motions of spot groups during the odd and the even cycles, and suggested the existence of a 22-year periodicity in the solar meridional flow. Pulkkinen et al. (1999) also studied the long-term variation of sunspot latitudes, and reported a period of about 90 years. Moreover, they demonstrated an idea that the solar North-South asymmetry phenomenon could be explained by the oscillation of a quadrupolar component of a solar-mixed parity mode magnetic field. In this way, the butterfly diagram may be used to study the solar activity, leading even to constraining a solar dynamo model (Waldmeier 1957, 1971, Li et al. 2002, Solanki et al. 2008).
Since sunspots are formed soon after the emergence of an active region and generally die long before the active region itself, they can be considered as tracers of freshly emerged magnetic flux. Thus, under the assumption that the sunspot butterfly diagram reflects the evolution of the magnetic field and the dynamics at the bottom of the solar convection zone, which has been shown as reasonable (Hathaway et al. 2003), the search for such a shortterm periodicity is intriguing, and calls for more careful analyses.
Since sunspots are formed soon after the emergence of an active region and generally die long before the active region itself, they can be considered as tracers of freshly emerged magnetic flux. Thus, under the assumption that the sunspot butterfly diagram reflects the evolution of the magnetic field and the dynamics at the bottom of the solar convection zone, which has been shown as reasonable(Hathaway et al. 2003), the search for such a shortterm periodicity is intriguing, and calls for more careful analyses.
Recently, there have been some efforts to search for short-term periodicities in the latitudinal distribution of sunspots (Krivova & Solanki 2002, Knaack et al. 2005) in addition to long-term periodicities, such as ~11-year (Schwabe 1843), ~44-year (Javaraiah 2003), ~53-year (Le & Wang 2003), ~78-year (Wolf 1862), ~80-90-year (Gleissberg 1971), and ~65-130 year quasi-periodic cycles (Nagovitsyn 1997). Interestingly, these short-term periodicities have been related to the structure and dynamics of the solar interior, such as oscillations at ~1.3 years observed in the rotation rate at the base of the convection zone (Howe et al. 2000), or a torsional wave pattern with alternating latitude zones of slow and fast rotation (Howard & LaBonte 1980). For instance, Krivova & Solanki (2002) attempt to demonstrate that the periodicity of the tachocline rotation rate oscillations can actually be traced in the sunspot activity.
In this paper, we take the area of sunspots into account in the latitudinal solar-cyclic behavior of sunspots (Cho & Chang 2011). This consideration is required, as it reduces the noise level of a power spectrum in the sense that small sunspots prevail in the butterfly diagram, which scatter over wider latitude ranges than larger ones. The butterfly diagram is quite noisy because all sunspots are given equal weight in the butterfly diagram, regardless of their temporal and spatial extension. For example, 65% of groups (the smallest ones) contribute to only ?10% of the total spotted area, as was pointed out by Ternullo (2007b). Hence, periodical tests are apt to be biased by randomly scattered small sunspots unless the area of sunspots is properly managed. So far, this simple fact that the butterfly diagram appears to be noisy due to small sunspots has been ignored. For instance, Ternullo (2010a) has claimed that there is a fine structure in the butterfly diagram that evolves over time, and that the averaged latitude of sunspots apparently drifts alternatingly equatorward and poleward for short time intervals, i.e. ~2 years. He came to this conclusion through a visual inspection, without any periodogram analysis. More seriously,he averaged the latitudes of sunspots with a moving window, whose width is a decisive factor to the result, without taking care of the area of sunspots. We review the recently reported short-term periodicities in the butterfly diagram by replotting it by weighting the sunspot with its area (Krivova & Solanki 2002, Ternullo 2007a, 2010a,b). By doing so, we may or may not confirm the short-term periodicities recently reported.
This paper begins with descriptions of how the center-of-latitude (COL) is defined, and of the wavelet analysis in Section 2. We present and discuss the results obtained with the technique of wavelet transform in Section 3. Finally, we summarize and conclude in Section 4.
2. CENTER-OF-LATITUDE OF SUNSPOT AND WAVELET ANALYSIS
The data used for analysis were the daily sunspot area and its latitude obtained from the National Aeronautics and Space Administration (NASA) website1. The data set we analyze in the current analysis spans from 1874 to 2009. Here, we consider the distribution of the COL. We collectively compute COL for sunspots appearing in both hemispheres by taking the absolute value of the latitude, which is given by
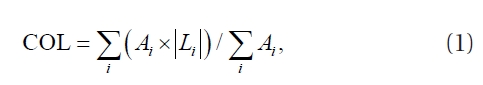
where
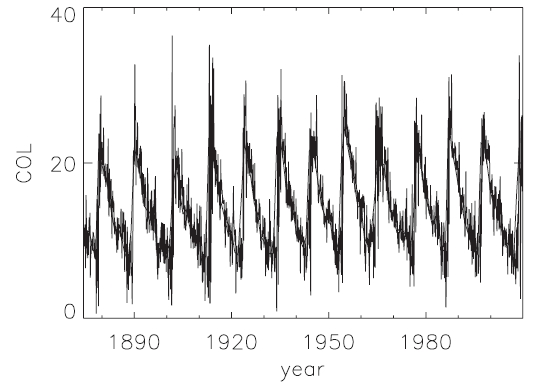
In Fig. 1, we show the averaged COL as a function of time. The yearly averaged COL is also shown with a thick curve for comparison. Note, however, that the thick curve is given simply for clarity, and the thin curve alone is used in the analysis. The solar cycle begins when COL is high, and COL gradually decreases in general as the solar cycle proceeds. We note, however, that small humps (or short plateaus) appear around almost all solar maxima. That
is, COL is not monotonically decreasing. A similar conclusion was drawn by Antalova & Gnevyshev (1983), who stated that the 11-year cycle consists of the superposition of two maxima which peak at different times and different latitudes, and that the second peak occurs at a lower latitude than the first. Recently, Ternullo (2010b) has also shown that the sunspot has the tendency to preferentially appear in some photospheric regions tightly limited in latitude,givinga 'leopard skin' appearance to the butterfly diagram. This is in contrast to the traditional view that the average latitude of sunspots in the butterfly diagram steadily drifts equatorward. One may be interested in further pursuing this non-monotonic behavior to relate the latitudinal preference to postulating 'active latitude' suggested by Solanki et al. (2008).
In the present analysis, we employ the wavelet analysis technique associated with the Gabor transform. This method is sometimes referred to as time/frequency analysis. Compared to the Fourier transform
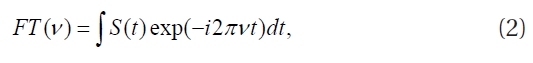
the Gabor transform
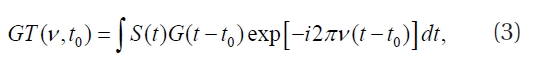
where
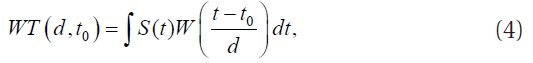
where
Several wavelet-forms can be selected, but in practice the most popular choice is the Morlet wavelet (Grossmann & Morlet 1984). It is a sinusoidal wave with a Gaussian window:
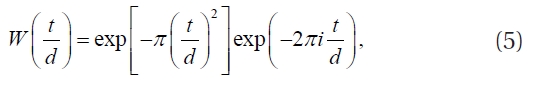
where
1http://solarscience.msfc.nasa.gov/greenwch.shtml
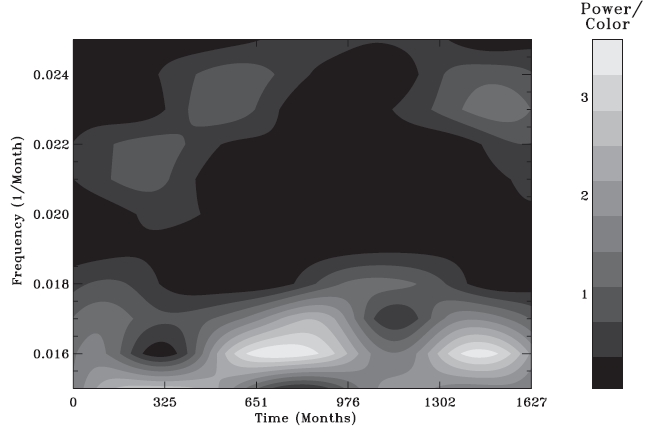
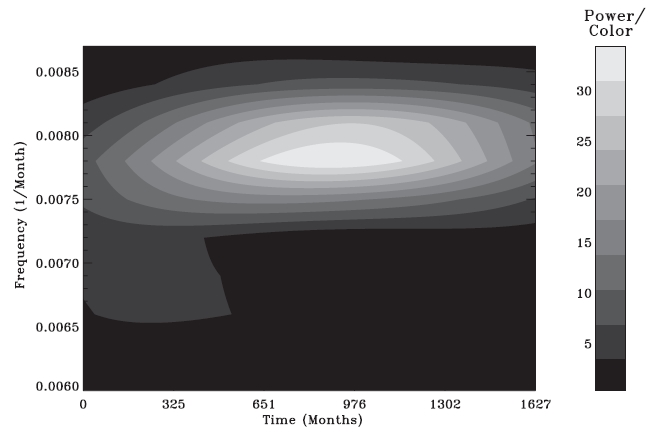
In Fig. 2, as an example, we show a 2-dimensional power spectrum obtained by the wavelet analysis to demonstrate its robustness. As mentioned in Section 2, the power spectrum is shown in a 2-dimensional plot as a function of time in month and frequency in 1/month. The data set covers 1628 months, from May in 1874 to December in 2009. The power is normalized with noise, and shown in an arbitrary unit. Not surprisingly, the main peak in the whole power spectrum occurs where the frequency is ~0.00781/month, whose period corresponds to ~10.68 years. In Fig. 3, we show a part of the power spectrum where the second most conspicuous peak in the whole power spectrum can be found. The power is consistently concentrated at frequency ~0.016 1/month, which corresponds to ~5.21 years. Even though the peak can be understood in terms of a subharmonic of the main peak, we consider this periodicity to be due to the humps between the minima we have seen in Fig. 1. It can be considered as evidence that there are two populations of sunspots,as will be shown in a subsequent paper.
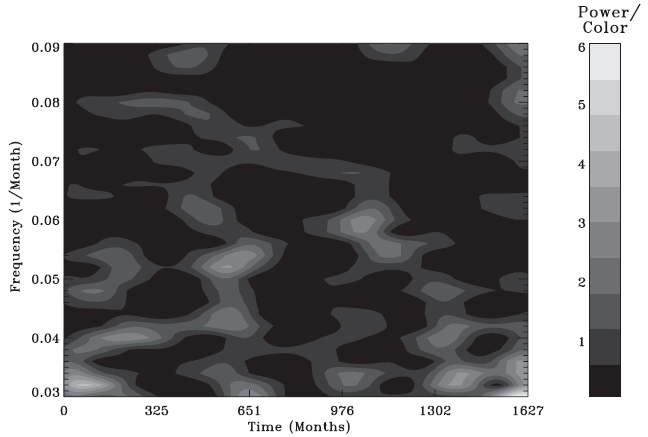
As stated above, we are only interested in short-term periodicities, and focus on these in the present analysis.In Fig. 4, we show the power spectrum obtained by
the wavelet analysis in frequency ranges from 0.03 to 0.09 1/month to check whether the tendency of sunspots
to appear in limited latitudes indeed has biennial periodicities,which has been suggested as evidence of links between the changing structure of the sunspot zone and the tachocline rotation rate oscillations. This frequency range corresponds to one from 11 (0.91 years) to 33 months (2.75 years) in period. As shown in Fig. 4, however,the power appears as randomly distributed in almost the entire region of the power spectrum. In other words, we cannot find any periodicities of ~1.3 (0.064), ~1.5 (0.056), or ~1.8 (0.046) years (1/month), as claimed previously(Krivova&Solanki 2002, Knaack et al. 2005, Ternullo 2010a). We, therefore, have to conclude that the oscillating component of ~2 year periodicity is insignificant and inconsistent. According to what we see in Figs. 3 and 4, the only reasonable short-term periodicity one can find in the latitudinal variation of sunspot positions is apparently~5.21 years, but not ~2 years. Previously reported periodicities of ~2 years seem to be biased results due to small sunspots.
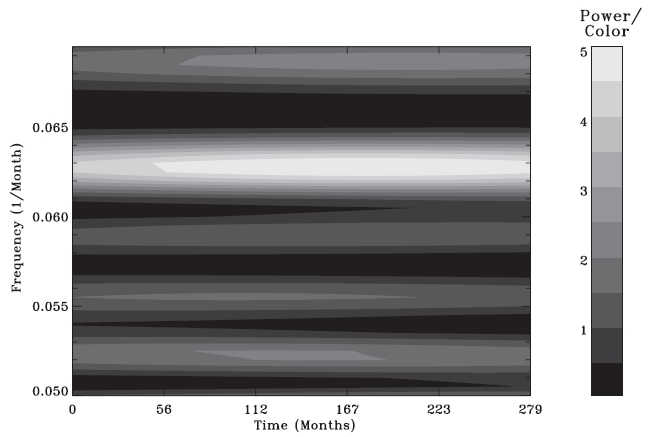
As a matter of fact, the 1.3 year periodicity detected by Howe et al. (2000) in the rotation rate at the base of the convection zone is still an open issue, in that Antia & Basu (2000) and Basu & Antia (2001), with a slightly different analysis of the same MDI and GONG data, reported no significant variations. Basu & Antia (2001) saw only an insignificant signal. Moreover, the periodic signal disappears in the post-2001 data, even in Howe et al. (2007). In the later analysis by the original authors, the ~1 year periodicity was considered as variable. That is, even according to the original authors, the signal of ~1.3 year periodicity can be seen in the data set from 1995 to 2000 only, but cannot be seen in the data set from 2001 up to the near present. Even though we do not see any significant peaks around a frequency corresponding to ~1.3 years in the power spectrum in Fig. 4, we decide to zoom-in the power spectrum for the duration from September 1986 to December 2009 (solar cycles 22 and 23), whose duration overlaps the data period analyzed by Howe et al. (2000, 2007). If and only if we do see some similar temporal behaviors in the power distribution at frequency of ~0.064 1/month, which corresponds to the 16 month (~1.3 years) period, we can still struggle to clean the power spectrum around that frequency to obtain a signal. As shown in Fig. 5, unfortunately, we indeed find a consistent peak at frequency~0.063 1/month from ~1990 to 2009, which is one of the other peaks of noise. In other words, there is no behavior seen as expected (i.e., only strong peaks from ~1995 to ~2000 and no peaks otherwise). Hence, even if what Howe et al. (2000, 2007) have found is a real feature, and even if the component at frequency ~0.063 is significant, we do not see any evidence whatsoever supporting its association in the latitudinal variation of the position of sunspots in view of COL.
The variation of area-weighted latitude of sunspots appearing during the period from 1874 to 2009 has been studied. We focus our investigation on short-term periodicities. We first determine the COL by averaging the latitude with the weight function in area. Then, we analyzed the time series of COL using the wavelet transform technique. We find that a periodicity of ~5 years is the second most dominant feature in the time series of COL. The power is consistently concentrated at frequency~0.0161/month. We consider this periodicity to be due to humps between the minima. We show the power spectrum in frequency ranges from 0.03 to 0.09 1/month to check whether the sunspot tendency to appear in limited latitudes indeed has biennial periodicities, which have been suggested as evidence of links between the changing structure of the sunspot zone and the tachocline rotation rate oscillations. As shown, however, we cannot find any periodicities of ~1.3 (0.064), ~1.5 (0.056), or ~1.8 (0.046) years (1month), as claimed previously. We therefore have to conclude that the oscillating component of ~2 year periodicity is insignificant and inconsistent. Previously reported periodicities of ~2 years seem to be biased results due to small sunspots. Hence, even if what Howe et al. (2000, 2007) have found is a real feature, and even if the component at frequency ~0.063 is significant, we do not see any evidence whatsoever supporting its association in the latitudinal variation of the position of sunspots in view of COL.