The Sgr B2 region in our Galactic center contains giant molecular clouds, which represent extreme cases of high luminosity star formation. The gas in the Sgr B2 region is mainly concentrated in a dense central component, “the Principal Cloud,” ~ 5?10 pc in diameter with a relatively high mean density, n(H2) ? 1 × 105 cm?3 (Irvine et al. 1987,Minh et al. 1998). Along the north-south direction there exist three prominent star-forming cores ‘inside’ the Principal Cloud, Sgr B2 (N), (M), and (S) which include clusters of compact HII regions having newly born massive stars. The density and temperature structures of this region are extremely complicated (Martin-Pintado et al.1999, Rodriguez-Fernandez et al. 2002, and references therein). The massive star formations in the core of the Principal Cloud has been suggested to be triggered by cloud collisions (Hasegawa et al. 1994, Mehringer et al.1995, Oka et al. 1998, Sato et al. 2000) although there exist many difficulties in identifying different gas components by using the optically thick lines. The latest star formation may be occurring at the 2 arcmin north (2’N) position from Sgr B2 (M), where the isocyanic acid (HNCO) emission peaks probably resulting from the collision between the Principal Cloud and the 2’N cloud (Minh et al. 1998, Minh & Irvine 2006). We observed one of the methanol transitions in the 200 GHz band toward the Sgr B2 molecular cloud using the Swedish-European Southern Observatory (ESO) submillimeter telescope (SEST) in Chile, and discuss the morphology of its emission in this region.
Methanol is a slightly asymmetric rotor with hindered internal rotation and significant a- and b-axis dipole moments (μa = 0.885 D, μb = 1.44 D), and has a complex spectrum that is sensitive to interstellar conditions. The modeling of methanol excitation has been known to be extremely difficult. Even when the lines are not masing,they may be expected to be distinctly non-LTE excitation,except under the highest density conditions, where collisions could thermalize the level populations (Leurini et al. 2004, 2007). Methanol (CH3OH) is thought to form mainly on the grain surface in dense cores by the hydrogenation of CO, and observed to be one of the major solid components in dust ice mantles (Dartois et al. 1999, Gibb 2000). Methanol is the predominant O-bearing species in the gas phase after evaporation from dust grains, and the key species which initiates the early phase oxygen chemistry in hot cores (Rodgers & Charnley 2003). In addition to the fact that methanol masers are often found abundant very close to young stellar objects, its thermal emission is thought to unambiguously trace hot cores and/or outflows associated with massive star formation (Minh et al. 1993, Minier et al. 2000).
Various methanol lines have been detected toward the Sgr B2 molecular cloud, especially, toward the (M) and (N) positions of the Principal Cloud (Cummins et al. 1986, Mehringer & Menten 1997, Nummeline et al. 2000). In this
Observations were carried out using the 15 m SEST1 (Booth et al. 1989) on La Silla, Chile, in April 2000. The methanol (CH3OH) 42-51E transition at 216.95 GHz was observed using a dual channel SIS receiver during the survey of various molecular lines toward our Galactic center region (Minh et al. 2005, Minh & Irvine 2006). Two 1,500 channel acousto-optic spectrometers with channel spacing of 0.69 MHz were used but the frequency resolution of the system was approximately 1.2 MHz. The half-power beamwidth (HPBW) and main beam efficiency are 22” and 0.60, respectively, at 220 GHz. Spectra were taken with the position switching mode using the reference position (l, b) = (0.0º, 2.5º), and the map was made with a grid of 2 arcmin. The antenna temperatures TA* quoted in this paper have been corrected for antenna and atmospheric losses by means of the standard chopper wheel method, but not for possible beam dilution. The typical system temperatures were about 220?240 K (SSB) and typical rms (1 σ) of the spectra are ~120 mK.
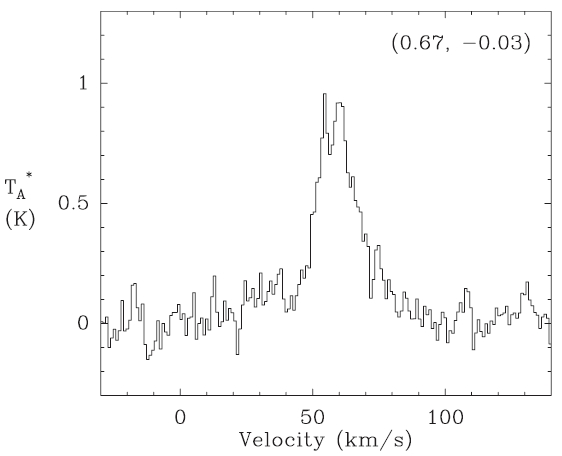
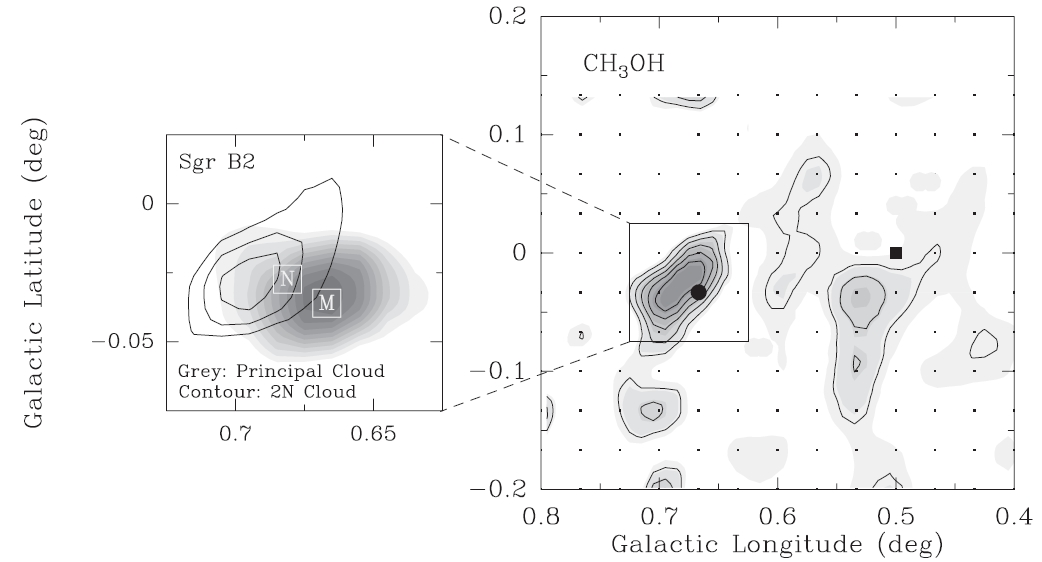
Fig. 1 shows a spectrum observed toward the Sgr B2 (M) position. The line intensity appears to be strongly enhanced at this (M) position, relative to other observed points in this region, which is probably associated with massive star formation. This methanol line seems to have a broad wing component (Δv ≥ 30 km s?1), but higher spatial resolution observations are necessary for further studies. The velocity integrated intensity map of the observed methanol line is shown in Fig. 2. The location of Sgr B1 is indicated with a filled square in the figure, which is an HII region complex (LaRosa et al. 2000). Sgr B1 is a part of the Ridge connecting the Galactic center radio Arc and the Sgr B2 cloud (Lis et al. 2001), which shows very weak molecular line emissions in our observations. In this paper we focus on the gas cloud associated with Sgr B2 (M) and its surroundings.
As shown in Fig. 2 the velocity integrated intensity of the 42-51 line of methanol shows highly enhanced toward the (M) position, compared to other observed points in this region. The high enhancement of this methanol emission line, which appears to be unresolved in this ~22” beam, is thought to result from interactions between the hot cores and outflows from massive stars forming as a cluster in this region. The morphology of this extended emission shows a very close correlation with the 2’N cloud shown in Fig. 2 (Minh & Irvine 2006). The 2’N cloud, as a part of a large-scale “Ring” component (radius ~5 pc), may be experiencing the very first phase of collapse by colliding with the Principal Cloud, which could have resulted in the high activities of star formation in the Principal Cloud (Minh et al. 1998, Minh & Irvine 2006). Although the gas component in the Sgr B2 region is concentrated mainly in the Principal Cloud, we found no extra/extended emission toward the other part of the Principal Cloud at the observed sensitivity. It means that the dense
gas in the Principal Cloud is relatively quiet except the star-forming cores in this cloud (Irvine et al. 1987). On the other hand the relatively weak but extended emission of methanol toward the 2’N cloud may suggest that this cloud is under shocks, which makes the solid methanol in the grain mantles evaporate into the gas phase.
We estimate the total column density of methanol, by assuming optically thin emission and an LTE condition (Irvine et al. 1987), N(CH3OH) = 1.2 ±0.1 × 1015 cm?2 toward (M), and 2.9 ±0.3 × 1014 cm?2 toward the peak position of the extended emission. The errors come from the range of rotational temperature applied, 10?20 K, and the observed spectral noise (1 σ) gives about ≤ 5% and ~30% further uncertainty, for the values obtained toward (M) and the peak of the extended emission, respectively. Galactic methanol abundances are known to be about 10?9 relative to H2 for quiet dense clouds, but in smaller scales, methanol can be enhanced by factors of a few hundred over dark cloud values in shocks and outflows (Meier & Turner 2005). The total H2 column density, N(H2), is highly uncertain, but we assume that N(H2) ? 1 × 1024 cm?2 toward (M) and one-fourth of that toward the 2’N position (Irvine et al. 1987, Minh et al. 1998). Then we derive the “beam-averaged” fractional abundance of methanol, relative to the total H2 abundance, to be about 10?9 for both Sgr B2 (M) and the peak of the extended emission. However, since the emission toward Sgr B2 (M) is unresolved
in our beam, the fractional abundance of methanol will be much higher at the actual methanol core. And the estimated total H2 column density toward the 2’N position includes the contribution from the Principal Cloud, which is probably significant. For better estimation of the methanol abundances, we need higher spatial resolution observations and multi-transition methanol observations, in addition to a better derivation of the total H2 column density for separate cloud components in the Sgr B2 region.
1SEST is operated by Onsala Space Observatory, the Swedish National Facility for Radio Astronomy, with financial support from the Swedish Natural Science Research Council (NFR) and ESO.
We have observed the CH3OH 42-51 transition toward the Sgr B2 region, including the Principal Cloud and its surroundings. This methanol emission shows a strong enhancement toward Sgr B2 (M), where massive stars are forming as a cluster. The low intensity emission shows to be extended mainly along the 2’N cloud, which was suggested to be colliding with the Principal Cloud (Minh et al. 1998, Minh & Irvine 2006). The methanol emission distribution confirms that the 2’N cloud is under shocks, assuming that shock makes the solid methanol in the grain mantles evaporate into gas phase. We derive total methanol column density N(CH3OH) = 2.9 ±0.3 × 1014 cm?2 toward the peak position of the extended emission.