The Cosmic Infrared Background ExpeRiment (CIBER)is a rocket-borne experiment that aims to search for signatures from first-light galaxies in the near-infrared (NIR)extragalactic background (Bock et al. 2006, Tsumura et al.2010). The first (February 25, 2009) and the second (July 10, 2010) launches of the CIBER at the White Sands Missile Range in New Mexico were successful, and will be followed by two more launches. There are four instruments in the CIBER: I (0.9 ㎛) and H (1.6 ㎛) band imagers, low resolution spectrometer (LRS, 0.7-2.1 ㎛, see Tsumura et al. 2010), and narrow band spectrometer (NBS).
Of those four instruments, the LRS and the NBS use the PICNIC HgCdTe 256 × 256 arrays from Teledyne (P574 for LRS and P560 for NBS). The PICNIC HgCdTe arrays have been used widely in the field of astronomy due to their good performance in the near infrared region (Graham& Treffers 2001, Deep et al. 2002, Pedretti et al. 2004,Moon et al. 2010). Dark current is the ambient voltage of a system, which is the noise evident in a fraction of a second integration even though the shutter is closed. In the CIBER, low dark current is essential for backgroundlimited performance, because the purpose of CIBER is to detect small infrared excess background light (Bock et al. 2006). In this paper, we have measured the dark current of the PICNICs from the data taken during the first launch. First, we identified the bad pixels of the arrays to mask them off for the analysis. Next, we obtained the dark noise and the dark current. Finally, we discussed glitches in the pixels and readout modes for a future mission.
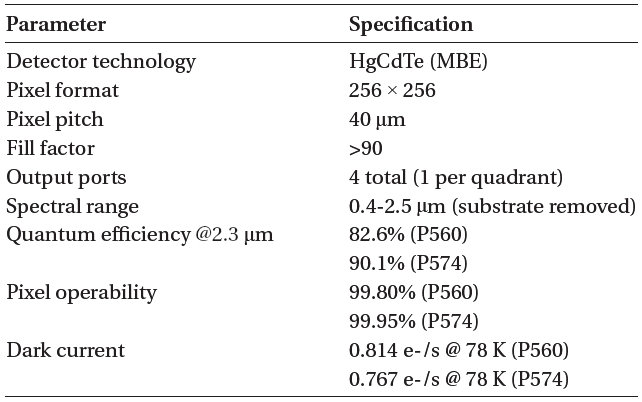
The specifications of the PICNIC arrays used in the CIBER are described in Table 1. Our PICNIC HgCdTe detectors were manufactured through the molecular beam epitaxy (MBE) process: the HgCdTe diode array consists of a double-layer planar heterostructure (DLPH) grown on a CdZnTe substrate (Cabelli et al. 2000) and substrate removed for good performance on shorter wavelength region. For λc = 5 ㎛, the detector dark current of MBE
[Table 1.] Manufacturer’s specification of the PICNIC arrays used in the CIBER.

Manufacturer’s specification of the PICNIC arrays used in the CIBER.
HgCdTe relative to liquid phase epitaxy (LPE) HgCdTe is reduced by more than 4 orders of magnitude at an operating temperature of 80 K (Finger & Beletic 2002).
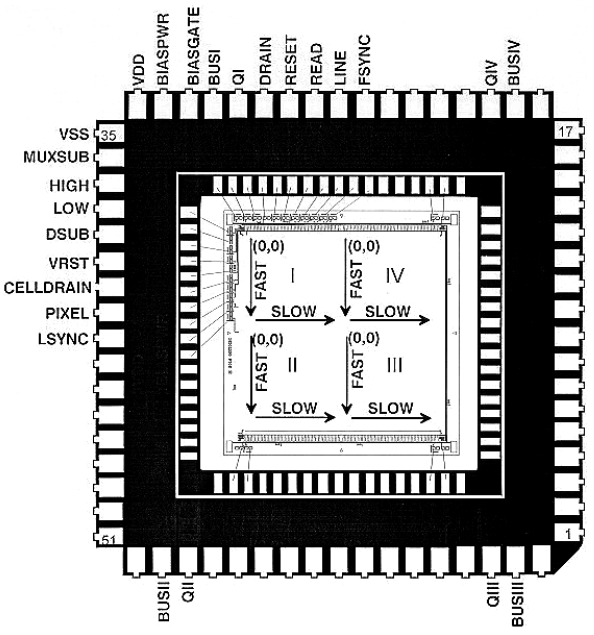
The PICNIC array consists of four quadrants. The schematic diagram of the PICNIC array is shown in Fig. 1. Each quadrant of a PICNIC contains two digital shift registers for addressing pixels in the array, which are a horizontal register and a vertical register. Each register requires two clocks, with one being a dual-edge triggered clock and one a level triggered clock: Pixel and Lsync for the horizontal register, Line and Fsync for the vertical register. The vertical register selects the row to read and/or reset depending on the Reset and Read clock inputs.
We used three voltage adjustments for the operation: Vreset, Dsub, and Biasgate. Vreset is the reset voltage that is applied to the detectors during the reset operation, which is set to 0 V. Dsub is the detector substrate voltage, which is set to 0.5 V. Biasgate is used to adjust the speed and dynamic range of the unit cell Source Follower. We set Biasgate voltage as 3.3 V for all quadrants.
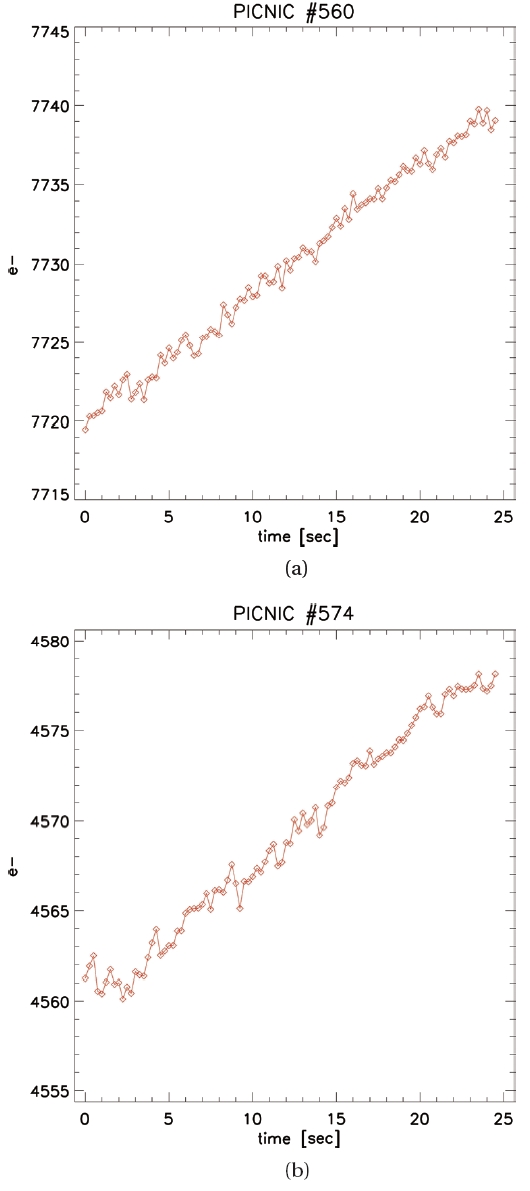
For the best performance of the array, liquid nitrogen is used to cool down all instruments of CIBER. Then, the focal plane assembly (FPA) temperature is micro-controlled within 10 mK via heaters in the FPA. The cold shutter is located just in front of the array for measuring the dark images. The operation temperature of the FPA (including the array and the cold shutter) is set to 80 K. Just before the launch of CIBER, when the cold shutter is closed, the dark data were measured. Fig. 2 shows the raw dark data.
With 10 Mbps clocks for reading each pixel, it takes 0.25 sec to read two PICNIC arrays in series. We took 100 frames (25 sec) to measure the dark data. The ancillary data attached at the header of a frame include the status bits (calibration lamp, shutter open/close, shutter door, on target, etc.), the FPA temperature, a frame counter, and an internal time. The frame counter resets to zero when the array resets.
Bad pixels are defined as those pixels showing a temporal evolution of the signal different from the rest of the pixels of a given array (Lopez-Alonso & Alda 2002). The number of bad pixels is a quality figure that defines a given detector array. Lopez-Alonso & Alda (2002) defined three types of bad pixels: 1) dead pixels, which are those that always produce the same signal, 2) noisy pixels, which are those with noise greater than a fixed threshold, and 3) blinking or drifting pixels, which are those showing temporal behavior clearly different than those considered as good pixels.
We have used the method introduced by Hilbert, Baggett, & Robberto (2003, hereafter HBR03), which is similar to the traditional method of sigma-clipping used to identify outlying pixels, to remove those three types of bad pixels. The mask is created from a pair of dark current ramps (ramp A and ramp B), each composed of 100 nondestructive reads. First, we sum the first read of each ramp and derive the mean and standard deviation of the
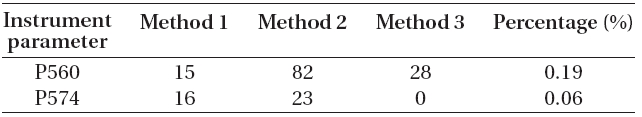
[Table 2.] Number of bad pixels.

Number of bad pixels.
resulting image.

All pixels in the summed image falling outside of a specified threshold from the mean (typically 5σ) are then flagged as bad. This step identifies pixels on the detector that are shorted or unbonded (i.e. a “cold mask”). Secondly, we sum the last read of each ramp, and subtract that image from the first image.

The mean of the final image is calculated, and the bad pixels are identified in a same way. This step is designed to isolate pixels that have high dark current (i.e. a “hot mask”). The final partial mask is created from a final image that is obtained in the following way:

This last step is used to identify pixels that, over the course of the two ramps being investigated, exhibit odd behavior, such as from cosmic ray hits (HBR03).
In Table 2, we show the bad pixels for P574 and P560, obtained using the above methods. The total numbers of bad pixels of both PICNICs, 39 pixels for P574 and 125 pixels for P560, are well matched with the data specified by Teledyne.
3.2 Dark Noise and Dark Current
Dark noise arises from statistical variation in the number of electrons thermally generated within the array, which is independent of any photon-induced signal, but highly dependent on device temperature. The generation rate of thermal electrons at a given array temperature is referred to as dark current. Similarly to photon noise, dark noise follows a Poisson relationship to dark current, and is equivalent to the square-root of the number of thermal electrons generated within the image exposure time.
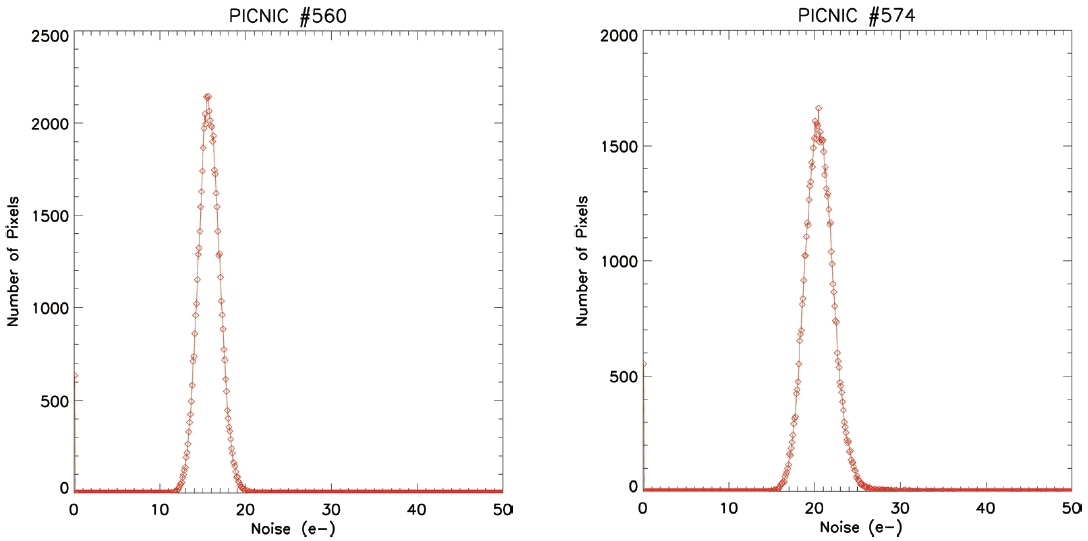
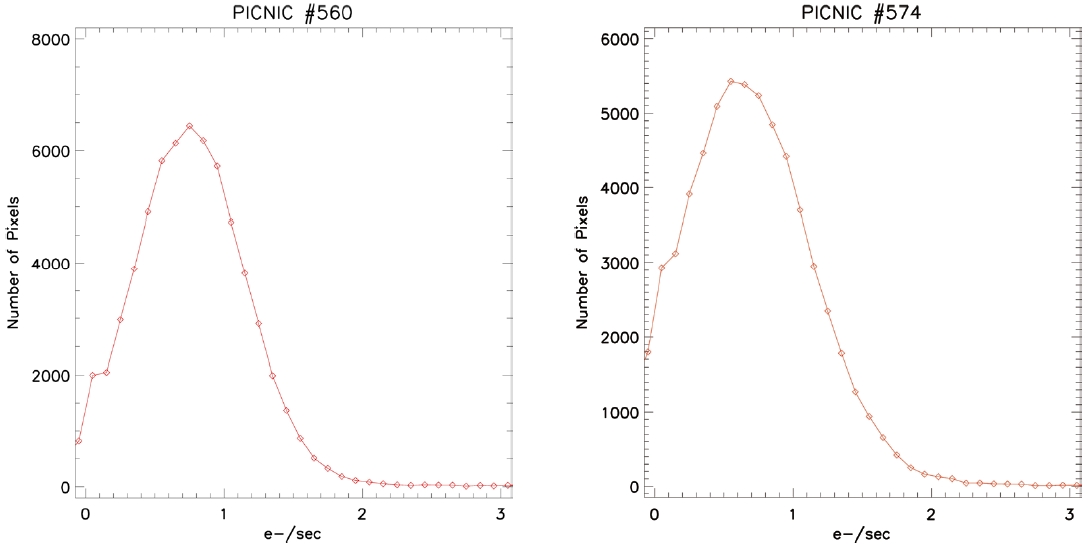
With the bad pixel masked, we calculated the slope of the output signal of a pixel (in electrons) vs. time using
the least squares method. Then, we took the median value of the dark current of all pixels to get the array’s dark current (Fig. 3). The dark noise, the standard deviation from the slope to the output signal of a pixel, is obtained in a similar way (Fig. 4).
As the four quadrants of each PICNIC have slightly different characteristics, we calculated the dark current and the dark noise for each quadrant, and averaged it for the
[Table 3.] Dark noise and dark current results.
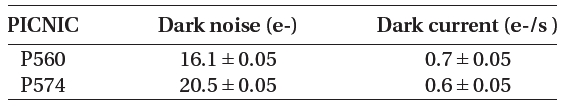
Dark noise and dark current results.
whole array. Table 3 shows the dark noise and the dark current of each array. P574 has dark noise of 20.5 ± 0.05 e- and dark current of 0.6 ± 0.05 e-/s, while P560 has dark noise of 16.1 ± 0.05 e- and dark current of 0.7 ± 0.05 e-/s. The resulting dark currents are almost the same as the measurements of the manufacturer shown in Table 1, indicating that our experiment is configured for the best performance of the arrays.
The multi-purpose IR imaging system space observation camera, hereafter SOC (MIRIS SOC) is the main pay-
load of the third Korean scientific small satellite STSAT-3, which will be launched in late 2011 (Han et al. 2010). We use the same substrate removed PICNIC arrays in the SOC as were used in the CIBER, although there are two things to consider for the MIRIS SOC operation: glitches and readout modes.
A glitch appears as a sudden jump between two consecutive reads, followed by a return to the initial rate. We identified glitches through an iterative algorithm, which was suggested by (HBR03). First, the rate of signal generation for a given pixel is found using all the reads of the ramp. Then, all points falling more than a given distance from the mean signal rate are identified. We have found that there were 623 pixels with glitches over 100 frames, which means that 0.01% of pixels were exposed to a glitch per frame, during our experiment. We have also analyzed the impact of the glitches on the dark noise: the resultant dark noise after de-glitching is improved by about 0.1%, which is negligible considering the error range. Note that our experiments for the CIBER dark measurement were taken in around 50 seconds on the ground. However, in the situation of space orbital missions, such as the MIRIS SOC, glitches may be important due to the heavy cosmic rays.
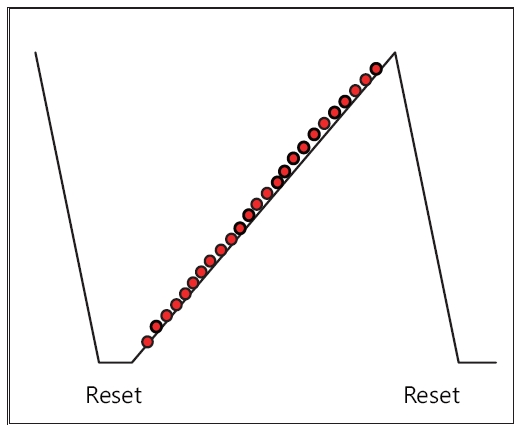
The multi-accum mode was used for CIBER data acquisition. In this mode, the array is read out non-destructively at intervals over the exposure (Fig. 5). These
intermediate reads are then down-linked. The advantage of this mode is that cosmic rays can be rejected on the ground, and data before and after a cosmic ray hit is still useable. This allows for longer effective exposure times and a large increase in the signal to noise ratio.
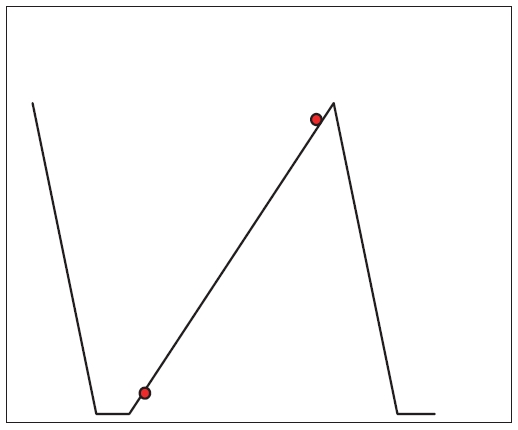
For the MIRIS SOC, due to the limited downlink data size, we will use the correlated double sampling (CDS) readout mode (Fig. 6), which is a technique whereby each pixel is reset, and then sampled at the beginning and end of integration. The CDS is most useful for background limited imaging.
In the next study, we will compare the dark data of the SOC PICNIC array with those of the CIBER instruments to investigate the effect of different readout modes.