Stars with low and intermediate mass evolve into the asymptotic giant branch (AGB) before the evolutionary stage of planetary nebulae. The OH/IR stars are generally believed to be the last evolutionary phase of an oxygenrich AGB star emitting OH maser at 1,612 MHz. OH/IR stars are characterized by the Mira-type long-period variable stars (LPVs) with large amplitude (>2.5 mag at optical).Shock waves produced by the strong pulsation and radiation pressure on the newly formed dust grains drive dusty stellar winds of high mass-loss rates (10-8-10-4 M⊙/yr). The enhanced mass loss by stellar pulsation involves the opaque circumstellar envelope.
The Infrared Space Observatory
Suh & Kwon (2009, hereafter paper I) and Kwon & Suh(2010, hereafter paper II) investigated the
For this paper, we choose 12 OH/IR stars which have a wide range of pulsation periods (400-1,800 days). The sample stars are same as those used in paper II. We present the OH name of sample stars, the general catalogue of variable stars (GCVS) name, the galactic position and the distance in Table 1. The galactic positions of stars are based on the SIMBAD database. The distances of OH 45.5+0.1 and 32.8-0.3 refer to Nyman et al. (1993), the distances of the others are from Lepine et al. (1995).
The detailed spectral observations by
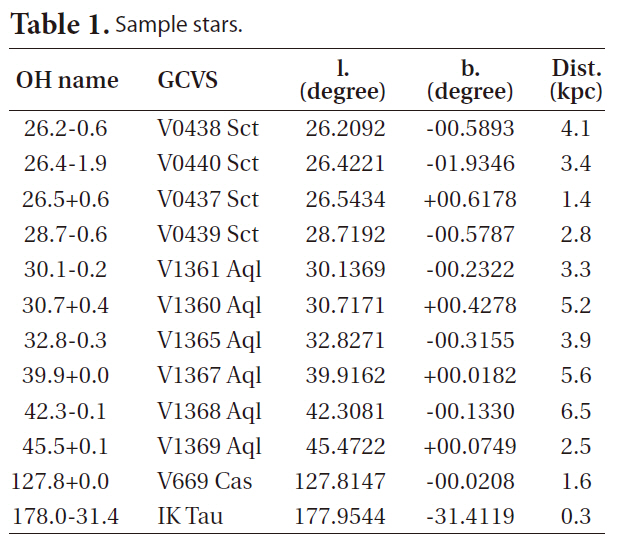
Sample stars.
[Table 2.] The M band observations for the sample OH/IR stars.
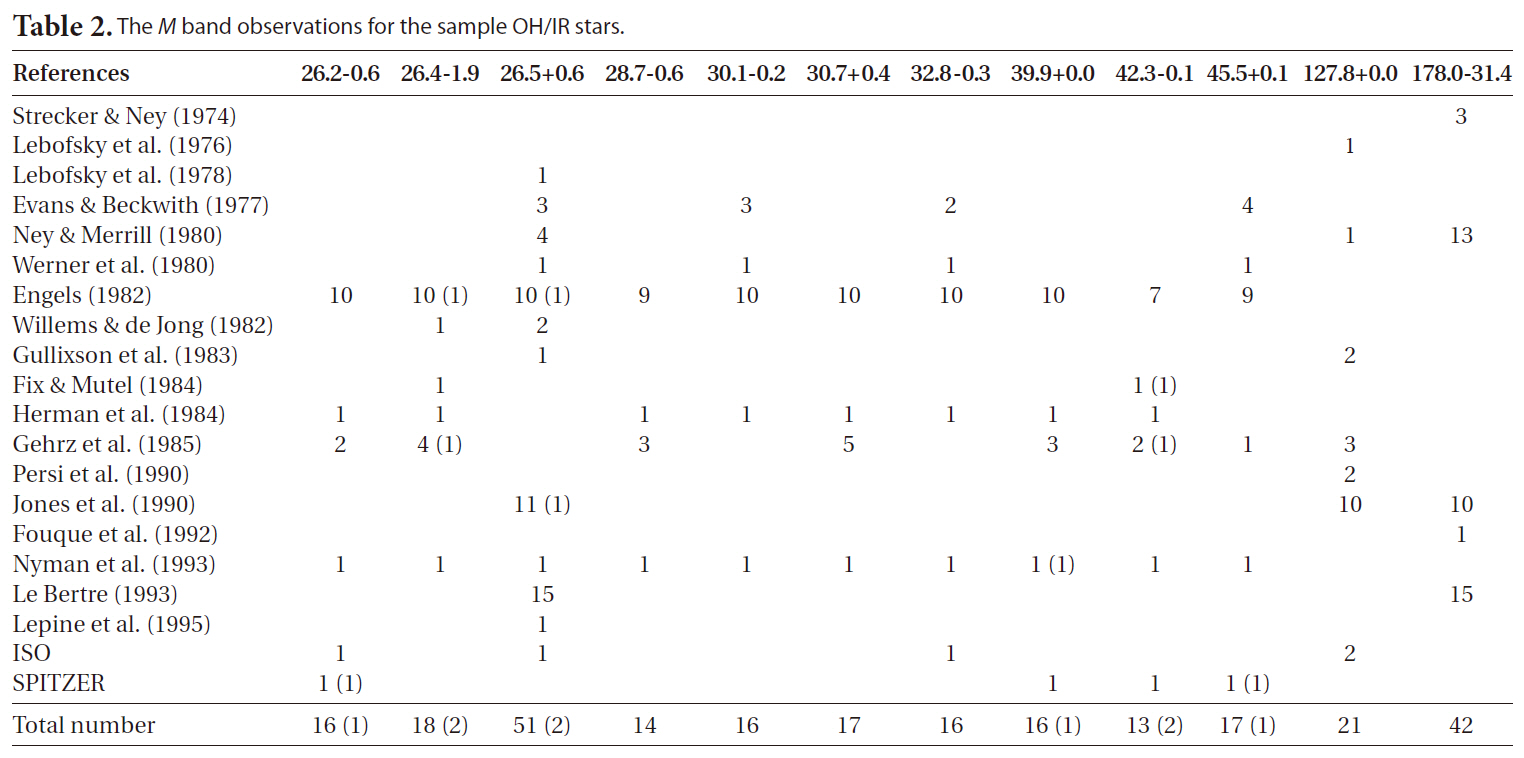
The M band observations for the sample OH/IR stars.
served medium and high spectral resolution in the wide wavelength region of 2.38-45.2 ㎛ (de Graauw et al. 1996). ISOPHOT (PHT; Lemke et al. 1996) has four principal modes of detector element aperture photometry (3-120 ㎛), array imaging (40-240 ㎛), polarimetry (25-170 ㎛) and spectrophotometry (2.5-12 ㎛). In this work, we use spectral observation data of SWS and PHT for flux density of
The Galactic Legacy Infrared Mid-Plane Survey Extraordinaire (GLIMPSE, Benjamin et al. 2003), one of the
All the sample stars except IK Tau and OH 127.8+0.0 were observed by GLIMPSE survey, but all the data of observed stars are contaminated by electronic artifacts such as saturation, muxbleed, and column pull-down. The sensitivity of IRAC is too high to observe the bright OH/IR stars. According to GLIMPSE3D v1.0 data release document, the saturation limit for GLIMPSE is 6.5 mag at 4.5 ㎛ band.
The photometry for some softly saturated stars can be extracted using the wings surrounding a saturated source (see paper II). We use the corrected flux density of the some softly saturated stars from the GLIMPSE source catalogs. The
Table 2 lists the number of observational data used for this paper. The numbers marked by parenthesis in Table 2 mean unused observation data for the analysis to determine the pulsation parameters (see Section 3). Compared with previous investigations, we use much larger database of recent observations including ISO and
To obtain the standard flux in W/m2 for all the data, we use the zero-magnitude calibrating methods. The zero-magnitude calibrating data are taken from the related references.
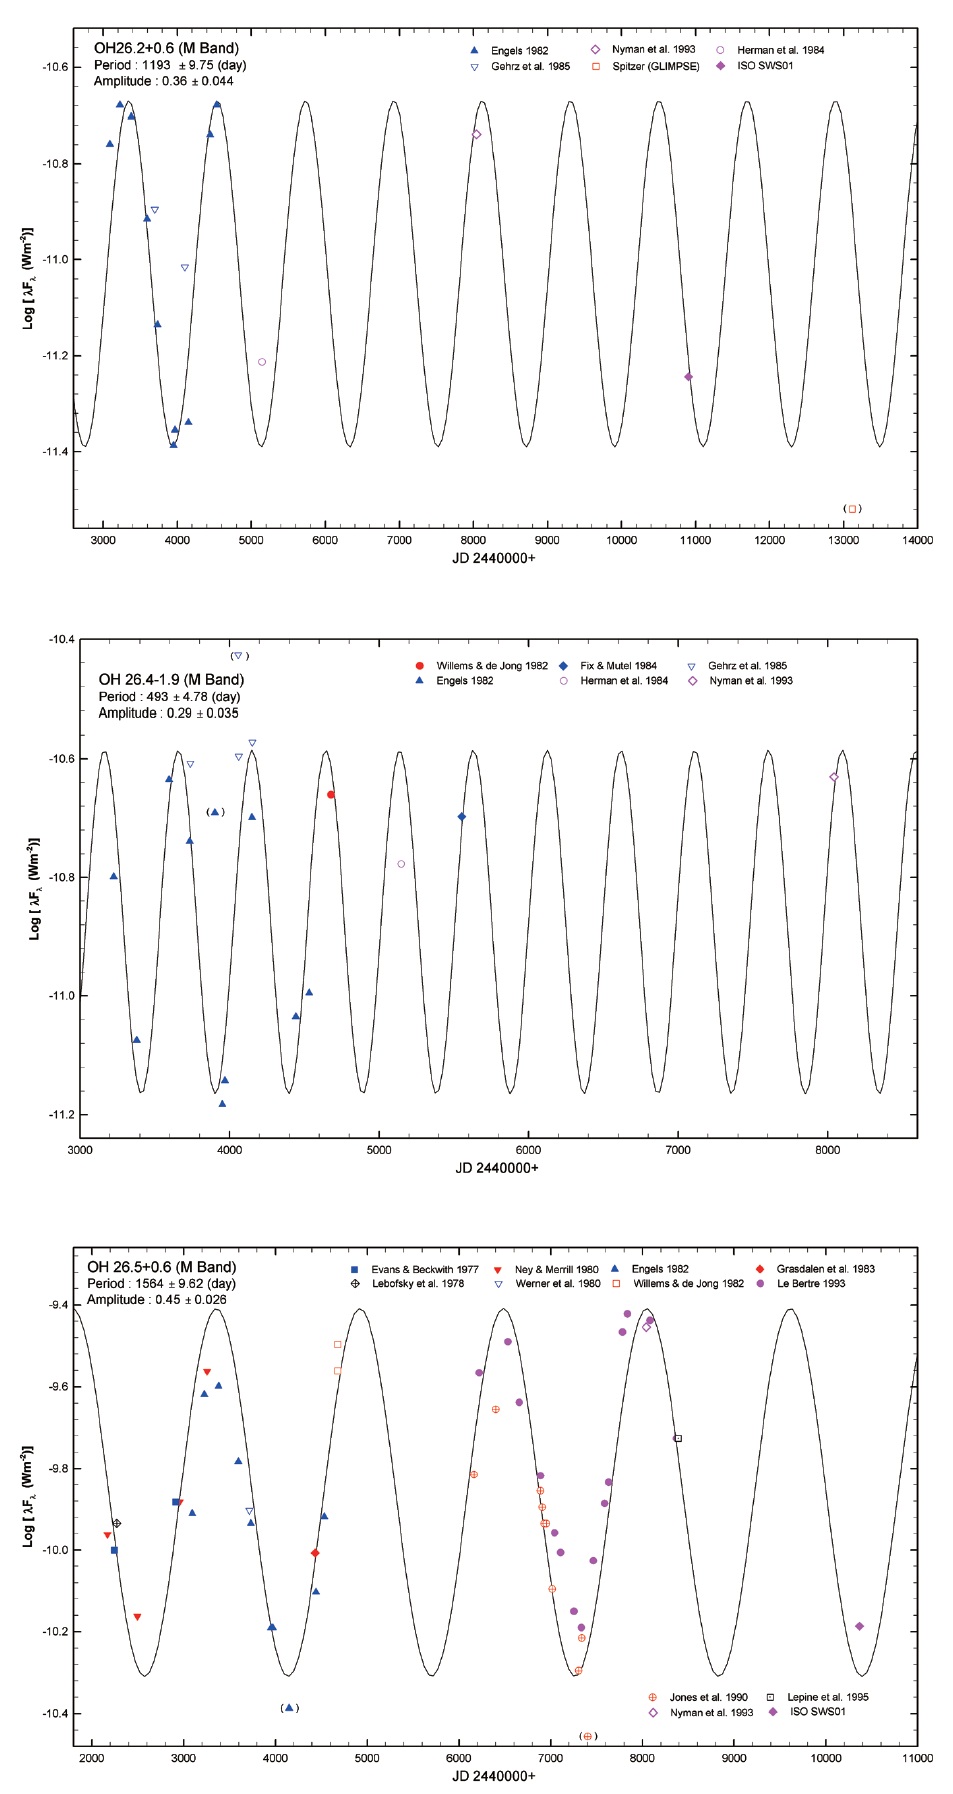
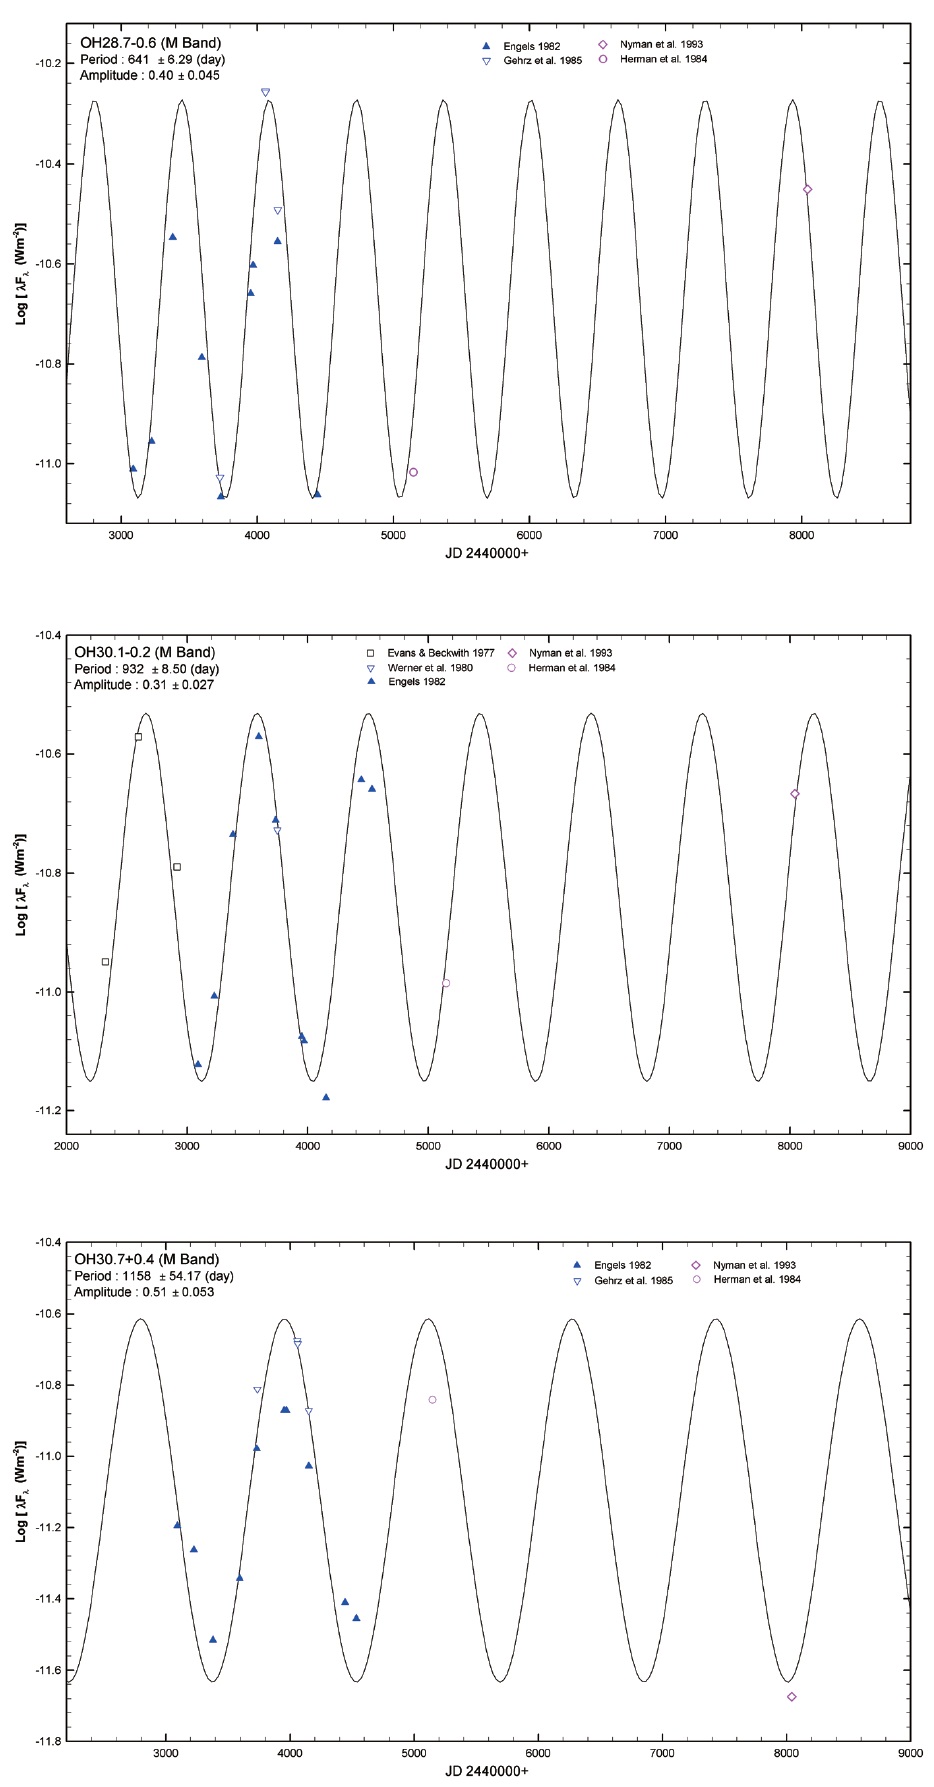
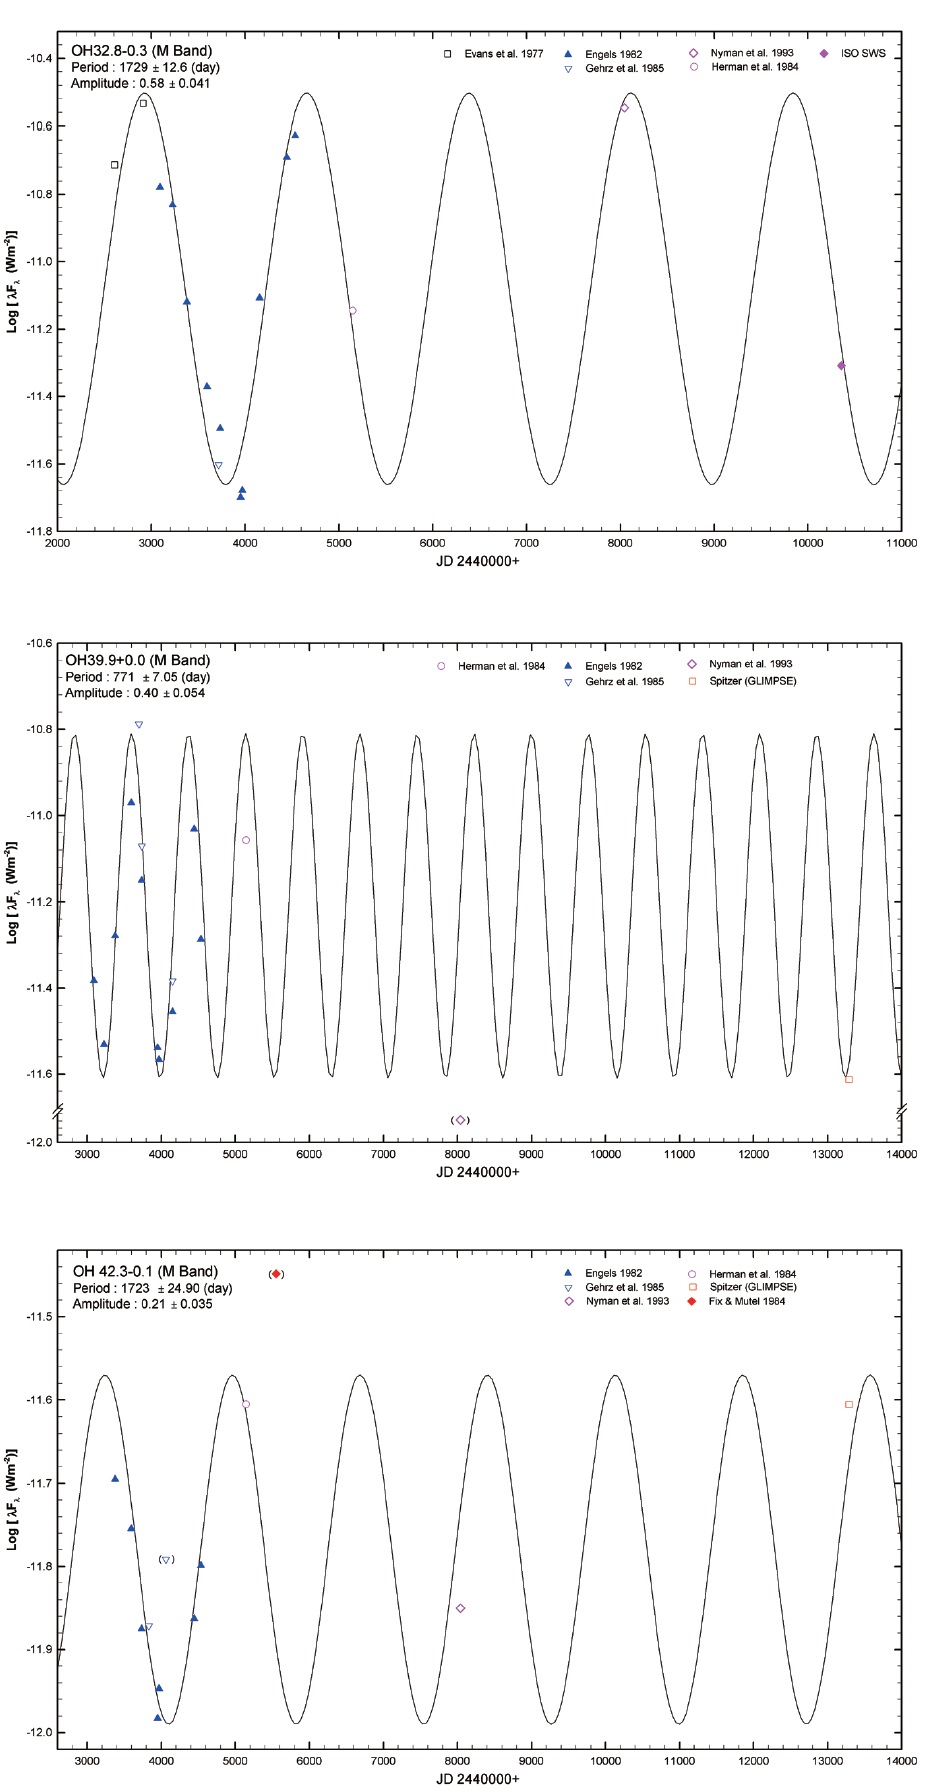
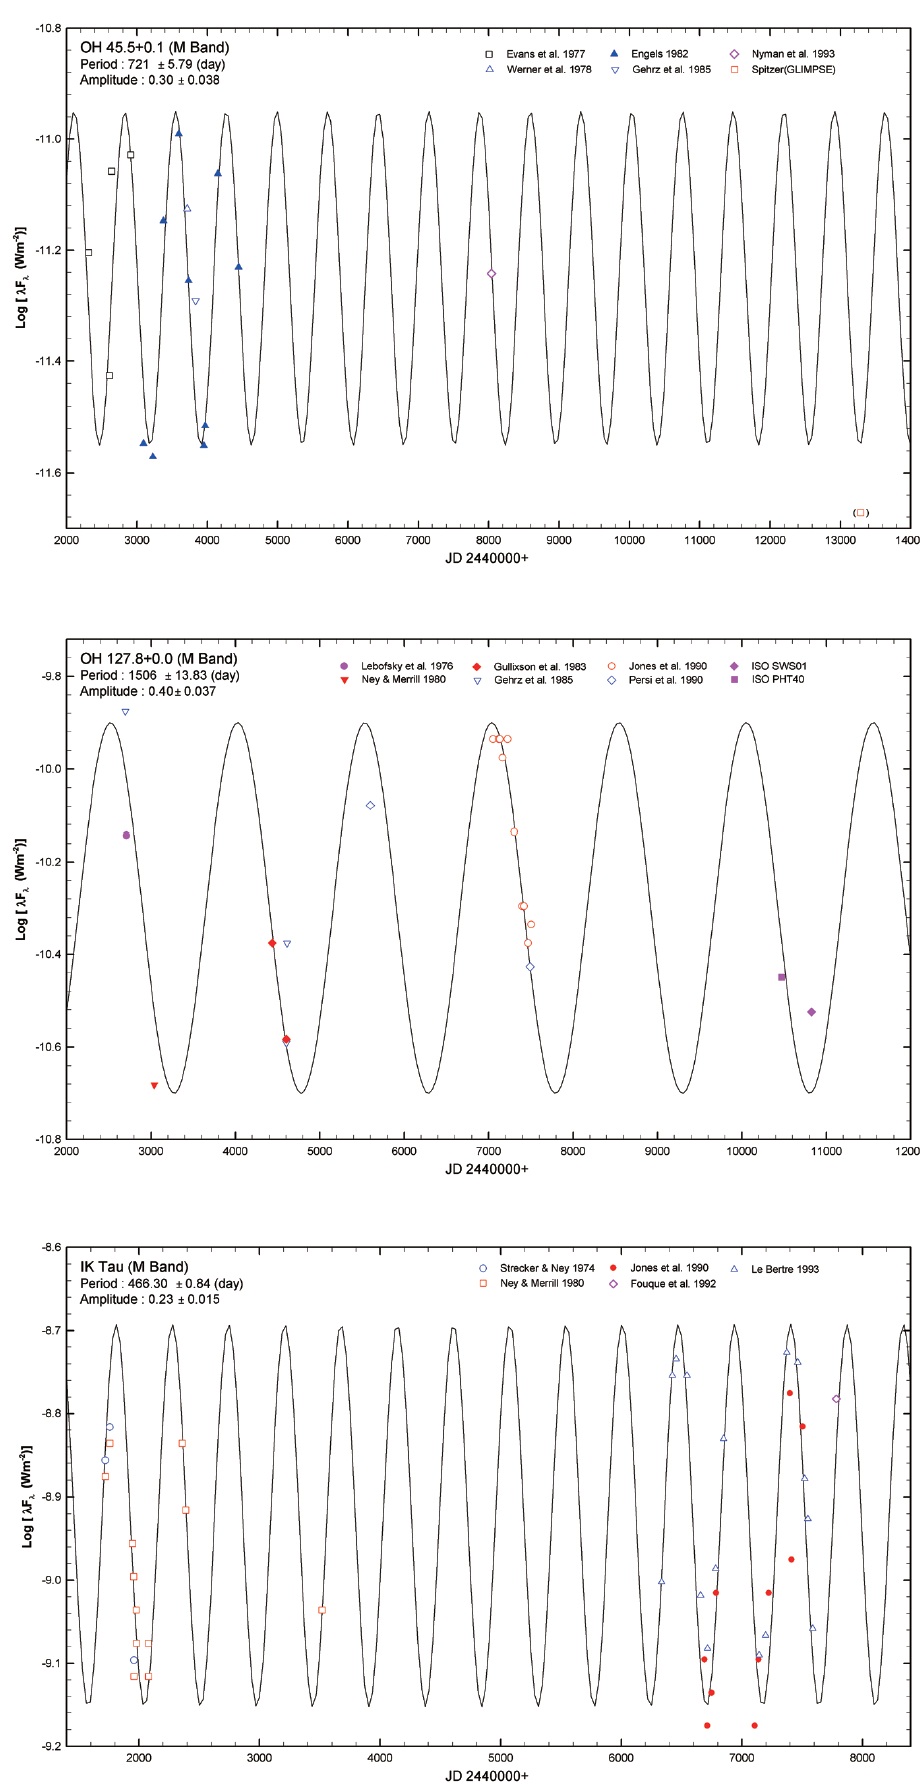
In Fig. 1, we plot the light curves for 12 OH/IR stars using the observation data (presented by symbols) at
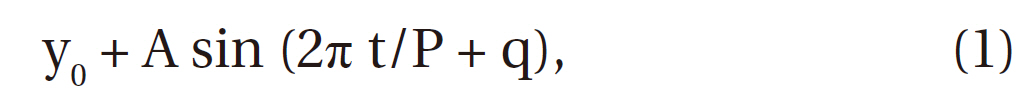
where y0 is the mean-brightness, A and P are the pulsation amplitude and period, and q is the phase parameter. For curve-fitting of the observational data, we use the Marquardt-Levenberg algorithm to find the coefficients of the individual variables (Press et al. 1986). We perform the curve-fitting using the same weighted value for all the data. By analyzing the light curves, we determine the new pulsation parameters: the period, amplitude, and mean
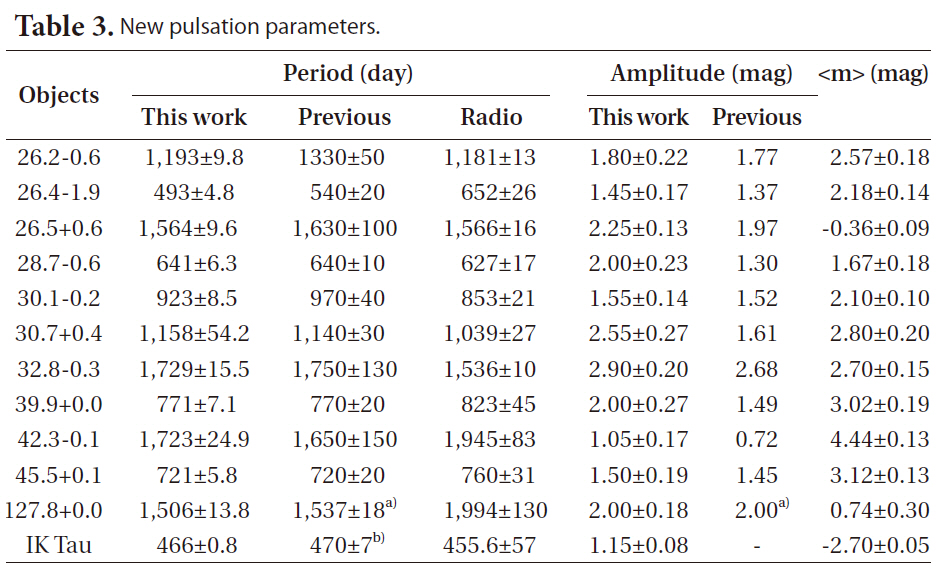
[Table 3.] New pulsation parameters.

New pulsation parameters.
brightness.
We neglect the long-term trends caused by a secondary period within the time range of observation data. The data points that do not follow the general trend are not used for determination of the pulsation parameters. These unused data points are marked by parenthesis in Table 2 and the light curves (Fig. 1).
In Table 3, we list the new pulsation parameters (period, amplitude, and mean brightness) obtained in this paper and previous investigations. The periods and amplitudes except marked ones in the column of previous works are taken from Engels et al. (1983) and the periods in radio band are from the OH maser observations by Herman & Habing (1985). The period of IK Tau from Hale et al. (1997) was based on variations in 11 ㎛ flux.
Generally, the new pulsation parameters obtained in this paper show much smaller standard deviation errors than previous works because of the larger database. Only for OH 30.7+0.4, our results show larger errors possibly due to unusual scatters in the new five data points of the object.
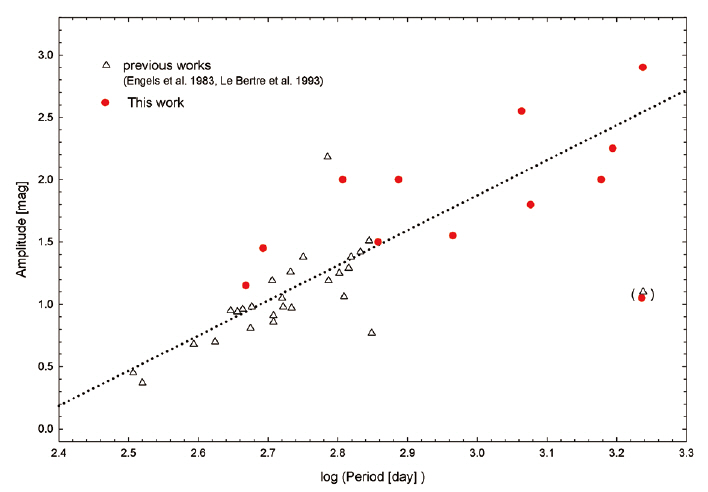
3.1 Period and amplitude (P-A) relation
Fig. 2 shows the period-amplitude relation at M band for 12 OH/IR stars obtained in this paper and previous investigations of Engels et al. (1983) and Le Bertre (1993). We find a general relationship between the period and amplitude for Mira-type LPVs at M band. A linear relationship from 36 data points at M band is Amp (M) = 2.81 log (P_M)-6.57. The unused data points because of the too much scatter from the general trend are marked by parenthesis.
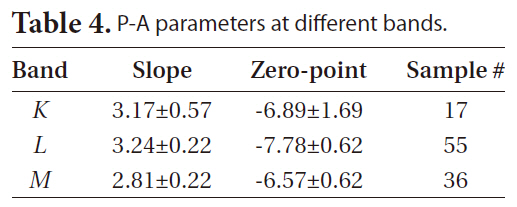
[Table 4.] P-A parameters at different bands.

P-A parameters at different bands.
When we compare the P-A relation at three different bands, the
3.2 OH/IR stars with small amplitude pulsation
In Fig. 2, there are two peculiar stars (OH 30.1-0.7 and OH 42.3-0.1; marked by parenthesis in lower right corner) that have small pulsation amplitude for their long periods. The pulsation period and amplitude of OH 30.1-0.7 were determined by Engels et al. (1983). One of the reasonable explanations for this could be that the stars are on the transition phase from AGB to Proto-planetary nebula (post-AGB) after a super-wind phase. Mass-loss of the post-AGB stars during this time may not stop abruptly, but decrease steadily for 102~104 years (Bedijn 1987). Flux density of SiO and H2O maser emission in inner circumstellar envelope can be dwindled down as decreasing of mass-loss rate.
Engels (2002) classified the H2O maser feature of young proto-planetary nebulae (PPN) into two types: type A and type B. Type A is AGB stars with low mass-loss rate (<10-6 M⊙/yr) and the peak velocity is located close to the radial velocity of the stars. Stars of type B have higher mass loss rate and consist of two line complexes close to the velocities of the OH maser peaks.
For OH 42.3-0.1, water maser emission at 22 GHz was observed several times. Olnon et al. (1980) observed that the H2O maser feature lies outside the OH 1,612 MHz emission range toward this star. Gomez et al. (1994) suggested that the star is a high-velocity outflow source in the early stages of post-AGB phase because the velocity width of the H2O maser emission is larger than that of the OH maser emission. However, a recent observation of H2O emission feature by Kim et al. (2010) found that the peak velocity is located near the radial velocity of the central star.
For OH 42.3-0.1, we find evidences for decreasing mass-loss rate. The mass-loss rate changes from a higher level (2.7 × 10⁻⁴ M⊙/yr at outer region obtained by Justtanont et al. 2006) to the level lower than 10-6 M⊙/yr in inner region (Kim et al. 2010). A threshold mass loss rate for H2O maser is about 10-8-10-7 M⊙/yr (Engels 2002). Thus the mass-loss rate at inner region for OH 42.3-0.1 would be between 10-8 and 10-6 M⊙/yr and keep decreasing rapidly. However, the line profile of H2O maser can vary in time. Therefore, we need to monitor this star for longer time to be able to make a firm conclusion.
SiO maser emission is rarely detected among PPN candidates (Nyman et al. 1998). Therefore, the detection of SiO maser emission from this star (Jewell et al. 1991, Kim et al. 2010) supports the idea that OH 42.3-0.1 could be a post-AGB star just leaving from AGB phase. If the star is really in the transition phase, the flux density of SiO/H2O maser will decrease for about several hundred years and evolve into a non-variable.
OH 30.1-0.7 seems to be a typical OH/IR star. H2O maser at 22 GHz is seen as a single-peaked spectrum near the blue-shifted OH peaks at 85 km/s (Cato et al. 1976, Valdettaro et al. 2001, Deacon et al. 2007) and SiO maser emission is also seen (Nyman et al. 1998). We could not find any evidences for decreasing mass-loss rate. More observations in infrared and radio regions are necessary for further study.
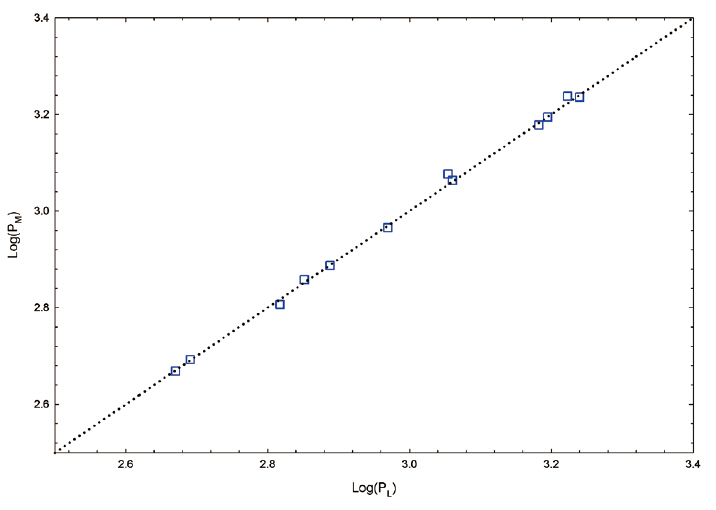
3.3 Comparison with the L band data
In paper II, we showed that the pulsation periods at
and
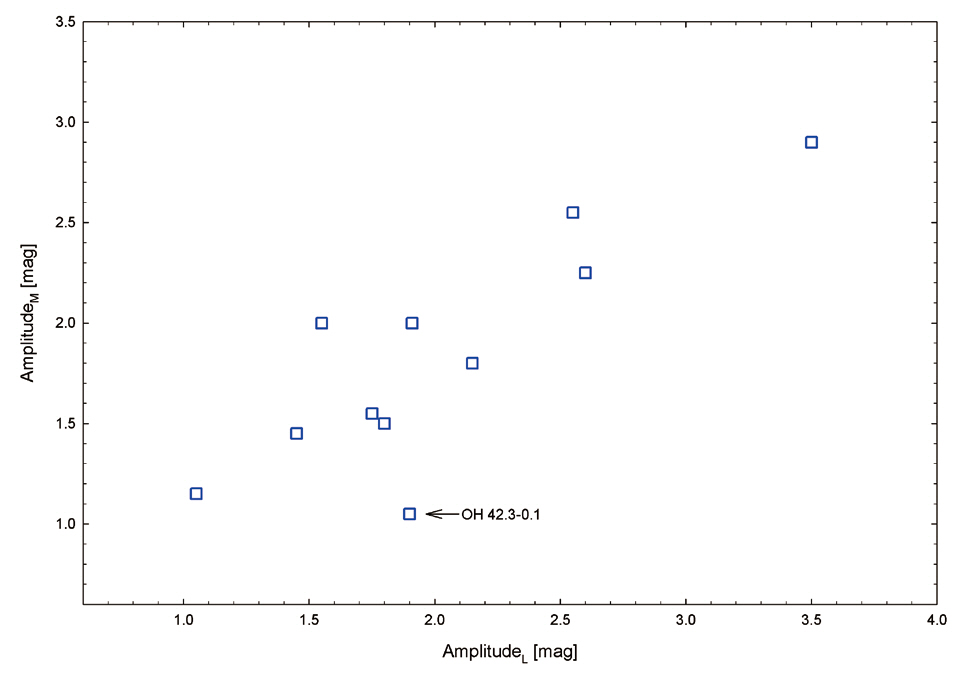
The amplitude relationship (Fig. 4) also shows a linear relation between
We have made the light curves at
We find that OH 42.3-0.1 with small amplitude pulsation could be a post-AGB star because of some evidences in the maser emission properties. However, we could not find any evidence of a post-AGB star for OH 30.1-0.7 with small amplitude pulsation. Further investigations are necessary for these stars.