With the rapid progress of electronics and Internet commerce,personal identification is becoming increasingly important.Biometrics technology is considered one of the safest and most efficient ways to identify individuals or discriminate between an authorized person and an impostor. Biometrics comprises methods of uniquely recognizing persons based on their intrinsic physical (e.g., fingerprint, finger geometry, face, iris, etc.) or behavioral (e.g., voice, signature, gate, etc.) characteristics [1-3]. Among these traits, the palmprint has attracted many researchers’ attention in the last 10 years. The palmprint, the large inner surface of the hand, contains many unique features such as principal lines, wrinkles, ridges, minutiae points, singular points, and texture. Earlier studies focused on high-resolution (at least 400 dpi) palmprint images for some applications such as law enforcement. Nowadays, most studies focus on low-resolution palmprint images for civil and commercial applications.
There are many approaches to palmprint recognition. Line-based approaches concentrate on extracting palm lines such as principal lines and wrinkles [4-8]. The extracted lines are usually encoded based on their orientation and magnitude. Appearance-based approaches use holistic appearance features such as principal component analysis [9, 10], the Fisher linear discriminant [11], and independent component analysis [12]. Statistical approaches transform an input image into another domain and divide the transformed image into small regions. Then statistical features are extracted from each small region [13, 14]. According to the results of these studies, line-based approaches are deemed to produce the most promising results. In particular, some studies [5,7, 8] based on line orientation information are considered the state-of-the-art methods. Kong and Zhang [5] used six 2D Gabor filters with different directions, and extracted the dominant orientation information using the winner-takes-all rule. Wu et al. [7] devised four directional templates to define the orientation of each pixel. Jia et al. [8] devised another six directional templates based on modified finite Radon transformation.
In line-based methods, it is important to classify points as located on a palm line or not. This classification poses a challenge. Kong and Zhang [5] assumed that each point on a palmprint image is located on a palm line. Under this assumption, the orientation of each point is extracted. This approach is simple and has shown promising results. Thus, the following researches [7, 8] used the same approach.This approach has some problems, though. The line structures in a palmprint image are complex, and multiple lines may intersect in some regions. Although the orientation information of the pixels that are on palm lines is robust to variations in lighting conditions, the orientation information of the other pixels could be vulnerable to changes in illumination. That is, the orientation information of a point that is not located on a palm line is more fragile than that of a point on a palm line. Furthermore, the majority of the points are not located on a palm line. To solve this problem,this paper proposes a new viewpoint. When a palmprint image is hypothetically considered a 3D terrain, the principal lines and wrinkles become deep and shallow valleys on a palm landscape. All the line-based methods have tried to detect the orientation of valleys, but this study focuses on the slope caused by deep and shallow valleys. The main goal of this study is to detect the orientation of the steepest slope in a local area.
The rest of this paper is organized as follows. Section 2 presents a preprocessing method of extracting a region of interest (ROI) in a palmprint image and proposes a new feature that represents the dominant slope orientation of each pixel. Section 3 presents the feature-coding method by which a gradient orientation map is created, and describes a feature-matching method based on pixel-unit comparison. In Section 4, the experimental results and analysis are provided, and finally, the conclusions are described in Section 5.
II. EXTRACTION OF PALMPRINT FEATURES
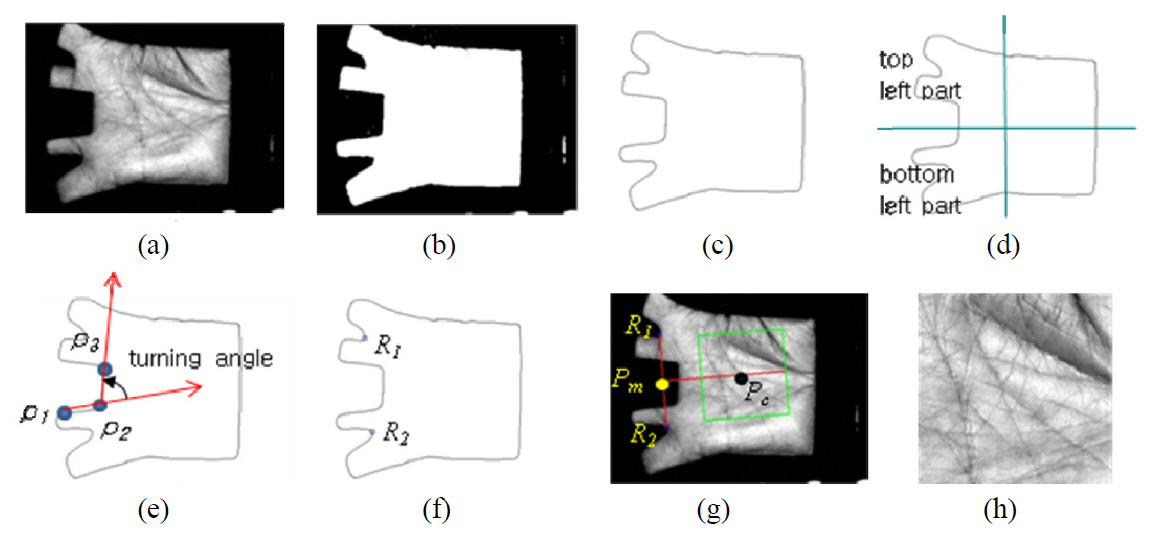
When palmprint images are captured, some variations may occur such as in translation and rotation. Hence, palmprint images should be aligned in position and orientation before the feature extraction step [15, 16]. The central part of a palm is a region of interest (ROI), from which a palmprint feature is extracted. The five main steps in cropping the ROI are as follows.
(1) The fixed threshold method is used to convert the original image into a binary image. Some noises, including isolated pixels, can be ignored.
(2) The boundary of the palm is traced and then smoothed with a Gaussian filter.
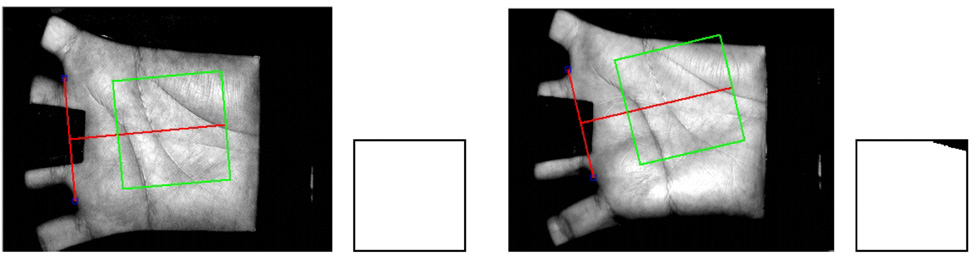
(3) Two reference points, R1 and R2, are located using a turning angle. Three equidistant points, p1, p2, and p3,on the boundary form two vectors that extend from p1 to p2 and from p2 to p3. The two vectors form a turning angle, as shown in Fig. 1 (e). The three points move together clockwise around the boundary. The turning angle varies according to the relative positions of the three points. If the direction of a vector is counterclockwise, the turning angle has a negative value. Otherwise, it has a positive value. R1 is the position of point p2, where the turning angle has the smallest negative value in the top left area of the boundary. Similarly, R2 can be found in the bottom left area of the boundary.
(4) The central point of a palm (Pc) is located. R1 and R2 are lined up to get the Y axis of the palmprint coordinate system, and the perpendicular line L that passes through the midpoint (Pm) of the two points is used. Pc is found on line L so that the length between Pm and Pc would equal a predefined value.
(5) ROI is defined as a squared region, which is extracted with Pc as its central point. ROI is cropped and the skew is corrected via rotation.
2.2 Gradient Feature Extraction
For a function
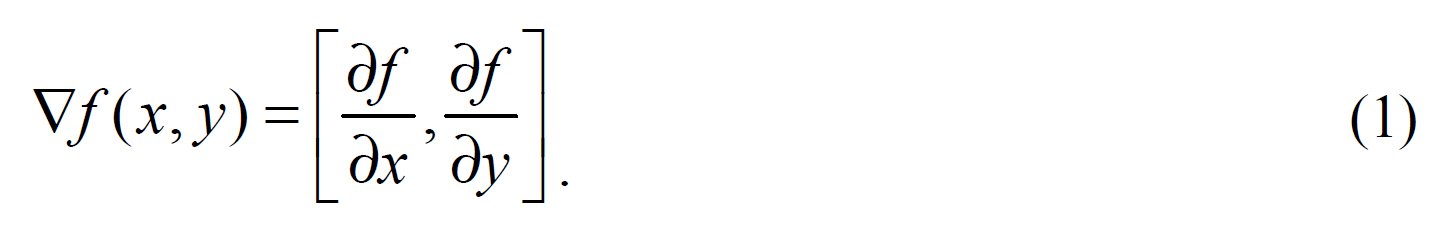
The gradient vector points in the direction of the greatest rate of increase of
The directional feature of the gradient is more robust than the feature of the magnitude with respect to variations in lighting conditions. Thus, this study focuses on the directional feature. To compute a gradient vector, the Kirsch operator[17] is used. The Kirsch operator is a non-linear edge detector that finds the maximum edge strength in a few predetermined directions. The direction of the gradient at point (
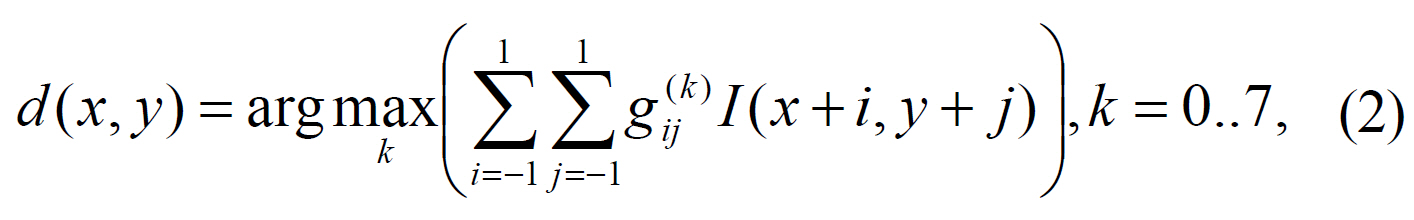
where
III. FEATURE CODING AND MATCHING
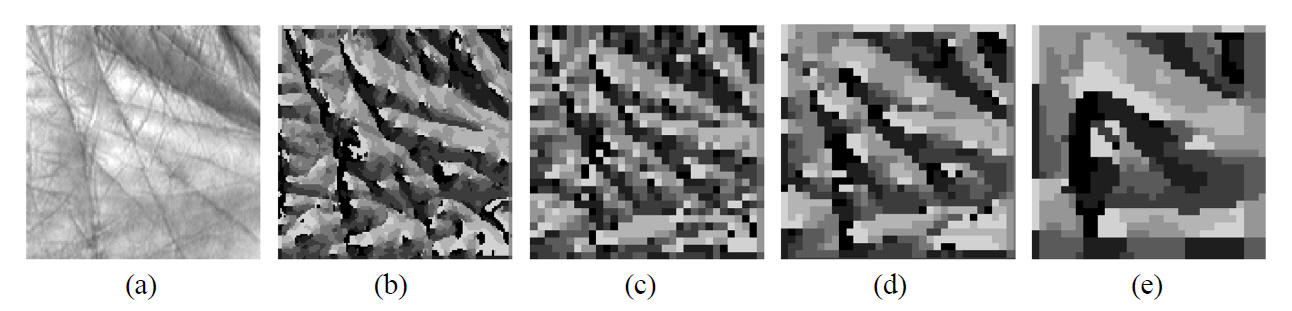
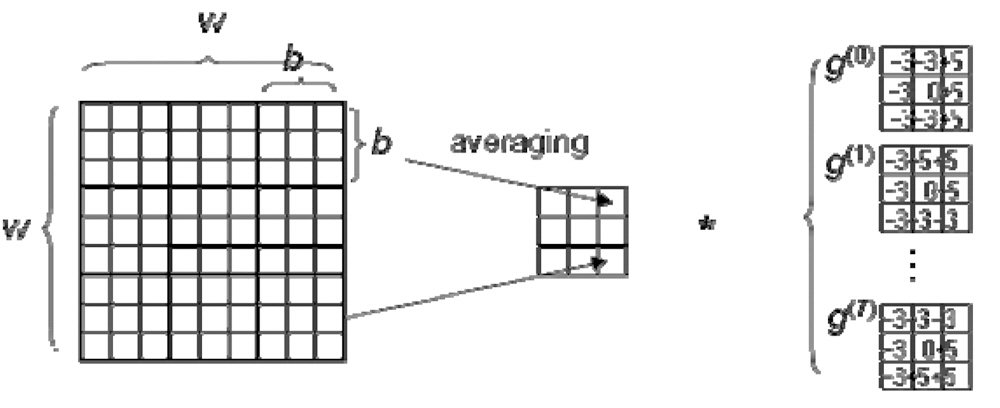
Feature coding of the palmprint is performed by replacing all the pixels in the ROI with their index in the gradient direction. Feature coding creates an orientation map. If all the pixels in a cropped ROI image are encoded, if the size of the ROI image is 128×128, the size of the orientation map is also 128×128, as shown in Fig. 3 (b). It requires much processing time and creates redundant information. The computation time and the amount of redundant information can be reduced via downsampling. If every fourth pixel is selected, the processing time becomes one-sixteenth shorter, and the size of the orientation map becomes 32×32. As shown in Fig. 3 (c), feature coding saves most of the important information in the higher-resolution orientation map. On the other hand, if the ROI image is downscaled and convoluted with the same scanning window, orientation maps with different scales can be created. The downscaling is performed by averaging the intensity of the pixels in the non-overlapping 2×2 window. Fig. 3 (d) and (e) are created from half-scaled and quarter-scaled ROI images, respectively. The orientation map represents local or global gradient information according to the scale.
The basic strategy for calculating the similarity between two feature images is pixel-to-pixel matching. Let
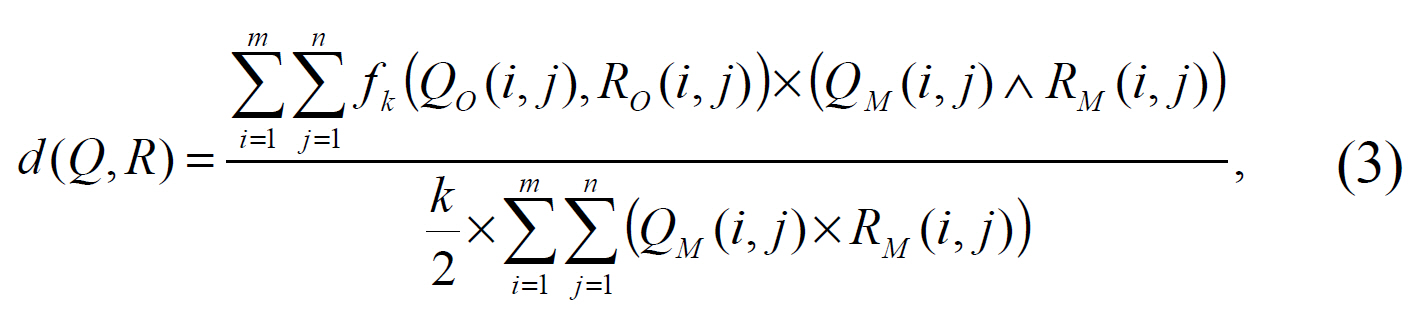
where the function
A translated or rotated palm image is mostly aligned in the preprocessing step, in which the ROI of a palm is extracted. Any remaining variation due to imperfect preprocessing can degrade the performance of the pixel-to-pixel matching method, though. Thus, the pixel-to-cross-shaped area comparison method, which was introduced in the study of Jia et al. [8], was used to improve the matching robustness. The distance function described in Eq. (3) is modified as follows:
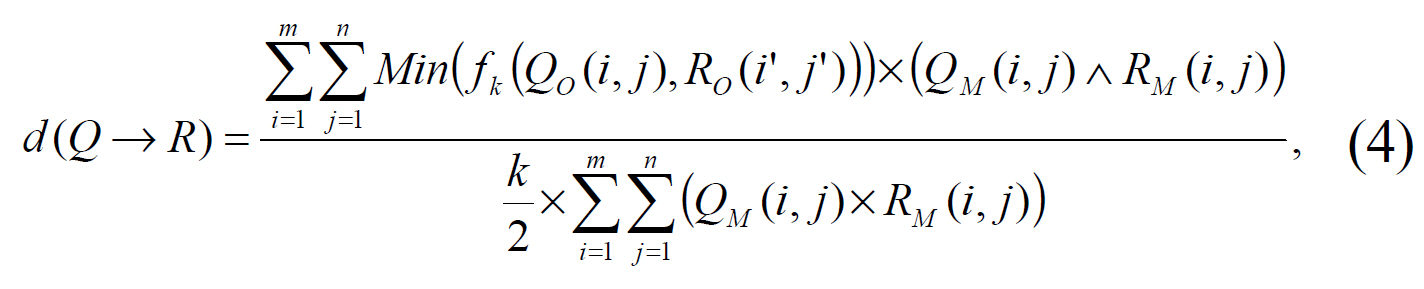
where (
3.3. Fusion of Matching Distances
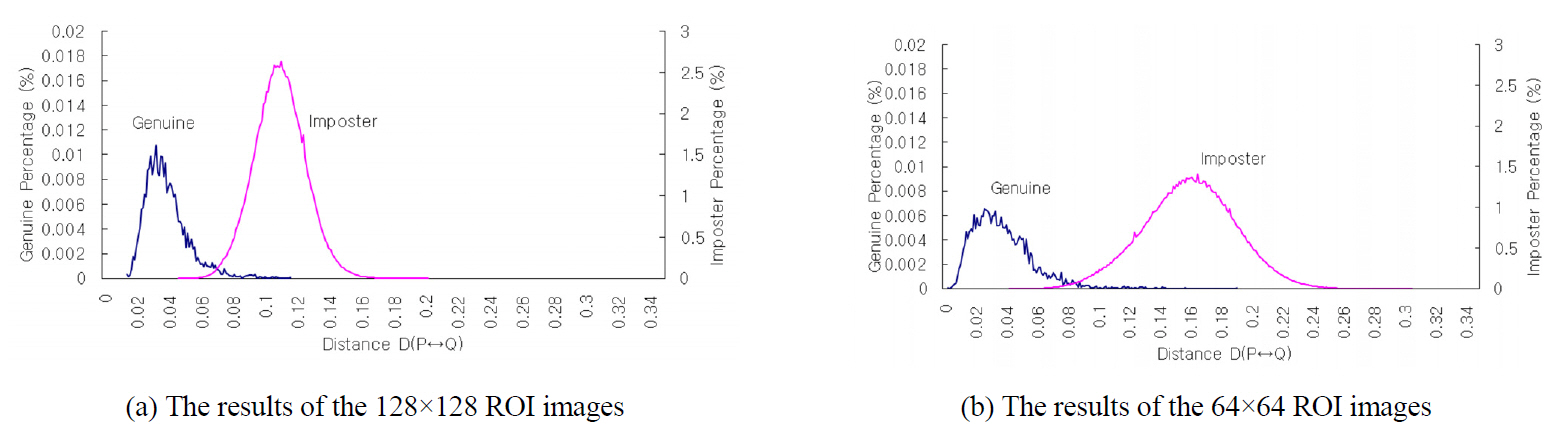
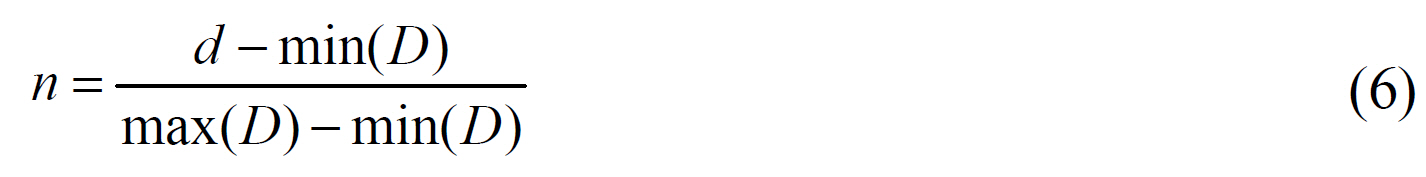
In this study, three orientation maps were made with different scales to represent local and global gradient information. The local gradient information is extracted from the cropped 128×128 ROI images, and its two downscaled 64×64 and 32×32 images are used to represent the gradient information in the wider area. Before the matching distances that were obtained from the multi-scale orientation maps were fused,distance normalization was required because they have different statistical properties such as their mean, deviation, and minimum and maximum values. The Min-Max method described in Eq. (6) was used for the normalization. The quantities max(
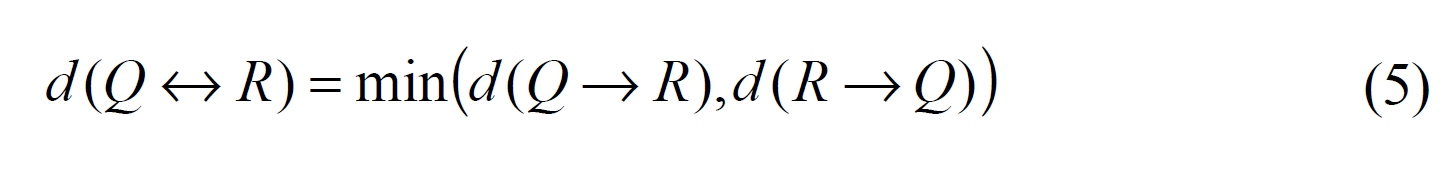
Two or more normalized distances can be fused together to get the final matching distance. The final matching distance between a query image
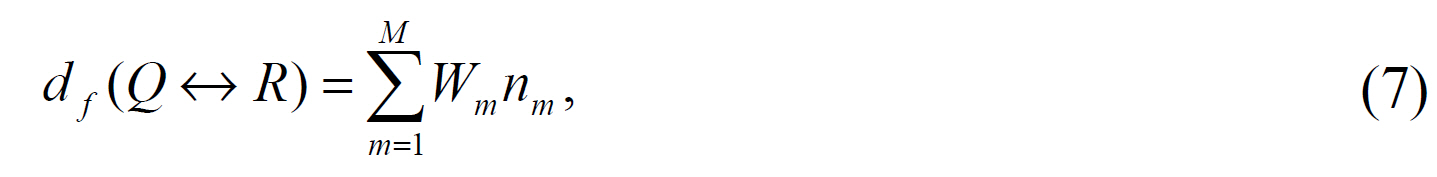
where
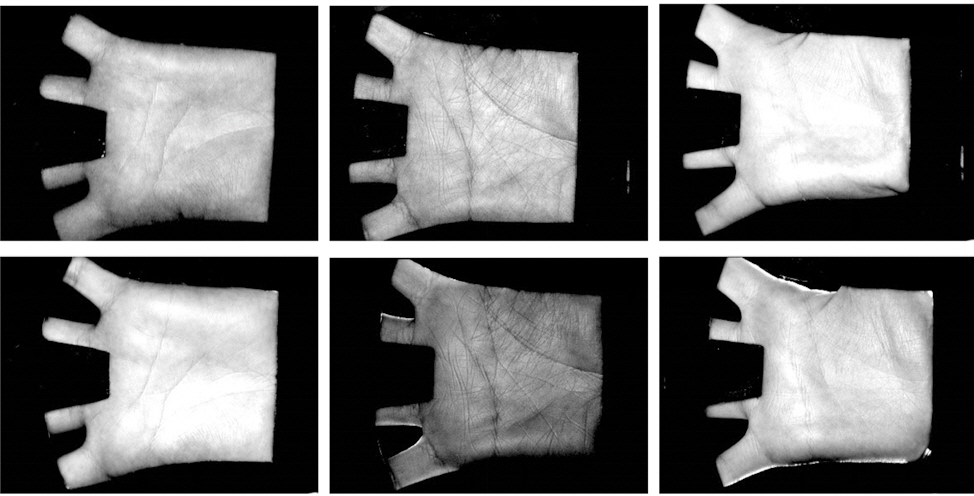
The widely used public database, PolyU [19], was used to evaluate the performance of the proposed method. The database contains a total of 7,752 images from 386 different palms. The palmprint images were collected in two sessions. In each of the sessions, around 10 samples for each palm were captured. The average interval between the first and second sessions was about two months. In addition, the light source and the focus of the CCD camera were changed so that the images that were collected in the first and second sessions could be regarded as having been captured by two different devices [8]. An LED was used in the first session, and an incandescent lamp was used in the second session. Also, the lenses in the two sessions slightly differed, and the focus in the first session was slightly longer. Some samples in this database are shown in Fig. 5, in which the four samples in the top row were captured in the first session and those in the bottom row were captured in the second session. The two images in the same column were captured from the same palm at different sessions.
The database was divided into two data sets: training and testing. The training and testing data sets consisted of the samples that were taken in the first and second sessions, respectively. Only the training data set was used to adjust the parameters of the size of the scanning window and the resolution of the orientation map. Palmprint verification was performed by matching a sample taken from the testing data set with the registered templates that were made from the training data set. This is a more realistic experiment because the two data sets were not collected in the same session, as is always the case in real-world applications.
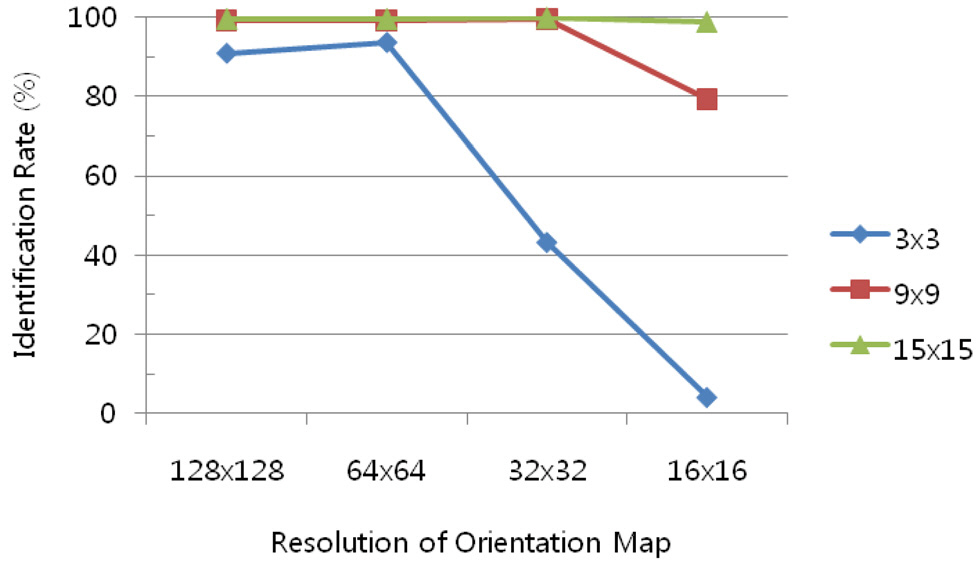
4.2. Selection of the Window Size and the Resolution
To test the effects of some parameters, 1,000 samples were selected from 200 different palms in the training dataset. Only the first sample of each palm was selected to create the reference model, and the other four samples of each palm were used for testing. The size of the scanning window and the resolution of the orientation map are important parameters that affect the recognition accuracy and the processing time. The size of the scanning window controls the sensitivity of the local intensity variation, and the shifting unit of the scanning window controls the resolution of the orientation map. If the shifting unit doubles, the resolution of the orientation map is halved both horizontally and vertically. The nearest neighbour classifier was used for the recognition. Fig. 6 shows the recognition rate for the different sizes of the scanning window with different resolutions of the orientation map. When the local image in the scanning window was directly convoluted with the derivative kernels, that is, when the 3×3 scanning window was used, poor results were achieved. In particular, when the size of the orientation map was 32×32 or less, the performance was drastically degraded.In the case when the compressed image was used, promising results were achieved. In addition, the performance was well-preserved even in the 32×32 orientation map. The larger the scanning window and the higher the resolution of the orientation map were, the more processing time was needed, so the 9×9 scanning window and the 32×32-resolution orientation map were used.
A biometric system classifies an individual as either a genuine user or an impostor. Thus, the system may commit two types of recognition error: it may either falsely accept an impostor or falsely reject a genuine user. If the matching distance does not exceed the appointed threshold, the palmprint is accepted. Otherwise, it is rejected. The false acceptance rate (FAR) is the probability that an unauthorized individual will be accepted, and the false rejection rate (FRR) is the probability that an authorized user will be inappropriately rejected. If a system is designed so that it would be more difficult for an impostor to enter by adjusting the threshold(i.e., reducing the FAR), the system also becomes more difficult for a valid person to enter (i.e., the FRR will increase) [20]. Thus, the two rates contradict each other and cannot be lowered at the same time. The genuine acceptance rate (GAR) is also dependent on the threshold, because it is calculated with 1-FRR at a specific FAR. The equal error rate (EER) is independent of the threshold, however, because it is the rate at which the FAR is equal to the FRR.Therefore, the EER can be used as an application-independent metric. The decidability index
Three data sets,
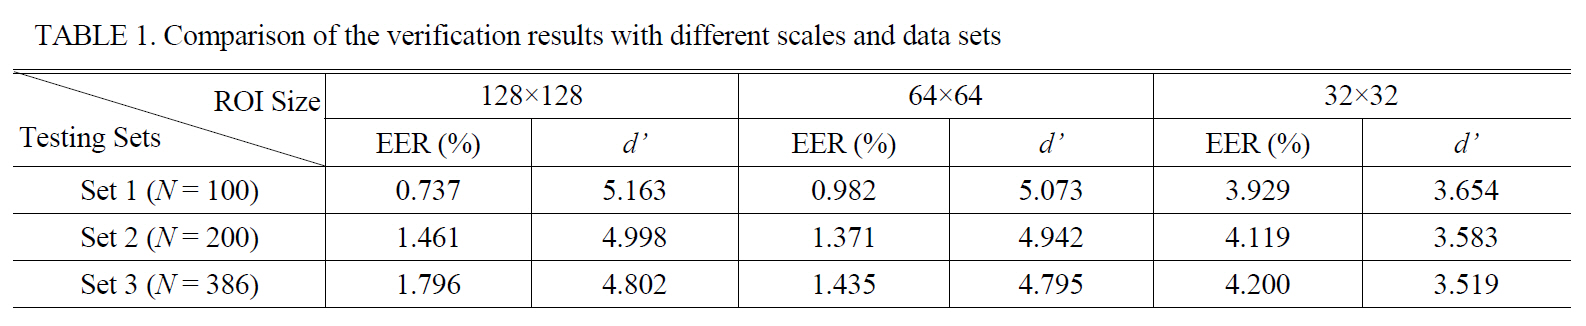
[TABLE 1.] Comparison of the verification results with different scales and data sets

Comparison of the verification results with different scales and data sets
[TABLE 2.] Comparison of the verification results of four different fusion methods
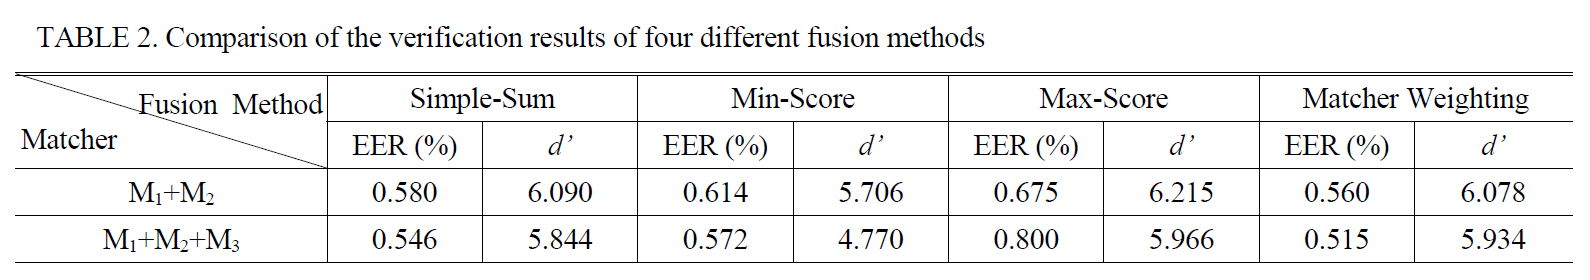
Comparison of the verification results of four different fusion methods
To find the fusion method that can enhance the accuracy of the palmprint verification, four different fusion methods were experimented on: simple-sum, min-score, max-score,and matcher weighting [22]. Table 2 shows the verification results of the fusion methods, where
4.4. Comparison with Other Palmprint Verification Methods
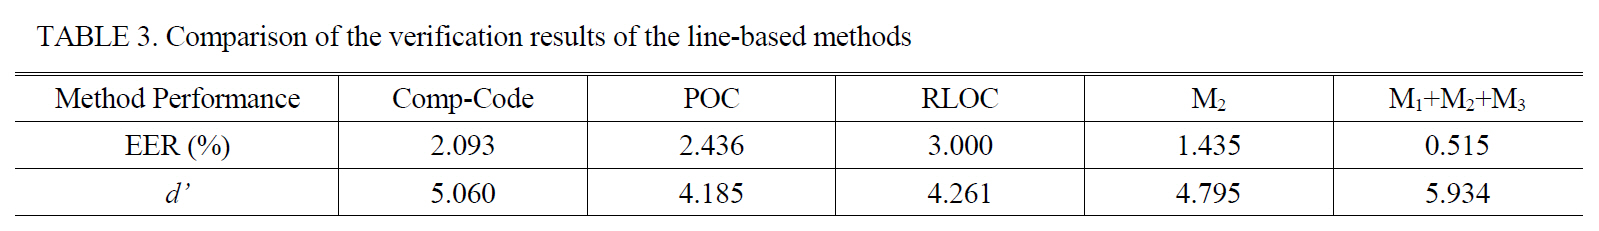
The approach in this study was compared with three line-based methods that are based on orientation coding:competitive coding (CompCode), palmprint orientation coding(POC), and robust line orientation coding (RLOC). To compare the features of these different methods under the same conditions, the preprocessing routine was shared and the same strategy for pixel-to-cross-shaped area matching was used. The verification results are described in Table 3.
Comparison of the four methods in which a single-scale feature was used showed that the proposed approach
[TABLE 3.] Comparison of the verification results of the line-based methods

Comparison of the verification results of the line-based methods
In this study, a new approach to palmprint verification based on gradients was proposed. A palm image was hypothetically considered a 3D terrain. From this viewpoint, the principal lines and wrinkles become deep and shallow valleys. Most previous studies based on orientation coding focused on the direction of the valley itself, but this study focused on the steepest slope direction in each local area, where the slope is mainly caused by the valleys.
The experimental results showed that the gradient orientation feature that was obtained using the Kirsch operator is highly effective in palmprint verification. They also showed that the proposed method is superior to other methods based on line-based orientation coding. In particular, the fusion of orientation maps with different scales greatly improved the verification, regardless of the fusion method. Although this work was presented in the context of palmprint verification, the proposed approach is general enough, and the ideas can be applied to other biometrics such as iris and finger knuckle verification.