The minimum amount of a color variance perceived by the visual system is referred to as threshold. Perceptibility and acceptability are the most often used threshold units in the field of color science. However, they have been confused in many cases [1]. Perceptibility can correlate to a just perceptible difference, which is a psychophysical measurement of observers’ judging whether a difference exists. Acceptability judgment is another visual judgment about a given physical stimulus. One thing that can be distinguished from perceptibility is that observers interpret and compare the magnitude of the stimulus with that of its tolerance. Such thresholds can be very significant to color quality control processes in the printing industry and should be defined in quality measure units. Optical density (OD) and color difference models are usually utilized as color quality measures and have been provided in a considerable number of commercial measuring devices such as spectrophotometers. However,their merits and traits for both perceptibility and acceptability thresholds are far less understood in the literature.
Kim et al. [2] measured the acceptability sensitivity of human observers to the reflection OD variation using a simpler method of limits and proposed a computational model for predicting the acceptability threshold and sensitivity as a function of OD of given color patches. Their findings show that the OD threshold function can be explained by a log function of OD. The current study intends to measure both acceptability and perceptibility psychophysically and to define the data in those various color quality measures including OD, CIELAB color difference (ΔE*ab),CMC color difference (ΔECMC(l:c)) and CIEDE2000 (ΔE*00);therefore performance of the quality measures can also be evaluated and compared with each other.
Densitometry has been widely used for color quality evaluations in the printing industry due to the strong linearity regarding colorant amounts and to simplicity. Based upon the Beer-Lambert law [3], optical density (OD) can be defined as
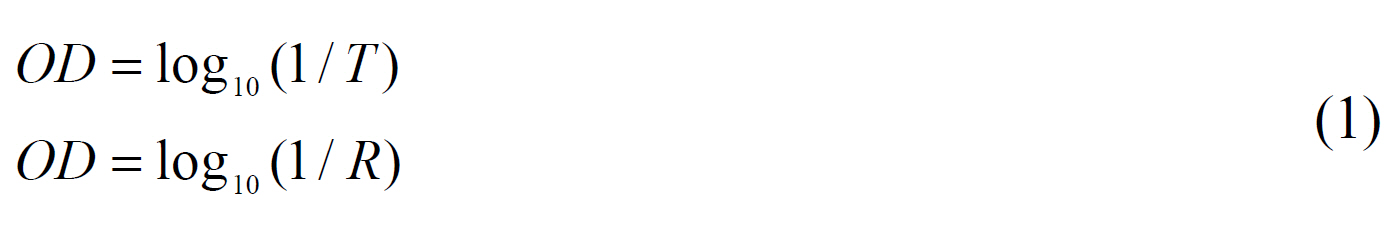
where T and R denote transmittance and reflectance, respectively.
There are two types of density measurements: transmission and reflection. The former measures the density of transmissive or transparent samples and the latter measures that of reflected light through an optical filter that transmits a region of the light in one of the red, green or blue regions of the visible spectrum for separating color signals. The OD can also be defined in spectral and colorimetric domains.The spectral density function can be achieved by taking a logarithm for the inverse of reflectance function of a given color. The colorimetric density refers to the logarithm of normalized tri-stimulus values and correlates highly to tone reproduction curves.
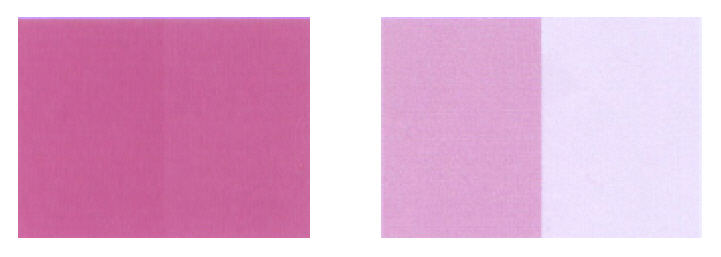
Figure 1 demonstrates a smaller perceptible color difference at high density colors in the left pair (a) and a larger perceptible difference at low density colors in the right pair(b). However, difference in OD for those two pairs is identical(0.2). This sometimes causes misconceptions and miscommunications because the tolerance level of OD has to be adjusted for the tonal level of the reference color sample.Besides, the hue variation is not taken into account.
2.2.1 CIELAB Color Difference
The CIELAB color difference has been widely used because of its simplicity. It can be computed as the Euclidean distance between two points in CIELAB color space. [4](See Equation (2))
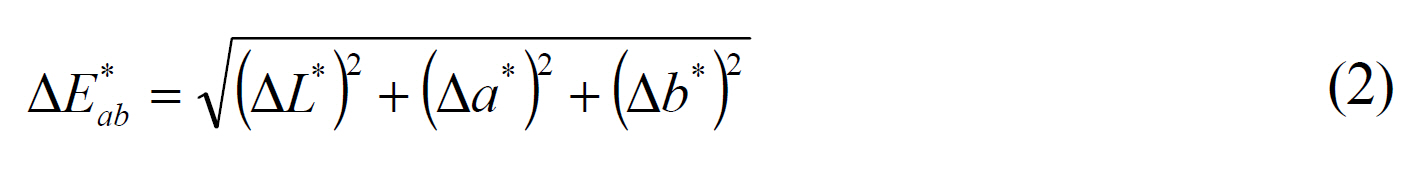
where
The other way to calculate the CIELAB color difference is using perceptual attributes, lightness (
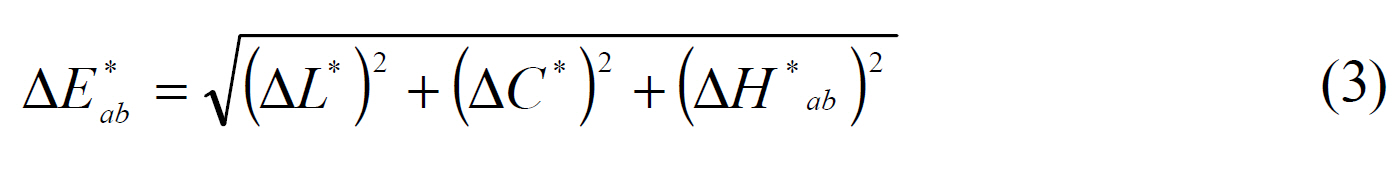
where
2.2.2 CMC
The Color Measurement Committee (CMC) of the Society of Dyers and Colorists defined a color difference equation referred to as CMC (
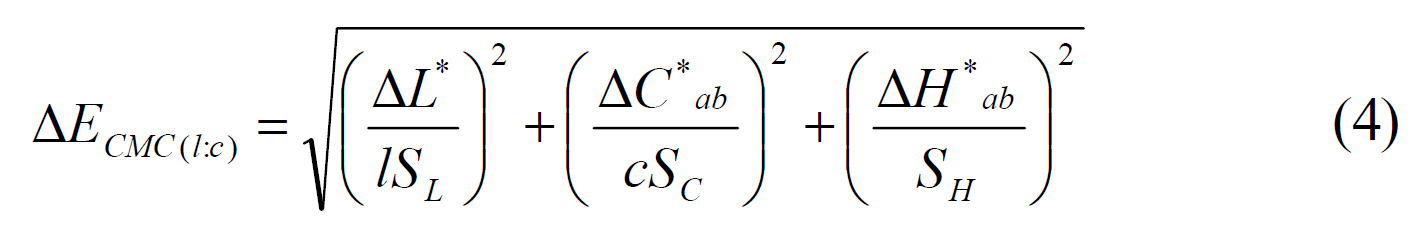
where
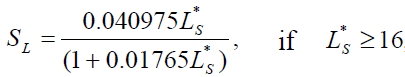
but
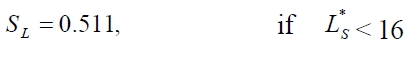
and
The terms
and
The subscript
2.2.3 CIEDE2000
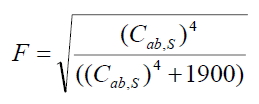
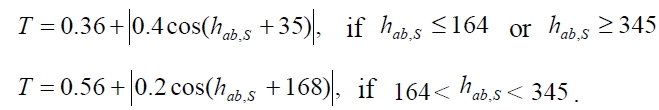
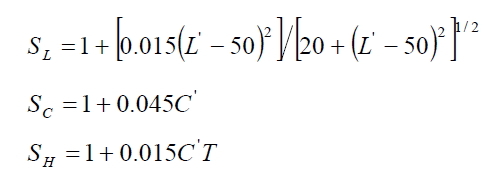
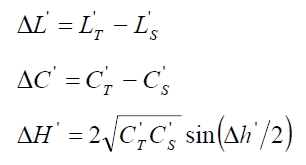
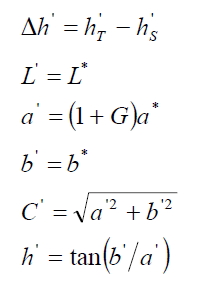
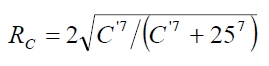
The CIE has recently agreed on the CIEDE2000 color difference formula for the evaluation of small color differences.[6] It includes not only lightness, chroma and hue weighting functions, but also an interactive term between the chroma and hue differences for improving the performance for blue colors and a scaling factor for the CIELAB
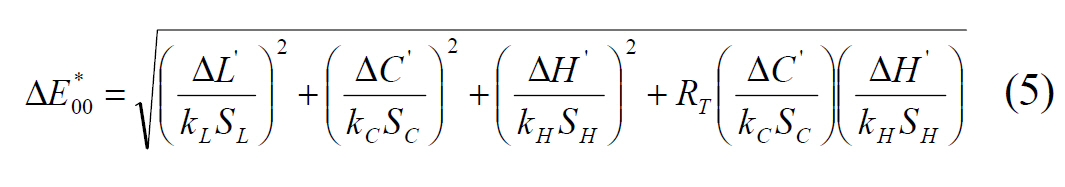
where
The terms
where the subscripts
The
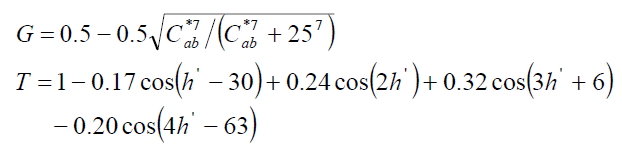
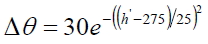
Finally, the rotation term
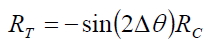
where
and
2.3. Perceptibility and Acceptability
Perceptibility and acceptability are often confused. Perceptibility can correlate to a just perceptible difference, [7]which is a psychophysical measurement of observers’judging whether a difference exists. In order to quantify a just-perceptible difference, a visual colorimeter can be used.In two halves of the bipartite field, a color-matched pair is seen. Observers are asked to change the wavelength of one of them until a difference is first noticed. This measure is obtained without any interpretation of human observers and treats the eye as a null detector. In other words, a visual judgment made without interpreting its importance is known as a perceptibility judgment.
Acceptability judgment is another visual judgment about color difference. One thing that distinguishes it from perceptibility is that observers interpret the color difference when they are seen. For instance, green foliage in summer gradually becomes yellow in early autumn. Its alterations are not easily recognized, because observers become more tolerant, but suddenly its change can be visible. These are judgments of acceptability. As soon as a batch of material is either “passed” or “failed,” or “accepted” or “rejected,” an acceptability decision has been made. Thus, even if two pairs of colors show the same perceptibility, acceptability judgments can be different to each other. Berns [1] illustrated examples of this judgment and explained in great detail.
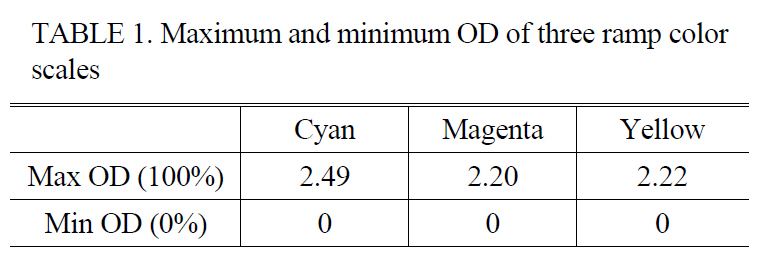
Three color scales of cyan, magenta and yellow are selected as the test samples. Each of three color scales is equally spaced with digital input values; the interval of digital input values is one from 0 to 255. In total, 768 color samples were printed by a selected color inkjet printer (Epson STYLUS PHOTO 2200) on a substrate of the A4 sized Epson Premium Glossy Photo Paper. They were engineered to print out solid colors only. Each color scale contains a hundred color segments of which colorant amount varies from 0 to 100% and the maximum and minimum OD are provided in Table 1. As can be seen, the maximum OD reaches up to 2.49 for cyan, 2.20 for magenta and 2.22 for yellow.
[TABLE 1.] Maximum and minimum OD of three ramp colorscales

Maximum and minimum OD of three ramp colorscales
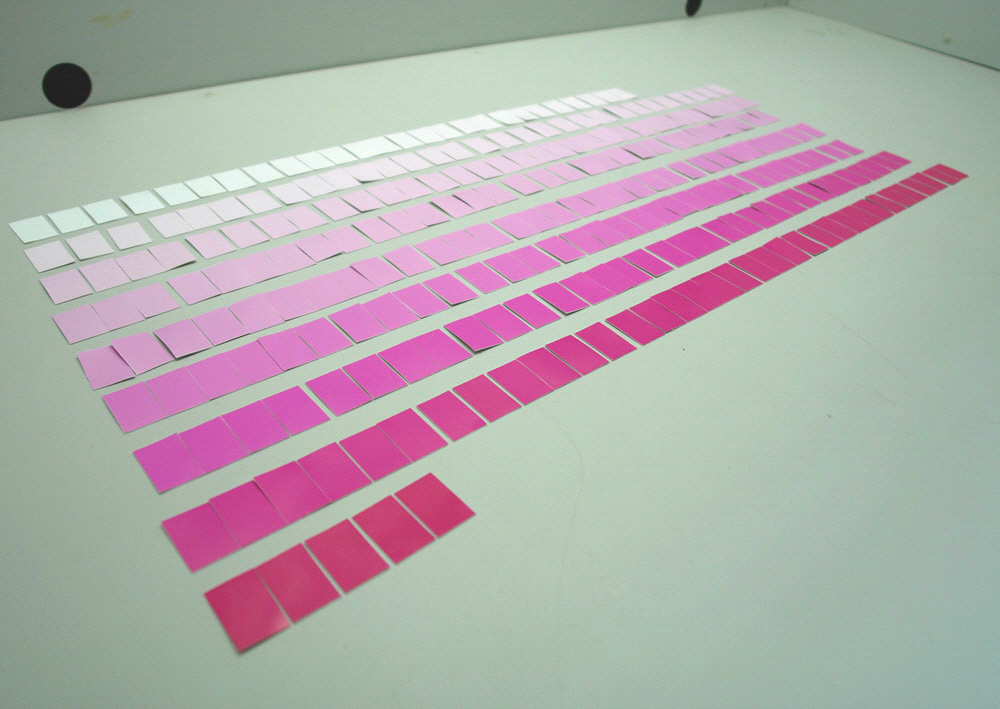
Single color scale samples for magenta used in a current study is shown in Figure 2. Note that a step size of each color scale was manufactured to have a width of 20 mm and a height of 30 mm.
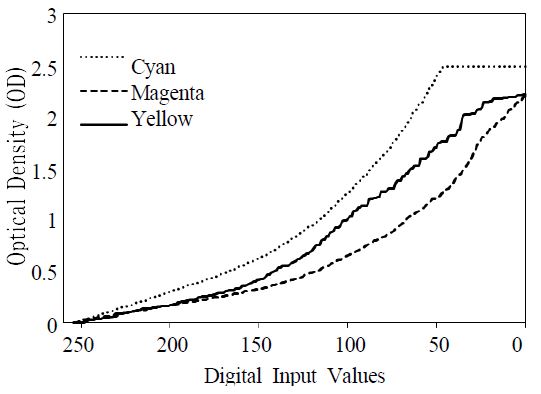
Tone reproduction curves (TRCs) between the digital input values and measured OD are shown in Figure 3. The cyan scale was tone-clipped in digital input value of red from 0 to 50 and those colors were excluded in psychophysical assessments. In addition, OD of some colors were not different from their adjacent colors and so were also eliminated;therefore the number of test color samples used in psychophysical assessments can be 405 including 148 for cyan,145 magenta and 112 for yellow.
3.2. Instrumental Measurements
A GretagMacbeth light booth was used to illuminate the test samples. D50 standard light source was chosen as a reference
white when the test samples were measured by spectrophotometer(GretagMacbeth SpectroEye) and tested by human observers. [8]For the accuracy, repeatability of the SpectroEye was tested. Ten successive measurements of all of the test colors used in this study were performed every 10 seconds for evaluating the short-term repeatability of the spectrophotometer. OD difference between the ten successive measurements was constant to 0 and mean ΔE*ab unit was approximately 0.2.
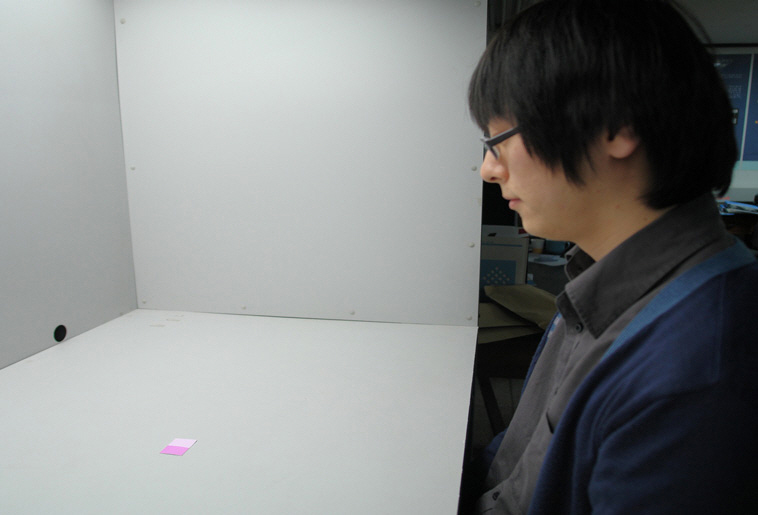
In this psychophysical experiment, the perceptibility and acceptability thresholds were measured using method of limits [9] under 45/0 viewing geometry as illustrated in Figure 4. Five observers with normal color vision were required to assess each of solid cyan, magenta and yellow color scales covering a maximum tonal range of the color printer in both ascending and descending directions. According to Ref [11], for an ascending series, the experimenter presents a stimulus, beginning with one that is certain to be imperceptible,and asks the observers to respond ‘yes’ if they perceive it and ‘no’ if they do not. If they respond ‘no’,the experimenter increases the stimulus intensity and presents another trial. This continues until the observer responds‘yes’. A descending series begins with a stimulus intensity that is clearly perceptible and continues until the observers respond ‘no’ ? that is, they cannot perceive the stimulus.Consequently, the thresholds are taken to be the mean values of both series in order to compensate for any adaptation effects. Similarly, the acceptability threshold can be measured by the accept/reject decisions [1] from the same observers.The average number of psychophysical assessments from a single observer was 2280, and 6866 respectively for perceptibility and acceptability cases; thus 45730 pairs were evaluated by 5 observers in total.
4.1. Perceptibility Thresholds
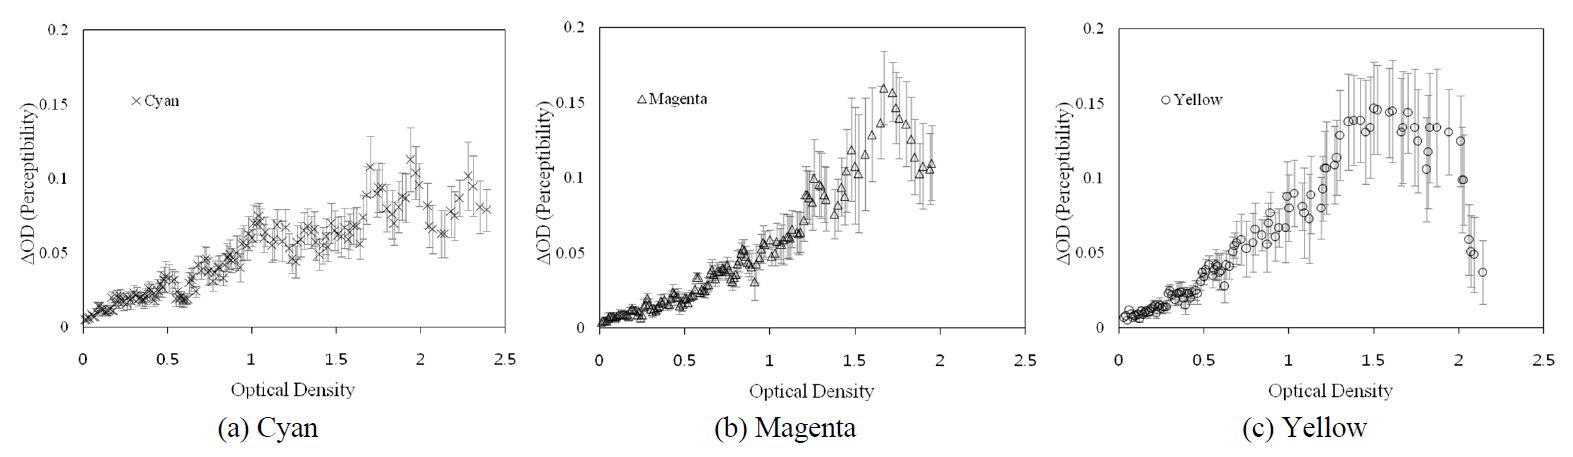
Figure 5 represents mean perceptibility thresholds in ΔOD unit for three color scales, cyan, magenta and yellow,
across the varying OD from low to high. Reproducibility of psychophysical experiment can be estimated from standard error bars which express deviations between observers’ experiment data. The perceptibility threshold in ΔOD unit sharply increases as the OD increases from low to high for the all colors. It is noticed that the human visual system responds more sensitively to the variation at the low-OD than high-OD fields. Moreover, it also confirmed that the ΔOD does not correspond with human visual perception.Magenta and yellow scales show a similar basic trend. The threshold gradually increases as OD increases from 0 to 1.5 OD, then it sharply decreases when OD increases to higher levels; therefore the curves appear to be bell shaped. However,for cyan, the bell shaped threshold function is not observed.The threshold fall-off was not measurable until the OD of 2.39. Density relies upon thickness of colorants used and on traversing the entire optical path so it does not account for any hue effects. However, color channel dependency was apparently observed for measuring ΔOD.
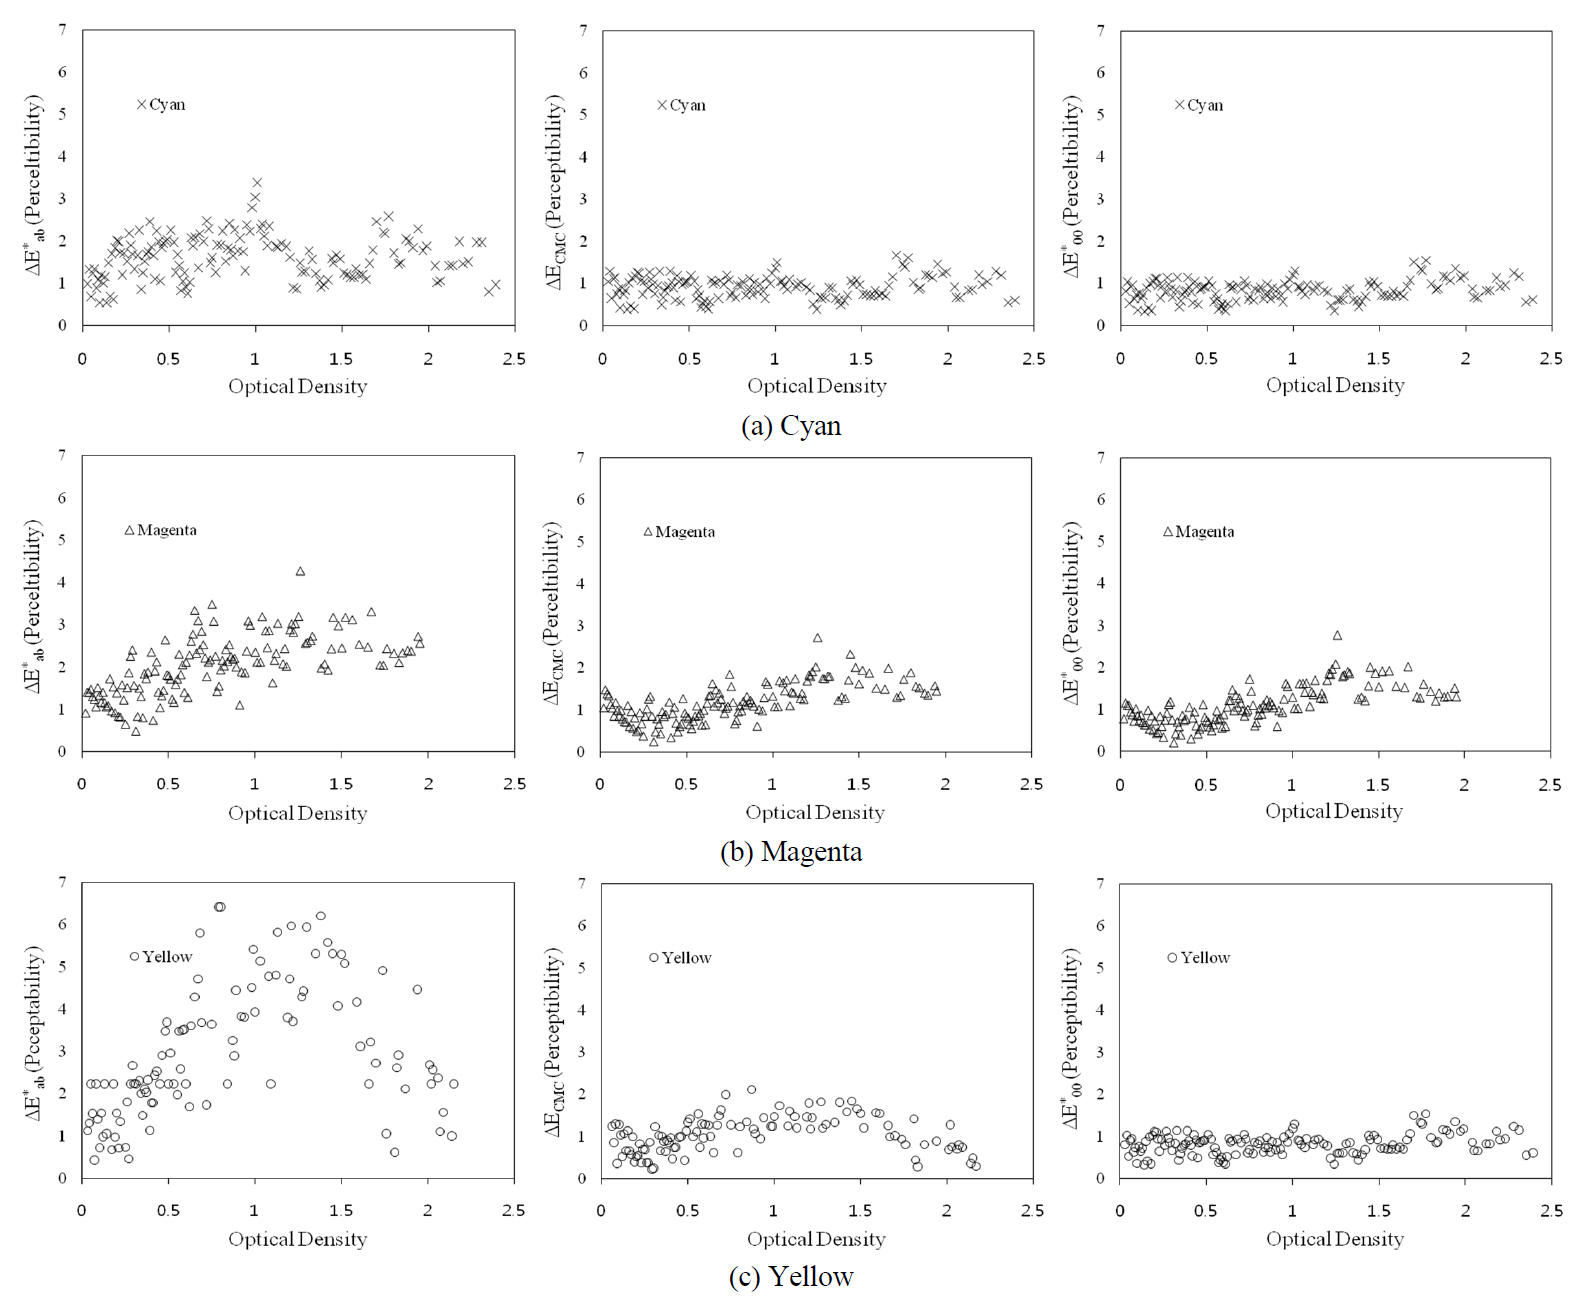
Figure 6 demonstrates the visually measured perceptibility thresholds in color difference models including ΔE*ab, ΔECMC(1:1), and ΔE00 for varying OD. The first color difference unit (ΔE*ab) fluctuated for all colors, but became stable at 1,when being defined in the rest (ΔECMC(1:1) and ΔE*00). Note:the CMC model parameters of 1:1 were used for computing perceptibility thresholds as discussed in Section 2.2.2. Consequently,ΔE*00 corresponds more to human visual perception compared to OD and ΔE*ab. In Table 2, minimum, maximum and average perceptibility thresholds defined in color difference model units along with their standard deviations are listed. Consequently, ΔECMC(1:1) and ΔE*00 correspond more to human visual perception compared to OD and ΔE*ab.The mathematical derivation of these color difference equations were previously given in Section 2.2.
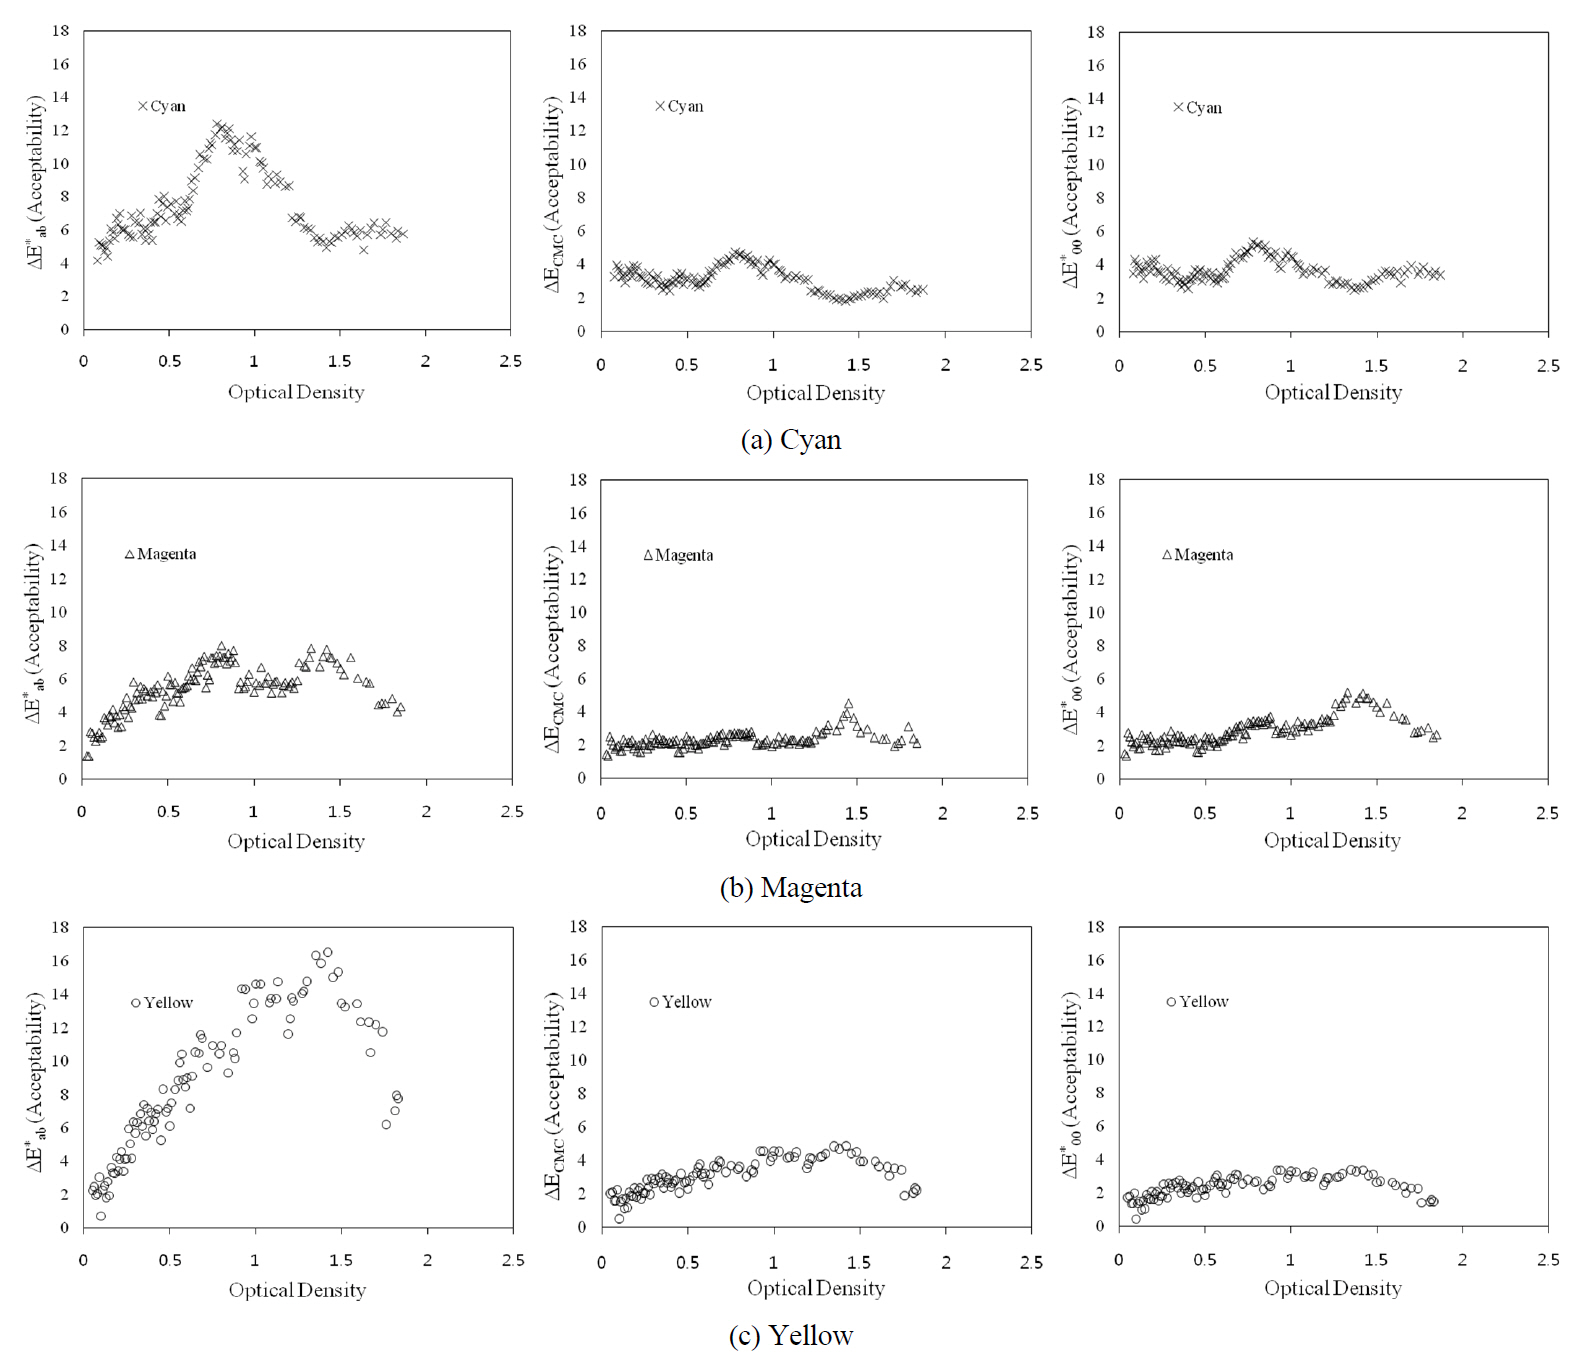
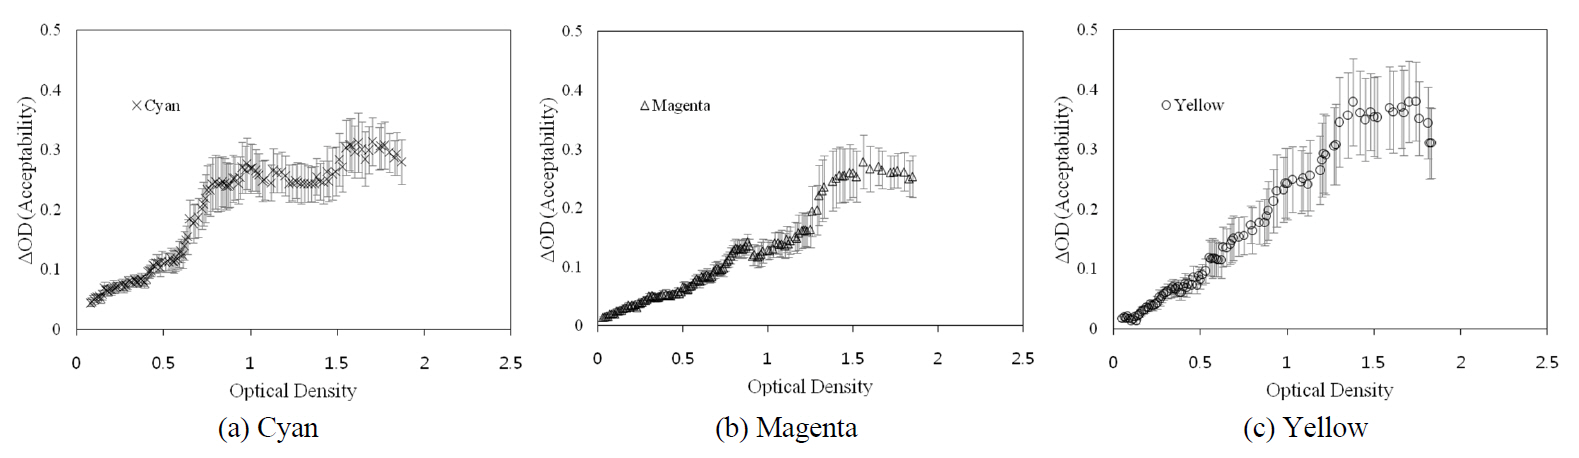
The acceptability threshold of OD which was visually measured for varying OD is shown in Figure 7. It provides the mean OD thresholds of both ascending and descending directions for cyan, magenta and yellow. The acceptability thresholds sharply increase as the OD increases in the low OD fields for the all colors. A slightly different trend was measured from the two different directions. Most threshold values for the ascending direction were higher than those of the descending direction. However, in both directions,the acceptability threshold increases as the OD increases in the low OD fields. Magenta and yellow scales show a similar basic trend. The threshold sharply increases as OD increases from 0 to 1.5 OD, then it was saturated when OD increased to higher levels. However, for cyan, it became constant at 0.3 from middle OD to high OD fields.Similar to the result for perceptibility threshold, channel dependency was also observed. Analogous to the previous section, performance of the ΔE*ab, ΔECMC(2:1), and ΔE*00 were evaluated with acceptability threshold data as illustrated in Figure 8. The first color difference unit (ΔE*ab) fluctuated for all colors, but it became stable to a value around 3,when being defined in the rest - ΔECMC(2:1) and ΔE*00. Note:the CMC model parameters of 2:1 were used for computing acceptability thresholds as discussed in Section 2.2.2. In Table 3, minimum, maximum and average perceptibility thresholds defined in color difference model units along with their standard deviations are listed.
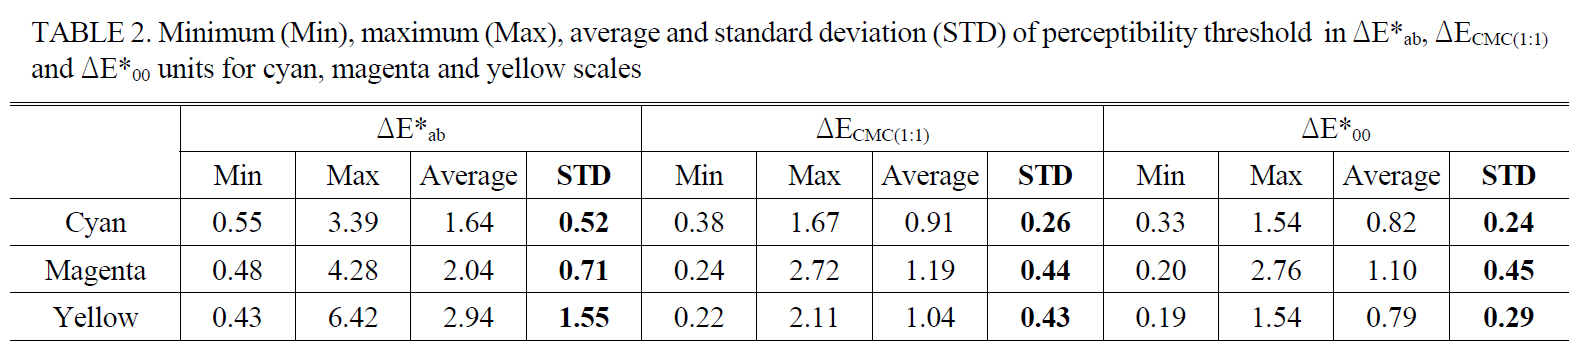
Minimum (Min) maximum (Max) average and standard deviation (STD) of perceptibility threshold in ΔE*ab ΔECMC(1:1) and ΔE*00 units for cyan magenta and yellow scales
In summary, the perceptibility and acceptability thresholds
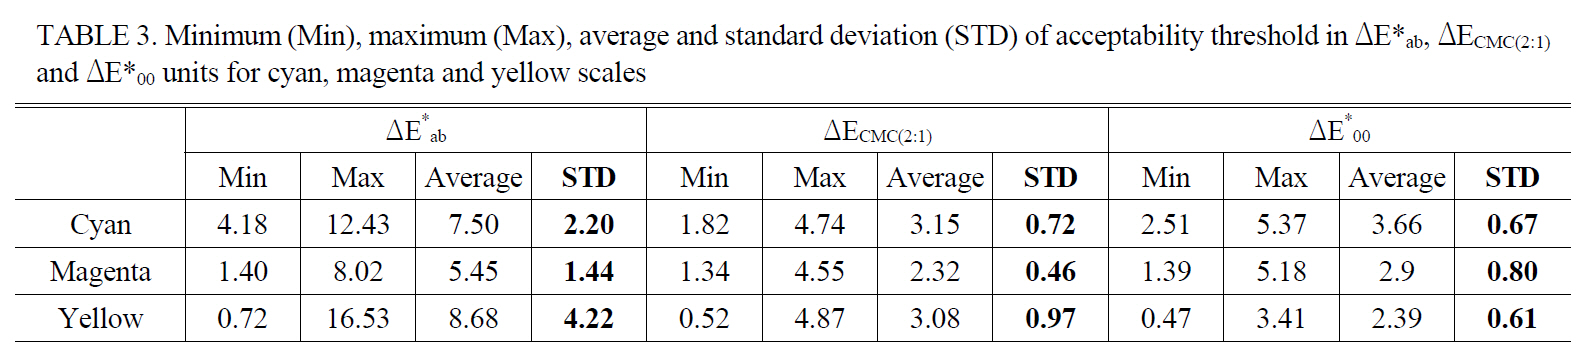
Minimum (Min) maximum (Max) average and standard deviation (STD) of acceptability threshold in ΔE*ab ΔECMC(2:1) and ΔE*00 units for cyan magenta and yellow scales
across the reflection OD domain were psychophysically measured using the method of limits. The former steadily increases as the OD increases from the low to high density fields and it rapidly decreases at higher density fields. For the latter, the threshold sharply increases as OD increases from 0 to 1.5 OD then it was saturated when OD increases to higher levels. Density relies upon the amount of ink used and traversing the entire optical path so it does not account for any hue effect. Furthermore, performance of three widely used color difference models, ΔE*ab, ΔECMC(l:c) and ΔE*00 were evaluated using our threshold results. The threshold in ΔE*ab unit fluctuated, but it become stable for the others (ΔECMC(l:c) and ΔE*00) for all colors. Consequently,the recent models such as ΔECMC(l:c) and ΔE*00 appear more to correspond to human visual perception compared to OD and ΔE*ab. In future study, effects of viewing conditions such as viewing distance and surround luminance [10] on threshold perception of the visual system should be investigated in order to further extend the results.