In recent years, non linear optical (NLO) microscopy has been highlighted for visualizing the morphological details of living tissue which cannot be resolved by ultrasound or magnetic resonance imaging. NLO microscopy utilizes the signal from two-photon excitation fluorescence (TPEF) [1-5],second harmonic generation (SHG) [6-7], sum frequency generation (SFG) [8-9], or coherent anti-Stokes Raman scattering (CARS) [10-15], which can be combined with other techniques such as CARS microscopy with TPEF and SFG microscopy [11, 13]. That’s why the combined(or multimodal) microscopy can visualize the sub-cellular complex structures which cannot be resolved well by single NLO microscopy. Different NLO imaging methods each have their distinctive advantages [13]: TPEF can be used to visualize proteins, ions with fluorescent labeling or specific auto-fluorescent structures; SHG and SFG are selective to non-centrosymmetric molecular assemblies such as collagen fibrils; and CARS is naturally sensitive to lipidenriched structures such as adipocytes. CARS microscopy is a more desirable tool compared with other microscopy,because it allows label-free strong vibrational imaging. So, a multimodal NLO imaging system is preferably constructed based on CARS scattering microscope.
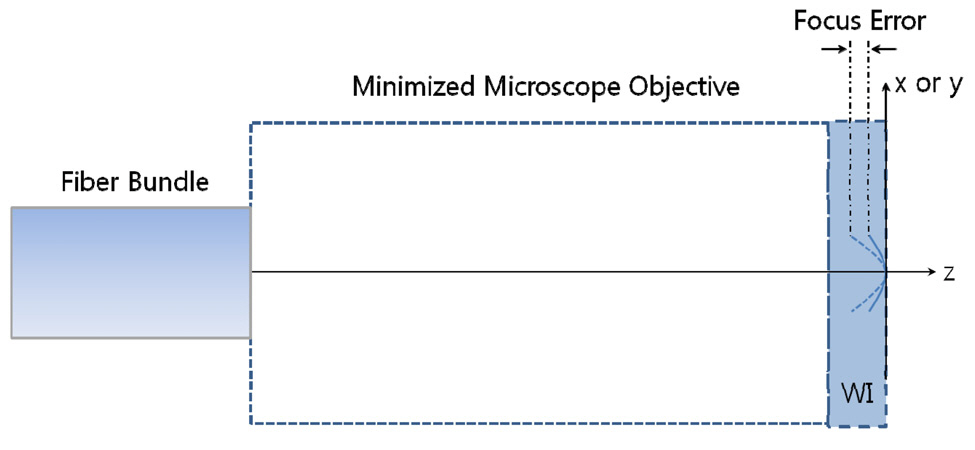
In order to generate CARS signal, we have to use two laser pulses with frequencies of ωp for pump beam and ωs for Stokes beam. So to speak, CARS signal is generated efficiently in a collinear excitation geometry with tight focusing and without time delay between pump (ωp) and Stokes beam (ωs). If the frequency difference, ωp-ωs, matches molecular-specific frequency resonantly, a blue-shifted and intense CARS signal is emitted at ωAS = 2ωp-ωs. From this CARS signal, three dimensional label-free images are obtained with sub-micrometer resolution [10-15]. In CARS microscopy reported until now, conventional microscope objectives are used, so that they are limited for introduction into a living body. Gradient-index (GRIN) lenses might be a solution to embody in-vivo catheter [1-5, 16-18]. However, due to the inherent large amount of chromatic aberration, GRIN lenses cannot be utilized to focus two pulses with frequencies of ωp and ωs at a point. In order to insert CARS imaging catheter into a living body with minimal invasiveness,we need a miniaturized objective lens system like GRIN rod lenses without focus error and deviation for pump and Stokes beam. We will discuss the design of a miniaturized objective lens system joined with an imaging fiber bundle in the following sections.
II. THE STUDY FOR DESIGN REQUIRMENTS
2.1. Tight focusing and wavelength
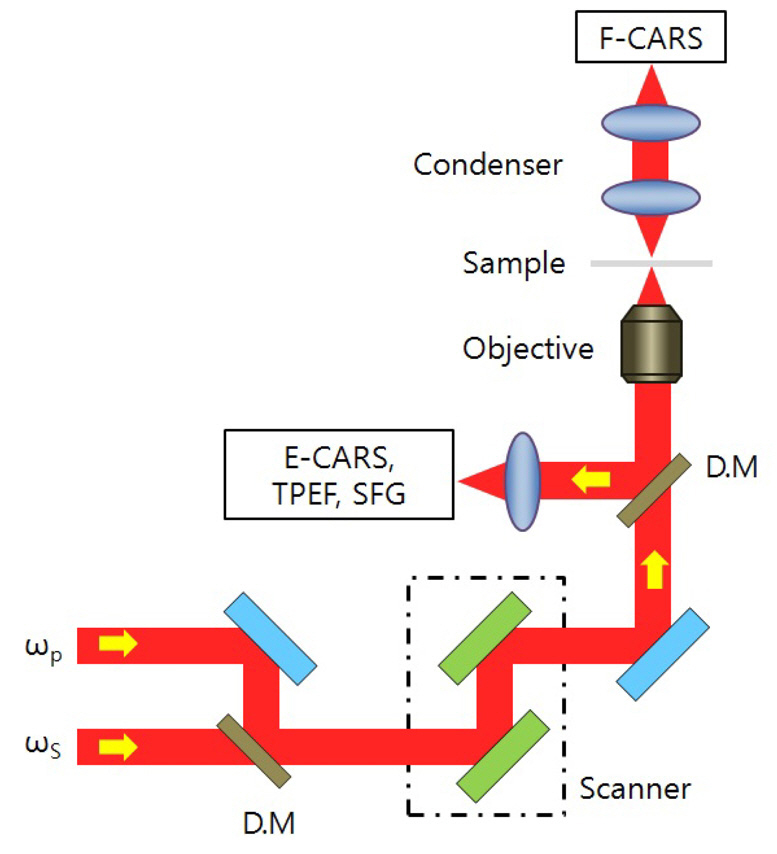
A typical schematic diagram of a laser scanning CARS(coherent anti-Stokes Raman scattering) microscope is presented in Fig. 1. As shown in Fig. 1, two pulses with different wavelengths are synchronously focused inside the sample, and then transformed to scattering light signals to visualize the morphological details such as forward-detected CARS (F-CARS), epi-detected CARS (E-CARS), two-photon excitation fluorescence (TPEF), and sum frequency generation(SFG) signals [11].
From the viewpoint of optical design, two pulses for pump(ωp) and Stokes (ωs) beam have to be concentrated to a common focus with a chromatic aberration-free condition.In fact, CARS signals are related to the induced third-order polarization [19-20],
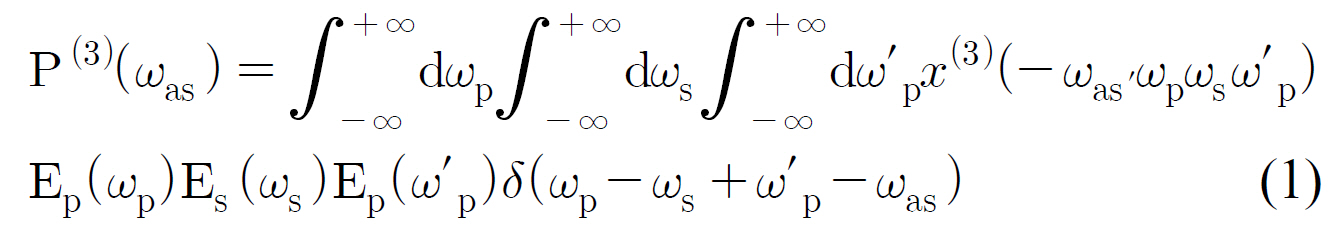
where Ep(ωp) and Es(ωs) are the electric fields for pump and Stokes beams and Ep(ω'p) is the second interaction with the pump beam in CARS process. The delta function means that the integration satisfies the condition ofωas = ωp - ωs + ω'p. And the intensity of CARS signal can be expressed as
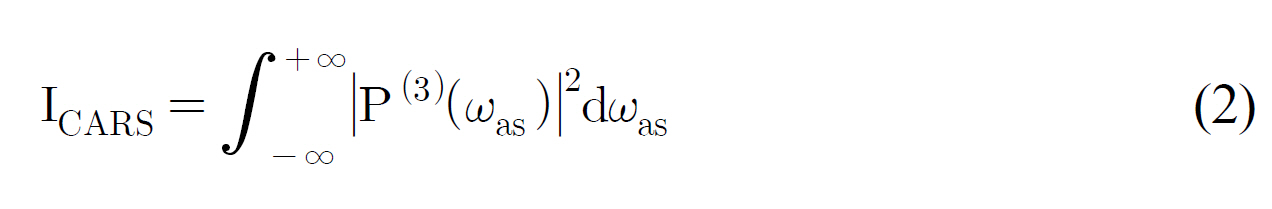
From Eq. (1) and Eq. (2), it can be known that CARS signal is proportional to the second power of pump beam intensity(Ip 2) times the first power of Stokes beam intensity (Is).Therefore, CARS objective lens system should satisfy diffractionlimited performance and chromatic aberration-free condition to focus two different wavelength pulses into a point.
Meanwhile, in order to decide wavelengths of pump and Stokes beam, we refer the research of Conor L. Evans and co-workers [11]. They have used 817 nm for pump beam and 1064 nm for Stokes beam to obtain a combined CARS and TPEF tissue image. Since we expect multimodal non linear optical (NLO) imaging based on CARS microscope,we set design wavelengths to 817 nm and 1064 nm.
2.2. Numerical aperture and clear aperture
Numerical aperture is used to specify the light-gathering power of an optical system, which can be expressed at object space (fiber side) or image space (sample side) [21].The amount of CARS signal captured by an optical system is proportional to the square of numerical aperture at sample side (NA2 S) and optical resolution is proportional to the first power of numerical aperture (NAS).
Therefore, in order to decide on an appropriate NAS, we refer to the research of H. Wang and co-workers [17].They have used the conventional microscope objective with needle-like bill, namely the MicroProbe Objective(MPO) lens from Olympus Inc. with an outer diameter of 1.3 mm and 0.5 NAS for water immersion. Additionally,from the Olympus website, we could also find another type of MPO lens with an outer diameter of 3.5 mm and 0.7 NAS. Hence, we can decide design requirements for numerical aperture and clear aperture reasonably: NAS will range from 0.5 to 0.7 for water immersion; since we will use a fiber bundle with an outer diameter of 0.7 mm and an acceptance numerical aperture of 0.35, the diameter of clear aperture (CA) will range from 0.7 mm to about 2.5 mm.
2.3. Field of view and magnification
The previously mentioned MPO lens has field of view of 220 ㎛ at sample side (FOVS) and an outer diameter of fiber bundle of 700 ㎛ (0.7 mm). And many of reported CARS papers show that image areas are about 75㎛ or 100 ㎛ wide [13-14, 17, 20]. Therefore, if we set FOVS to 220 ㎛, magnification (M) will be 0.314 (=220/700). From geometrical optics, magnification (M) equals the ratio of numerical apertures (NAF/NAS), so that NAF will range from 0.16 to 0.22. Conclusively, we can confirm the consistency of design requirements that a fiber bundle with an acceptance sine angle of 0.35 makes the CARS signals pass into each of the fiber cores, namely 30,000 fiber cores .
2.4. Telecentricity and working distance
In a telecentric system, one or both pupils are located at infinity and the principal ray enters or leaves the system parallel to the optical axis [21]. In order to maximize the amount of light returned from epi-detected CARS into 30,000 fiber cores, we need to keep telecentricity at the fiber side.
The previous MPO lens has the working distance of 200㎛ which may not be optimized for CARS microscopy. In comparison, usual GRIN lenses have the working distance of tens of micrometers and will suffer less from sample scattering. Note that, in order to make an appropriate amount of scattering signals, working distance has to be determined carefully in epi-detected CARS imaging. If we refer to the previous mentioned Evans’s study [11] in which CARS tissue imaging is seen up to the depth of 100 ㎛, we can set working distance to 100 ㎛.
CARS imaging catheter has to move freely without restriction inside blood vessels. In order to achieve this free movement, we need to minimize total track length(TTL) from object to image. From the research of K.Carlson and co-workers for in-vivo fiber-optic confocal reflectance microscope with an injection-molded plastic miniature objective lens [22], we can get information about TTL which is 17.5 mm or 20 mm. Therefore, it is reasonable to set the requirement of TTL between 10 mm and 20 mm.
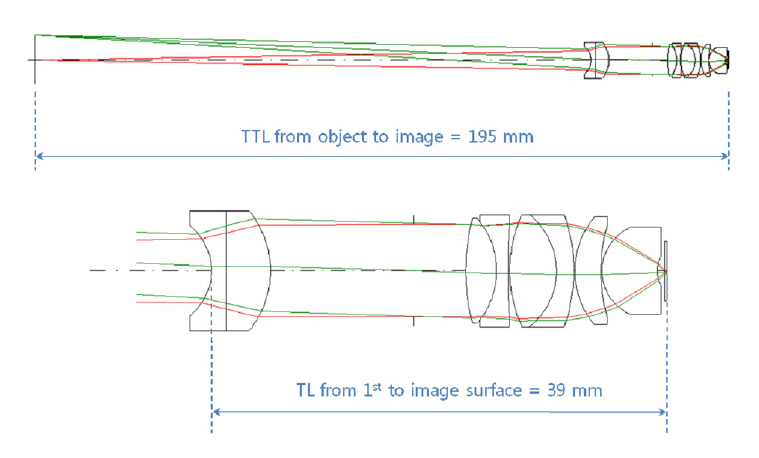
To satisfy the design requirements of section II, we need initial lens data and strategies. As an initial data[22-24] for optimization, we present the usual microscope objective with magnification of 40 X and NAS of 0.7 at Fig. 2. This lens system also has effective focal length(EFL) of 4 mm and an aperture diameter of 8 mm. Note that total track length (TTL) from object to image is 195 mm but track length (TL) from first lens surface to image surface is only 39 mm. Then, in order to satisfy the requirements of total track length (TTL) and clear aperture(CA), we have to minimize TTL first. That’s why the minimized TTL leads the minimized CA. Here, we use an idea which inserts one or two lenses between object and first lens surface, in order to reduce TTL of 195 mm down to one-tenth or one-twentieth. That’s why the lens(es)can collimate the laser beam leaving from the fiber bundle,
so that the lens system goes to the structure of minimized TTL. And we hope to move the aperture stop manually to different positions to fulfill the condition of telecentricity in the optimization process.
Because CARS (coherent anti-Stokes Raman scattering)is a nonlinear effect which is proportional to the square of induced third-order polarization, the signal is generated only at a focal point. Therefore, CARS objective lens system has to satisfy diffraction-limited performance and chromatic aberration-free condition for pump beam of 817 nm and Stokes beam of 1064 nm. To reach the aberration-free conditions, we will find various kinds of glass pairs through the optimization process for each doublet. And we make up a merit function (ψ) which is composed of the square sum of error functions (


where wi, ei, and ti denote the weighting factors for the algorithm of damped least square, aberration error, and target value respectively (usually zero value for aberration error).Fi, Wi, Ri denote field, wavelength, and ray. Δxi and Δyi denote transverse ray aberration on image plane in which z is the optical axis. First, in order to minimize merit function(ψ), we focus on the correction of Seidel third-order aberrations,first-order axial and lateral chromatic aberration, chromatic spherical aberration, and chromatic coma aberration [25].That’s why we know from a design knowhow that Seidel third-order aberrations and first-order chromatic aberrations are most important for diffraction-limited performance.And then we proceed to the optimization process with the correction of a general ray following Snell’s law. In general ray optimization, we permit the sample surface to have a curvature for correcting field curvature. That’s why a curved image surface is the most powerful and easiest way to correct an inherent field curvature aberration. This can be easily found at confocal reflectance microscopy or optical coherence tomography in which graded-index (GRIN)lenses are used for microscope objective [1-5]. Code-v of version 10.1 is used in optimization process.
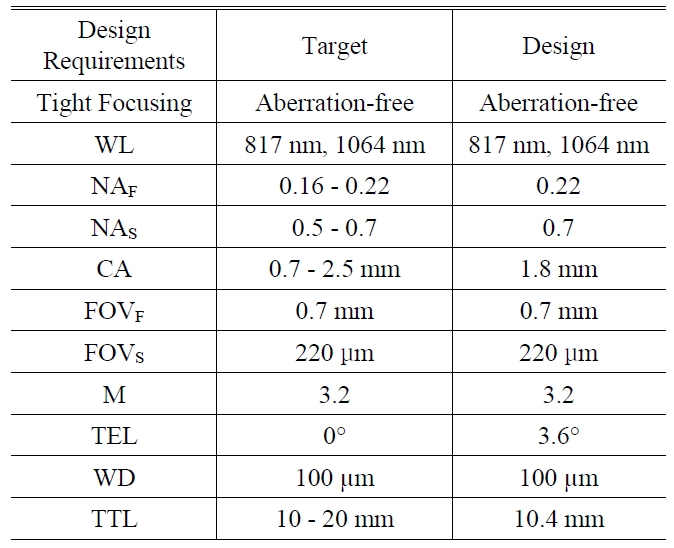
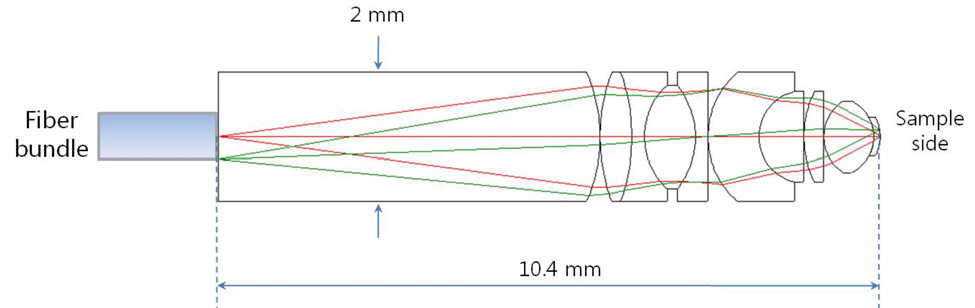
As a result, we present the miniaturized microscopic optical system for CARS imaging catheter with fiber bundle in Fig. 3 and summary table for design requirements in TABLE 1. We can confirm that all the predefined design requirements are satisfied. In section IV, we will discuss optical performance successively.

The summarized data for design requirments. WL denotes wavelength NAF and NAS denote numerical aperture at fiber side and sample side CA denotes the diameter of clear aperture FOVF and FOVS denote field of view at fiber side and sample side M denotes system magnification TEL denotes telecentricity which is defined by the angle between principal ray and optical axis WD denotes working distance and TTL denotes overall length from fiber to sample.
IV. OPTICAL PERFORMANCES AND DISCUSSION
We know that the most important thing is to get rid of monochromatic and chromatic aberrations, because coherent anti-Stokes Raman scattering (CARS) signals are generated only at a focal point and proportional to the third power of laser beam intensity, namely Ip 2 times Is. The image quality is shown in Fig. 4 for tangential (yz) and sagittal planes(xz). Before judgment of the image quality, we need to derive a key criterion for optical performance. The most frequently preferred criterion is the radius of the Airy disk which decides whether an optical system is diffractionlimited from what the transverse ray aberrations are inside the disk or outside. It is known that the radius of the Airy disk (R) can be calculated simply from Eq. (7) [21],
where, λ denotes wavelength and NAS denotes the numerical aperture at the sample side. For pump beam of 817 nm, R equals 0.71 ㎛. For Stokes beam of 1064 nm, R equals 0.93 ㎛.
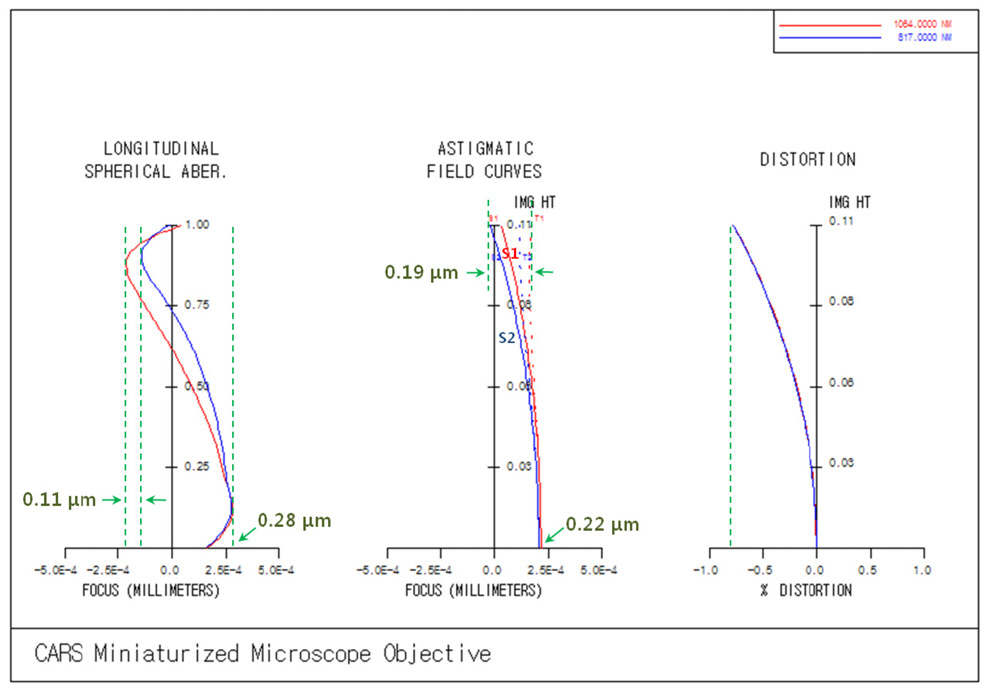
Then, let’s look at the image quality for three different types of chart [21, 23]. First, longitudinal spherical aberration(LSA) represents the difference of focus position according to on-axis rays leaving from the center point of the fiber bundle through different heights of entrance pupil. In LSA chart, 0.0 of horizontal axis means a reference imaging point, namely the best imaging point, on optical axis and 1.0 of vertical axis means the normalized height of entrance pupil. LSA chart shows that the maximum focus error is +0.27 ㎛ for pump beam of 817 nm and +0.28
㎛ for Stokes beam of 1064 nm. And the maximum focus deviation between pump and Stokes beam is given to only 0.11 ㎛. These let us know that on-axis monochromatic and chromatic focuses are corrected perfectly. Second, astigmatic field curve (AFC) represents focus loci made by sequential off-axis points corresponding to the heights of the fiber bundle. Refer to Fig. 5. In Fig. 4, T1 or S1 means the curved focus loci of tangential plane (yz) or sagittal plane(xz) for Stokes beam of 1064 nm and T2 or S2 means for pump beam of 817 nm. AFC chart shows that the maximum focus deviation between pump and Stokes beam is given to be 0.19 ㎛ at the end of the image height. These also let us know that AFCs are corrected perfectly just like in LSA chart. Third, a data point on the distortion curve represents a position error between the center point of distributed rays on the curved image surface left from an object point and a reference point by magnification relationship.The important thing is to check the difference of the center point between pump and Stokes beams on the curved image surface. As shown in the distortion curve,there is no deviation, almost 0.005 % at the end of image height, which means the difference of 0.02 ㎛ from the definition of distortion [21],
where, H'p denotes the intersection height of principal ray through the center of the entrance pupil on sample plane and h' denotes the paraxial image height from the same object point. As a result, we can summarize that the designed optical system has the coincidence of focus points for pump and Stokes beam. In order to describe in detail, we will treat the performances further for such factors as spot diagram and point spread function.
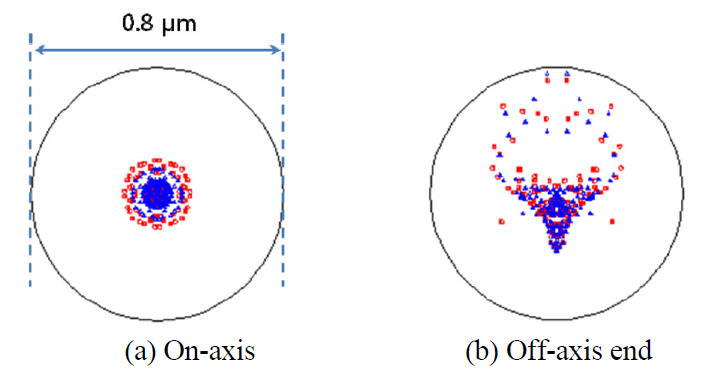
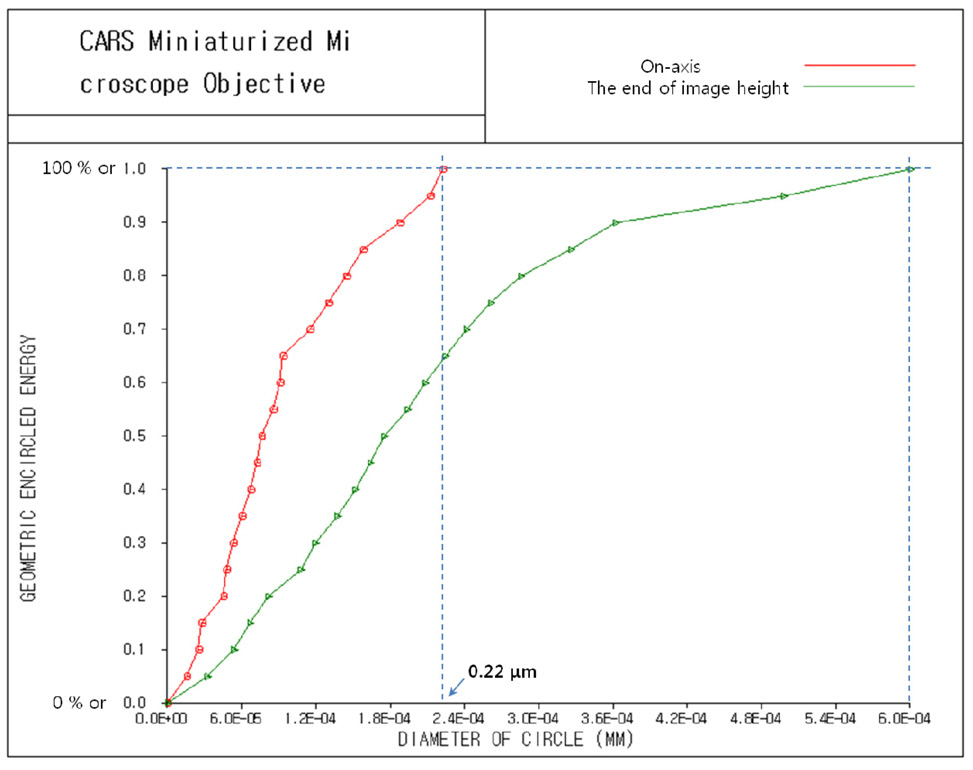
Spot diagram and geometric encircled energy [21, 23]are presented in Fig. 6 and Fig 7. From Fig. 6 with the scale bar of 0.2 ㎛, we can ensure the degree of coincidence for spot distributions between pump and Stokes beams. And from Fig. 7, we can see that the 100 % of encircled energy corresponds to diameter of circle of 0.22㎛ for on-axis and 0.60 ㎛ for the end of image height,
namely 0.11 mm or 110 ㎛. This means perfect diffractionlimited performance if we remember that the radius of the Airy disk equals 0.71 ㎛ for pump beam of 817 nm and 0.93 ㎛ for Stokes beam of 1064 nm.
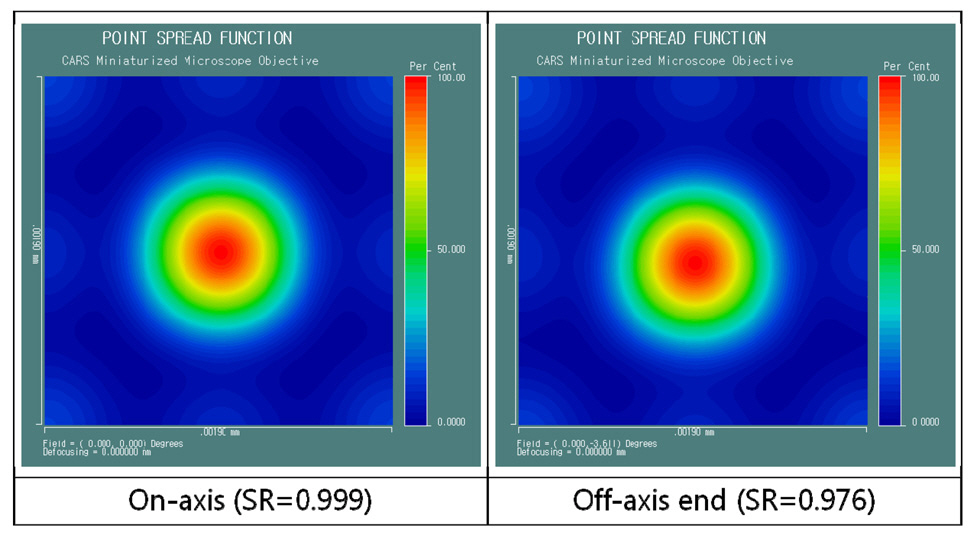
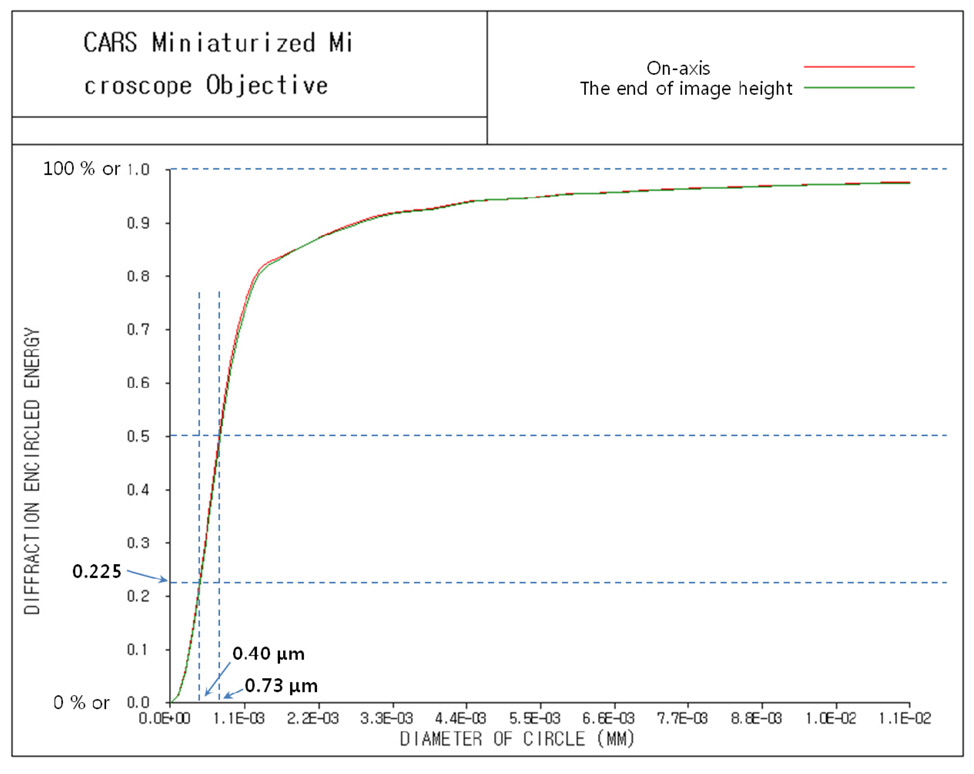
Fig. 8 and Fig. 9 show point spread function (PSF) and diffraction encircled energy [21, 23]. In Fig. 8, we can see aberration-free PSFs with Strehl ratio of 0.999 for on-axis and 0.976 for the end of image height. And, unlike Fig. 7,we can see that the diameter of the circle approaches infinity for the 100 % of encircled energy in Fig. 9. That’s why PSF computes the characteristics of the image of point object (source) including the effects of diffraction. Since CARS intensity signals are treated at FWHM (full width at half maximum) which corresponds to the diameter of circle at 50 % encircled energy [10-15, 21], we can say that FWHM is to be 0.72 ㎛ for on-axis and 0.73 ㎛ for off-axis end. However, CARS signal is actually proportional to the third power of laser beam intensity, namely Ip 2 times Is. Therefore, if we take FWHM for the cube of PSF, we can say that FWHM is to be sub-micrometer
resolution of 0.40 ㎛ for both on-axis and off-axis end.
In order to design the miniaturized microscope objective for coherent anti-Stokes Raman scattering (CARS) imaging catheter with a fiber bundle, we have first investigated the design requirements such as tight focusing, wavelength,numerical aperture, clear aperture, field of view, magnification,telecentricity, working distance, and overall length.From the study of these design parameters, we could build successful design strategies and proceed to optimization to satisfy diffraction-limited performance without focus deviations between pump and Stokes beam. Conclusively, we could present the miniaturized microscope objective for CARS imaging catheter with NAS of 0.7, clear aperture of 1.8 mm, and TTL from object to image of 10.4 mm.
Additionally, we can say that the criteria of optical evaluation for the design of CARS optical system are established from this paper.