After the invention of EDFAs, data transfer capacities of optical communication systems exploded based on wavelength division multiplexing (WDM) systems [1]. Then more demands for higher capacity systems, in addition to the progress in optical device technology, encouraged the researchers to focus on the multi-wavelength pump FRAs which have broader bandwidths [2]. Hybrid EDFA/FRAs could have the benefits of both EDFAs and FRAs, hence some efforts have been carried on to offer efficient constructions for hybrid EDFA/FRAs [3]. Hybrid EDFA/FRAs have long lengths and consequently lower numbers of link repeaters are needed. To build these hybrid amplifiers, low price EDFAs are used. Their costs are relatively lower than FRAs and their noise figures (NFs) are lower than those of the EDFAs [2]. A WDM system with hybrid EDFA/FRAs has lots of elements and the combination of these elements and the value of their parameters are of great importance. The module combination is the art of engineering work. But choosing the module parameters could be difficult,because these parameters affect the characteristics of the hybrid EDFA/FRAs. Here, a global optimization method (GOM)is quite necessary. GOMs help us to find the optimum values for parameters of the modules. PSO is a GOM that is effective and fast and can deal with a high number of variables [4, 5]. Using PSO, the parameters of the EDFA and FRA used in hybrid EDFA/FRA have been optimized to obtain a wideband gain flattened amplifier. In this paper,hybrid EDFA/FRA configurations are introduced, the method of simulation of hybrid EDFA/FRA is discussed and then PSO is presented and the results of optimization are given for different pumping schemes and configurations. In addition to optimization of the length, Er3+ concentration, and pump power and wavelength of the EDFA and also pump powers of the FRA all of which have been carried on in our previous work [6], the pump wavelengths of the FRA are optimized in order to have a flatter-gain hybrid EDFA/FRA. Adding the pump wavelengths of the FRA to the other optimization variables increases the number of optimization variables to 24 in the 10 pumped FRA hybrid EDFA/FRA.Dealing with this high number of variables is quite a challenge. Here PSO shows its strength to manipulate a large number of variables in a fast and straightforward manner in comparison with the other optimization methods such as genetic algorithm (GA) [7-14]. The results are discussed in section V.
II. HYBRID EDFA/FRA CONFIGURATION
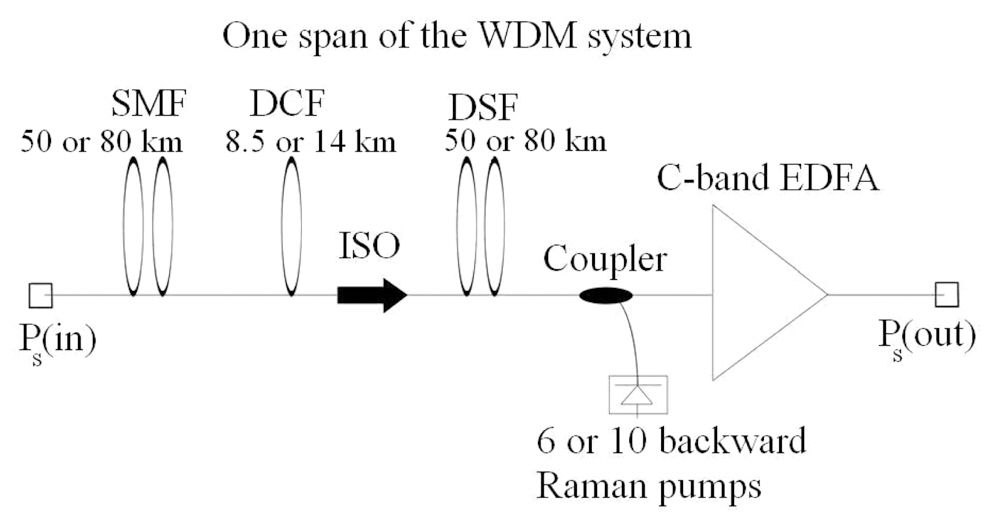
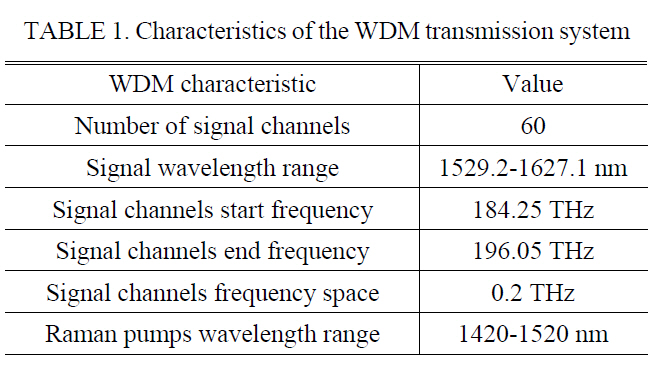
FIG. 1 depicts the configuration which we have chosen for the hybrid EDFA/FRA. There are 60 signal channels with frequencies between 184.25 and 196.05 THz, placed equally in 200 GHz of frequency distances launched to the single mode fiber (SMF). SMF allows the propagation of only one mode, retains the fidelity of each light ray and has higher bandwidths over longer links. TABLE 1 presents the characteristics of the designed WDM system. If we utilize communication systems with the rate of 40 Gbit/s at each of these channels, the capacity of this WDM link could reach 2.4 Tbit/s. Choosing the values of the input signal powers is of great importance and will affect the gain spectrum variations of the amplifier. We select the input signal powers to be 1 or 10 mW to have a comparison
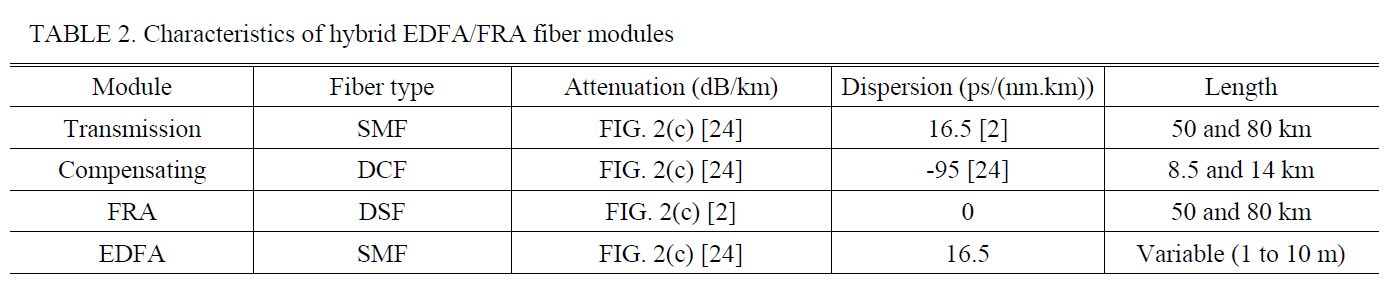
between the results. Here, SMF acts as the transmission medium. A dispersion compensating fiber (DCF) is located after the SMF to compensate the dispersion that took place in the SMF. DCF has a high negative value of dispersion which is supposed to neutralize the SMF lower positive value of dispersion. So, shorter length of DCF compared to the length of SMF is needed and the length of DCF must be chosen appropriately. Afterward, a dispersion shifted fiber (DSF) is placed which has zero dispersion at 1550 nm wavelength and is pumped by 6 or 10 backward pump LD sources which acts as an FRA. FRA pump powers are propagated counter to the direction of the signal powers. In this paper, we have chosen 2 different sets of fiber lengths. Accordingly, SMF, DCF, and DSF could be 50, 8.5, and 50 km in the first configuration and 80, 14,and 80 km in the second configuration, respectively. An isolator (ISO) is laid between the DCF and DSF to suppress the residue of the FRA backward pumps and noise, raised in the DSF. A WDM coupler is set up to couple the power of pumps to the DSF in the counter-propagating direction. Pump powers and wavelengths are chosen through the optimization process discussed in section IV. Next module is a C-band EDFA. Principal range of amplification in the C-band EDFA is 1530-1570 nm and its gain falls at wavelengths over 1570 nm. On the other hand, the amplification at the higher range of 1570-1630 takes place mostly through the DSF as an FRA. TABLE 2 lists the characteristics of different modules used in our hybrid EDFA/FRA configurations.Lots of variables exist in the design of EDFA. In this paper we have chosen 4 of the most important variables to be optimized, the length, the Er3+ concentration, the pump power and wavelength of the EDFA. Finally, we have a detector at the end of the link span to receive the output powers. Gain spectrum variations will be computed at this point. This span can be repeated if longer links are needed.As indicated, four different configurations have been proposed.These configurations are 108.5 or 174 km in length and each could adopt 6- or 10-pumped-FRA. Additionally, the amplifier characteristics are calculated in the cases of different input signal powers of 1 or 10 mW for each channel. As discussed in section V, gain spectrum variations of 1.794 dB can be achieved for the 174 km link span,10-pumped-FRA hybrid EDFA/FRA with 1 mW of input signal power.
[TABLE 1.] Characteristics of the WDM transmission system

Characteristics of the WDM transmission system
[TABLE 2.] Characteristics of hybrid EDFA/FRA fiber modules

Characteristics of hybrid EDFA/FRA fiber modules
[TABLE 3.] EDFA and FRA parameters used in the hybrid amplifier modeling
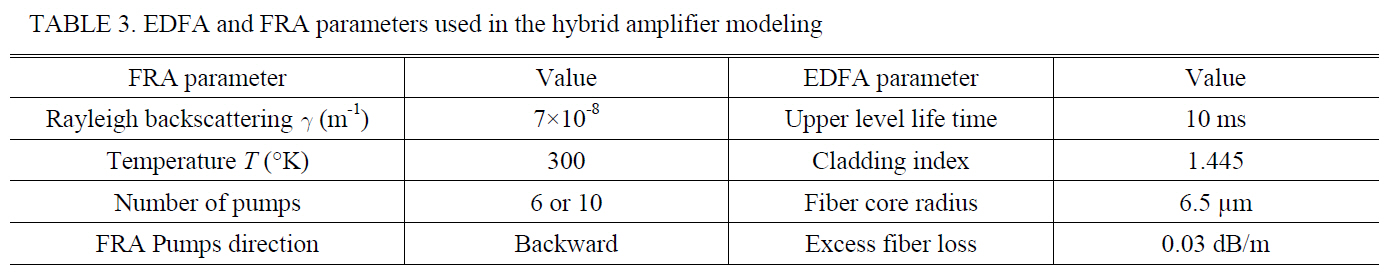
EDFA and FRA parameters used in the hybrid amplifier modeling
III. HYBRID EDFA/FRA SIMULATION
Simulation of EDFA and FRA should be done separately.Also, attenuation, dispersion and noise of the other components such as SMF, DCF, DSF, erbium-doped fiber (EDF), and ISO must be taken into account. Therefore, the simulation of hybrid EDFA/FRA has to be a combination of simulations of different modules and components of the hybrid amplifier.In the following sections we discuss the simulation of EDFAs and FRAs separately.
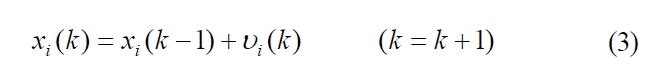
Since the EDFA pump is in the co-propagating direction,we need to solve an initial value problem. We ignore the counter propagating pumps and eliminate the backward amplified spontaneous emission (ASE) from our simulation to avoid solving the boundary value problem which is a bit more challenging. In this paper, a one-step predictorcorrector method [19] is used to simulate the EDFA.Using this method, the propagated powers at channels are calculated step by step using their values at the previous steps and their predicted values at the next steps [20].
The pumping wavelength is around 1480 nm. Step index fiber with uniform distribution of Er3+ ions are used in this simulation. EDFA characteristics which have been used are listed in TABLE 3.
We have used C++ programming to model the hybrid EDFA/FRA. The time needed to accomplish the simulation, depends
on the configuration of the setup. It could be 0.2 to 1 second when run by an AMD Athlon 2.71 GHz CPU with 1.00 Gb of RAM.
IV. PARTICLE SWARM OPTIMIZATION IMPLEMENTATION
PSO is a population-based stochastic method for solving optimization problems which is classified as a swarm intelligence technique. In this method, a population of particles which are bunches of variables that present candidate solutions,will be selected randomly from the possible solution space and these particles will move according to their social learning from each other toward the optimum solution.The rules and constraints which lead the flying particles in the search space toward the global optimized solution are originated from the behavioral models of bird flocks [4,5]. This method was introduced and developed by Kennedy and Eberhart [25, 26].
Let us assume that F is the fitness function. There are n particles Pi where
Step 1. Pis are randomly chosen from the search space to form the swarm P(k)
Step 2. Calculate the fitness values F(xi(k)) for each Pi.
Step 3. If F(xi(k))>Pbi, then Pbi=F(xi(k)) and xPbi=xi(k).
Step 4. If F(xi(k))max>Gb, then Gb=F(xi(k))max and xGb=xi(k).
Step 5. Set the new velocities
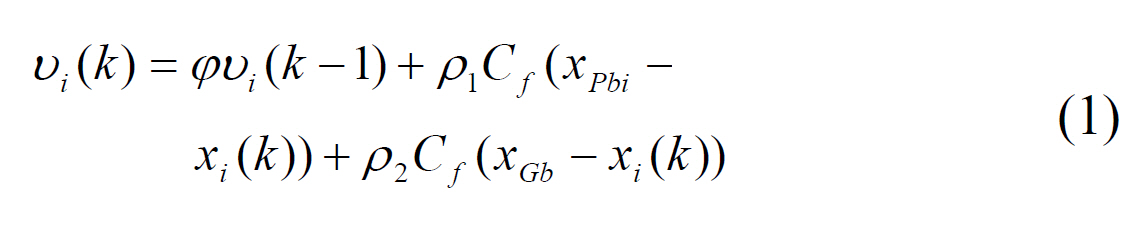
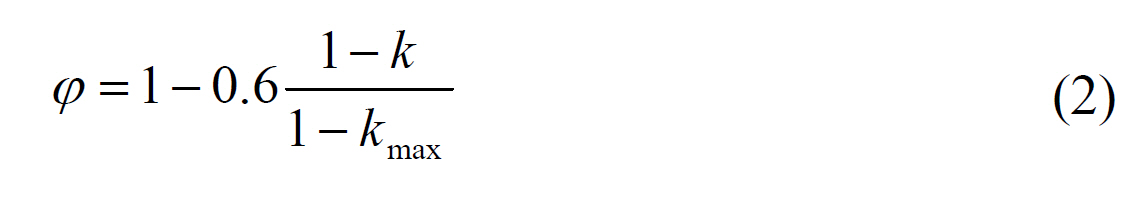
where
Step 6. Set the positions
Step 7. Check the convergence criterion, if fulfilled, the optimization is over, if not go to step 2.
To perform the optimization, PSO acts as the main program and the simulation of the hybrid EDFA/FRA will be the subprogram. Fitness function is the maximum signal network gain deviation from zero which is supposed to be minimum,formulated in the following:
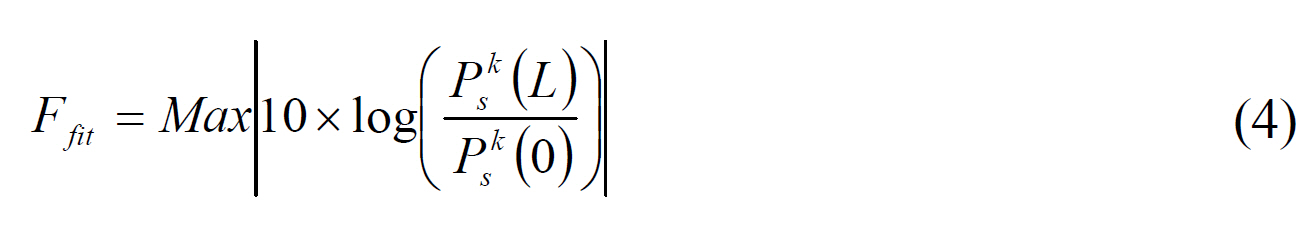
where
[TABLE 4.] Variables of the optimization of the EDFA/FRAsand their ranges
Variables of the optimization of the EDFA/FRAsand their ranges
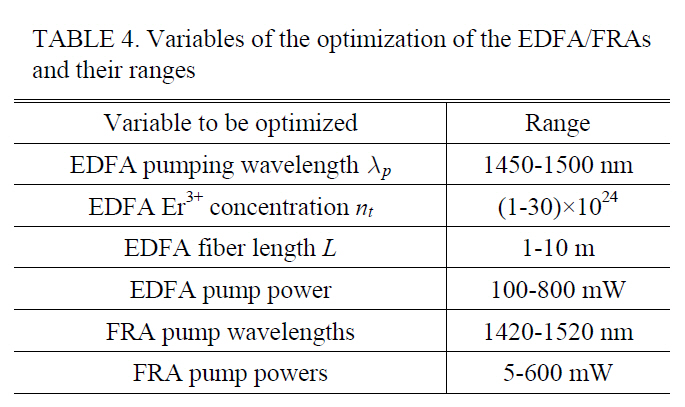
criteria, variables of optimization and their ranges in this work have been listed in TABLE 4. As it was mentioned,we used C++ programming to simulate the hybrid EDFA/FRA and execute the optimization process. The necessary time to accomplish one round of optimization depends on the configuration which is to be optimized and could be between 2 and 3 hours, by an AMD Athlon 2.71 GHz CPU with 1.00 Gb of RAM. The number of particles and iterations in our PSO model are 40 and 300, respectively.
In this paper we have simulated 4 different configurations for hybrid EDFA/FRA. Two configurations for 108.5 km and two for 174 km link with 6- and 10-pumped-FRA.Also, we survey the results for both input signal powers of 1 or 10 mW.
A group of optimization variables or the group of simulation inputs which are introduced in TABLE 4 are known as a particle
To reach the flattest gain spectrum for the hybrid EDFA/FRA, it is better to set the EDFA pump wavelength to have a C-band EDFA. Because of the shape of the EDFA gain spectrum, it is preferred to have amplification at lower wavelengths by EDFA and at higher wavelengths by FRA. In the optimization process, the EDFA pump power is inclined to attain high values. So, it is better to choose 1480 nm pumping wavelength for the EDFA,although it has higher noise compared to 980 nm ones.Also, in high power schemes it is more efficient to use 1480 nm pumping wavelength. The radius of the Er3+doped area at EDFA is equal to the radius of the fiber used as EDFA that is 6.5 ㎛. An EDFA with a small core radius will result in better gain spectrum characteristics,but its fabrication is hard and it is more susceptible to damage in facing high EDFA pump power. Also a small core radius EDFA is rare in the market. Er3+ ion concentration has to be chosen in a confined area, since low Er3+concentration would elongate the EDFA and consequently create higher variation of the gain spectrum. Also, high Er3+concentration will increase unfavorable intra- ion interactions[1]. The main source of noise of EDFAs is ASE. The level of noise in FRAs is lower than that in EDFAs. In this paper, we have assumed an acceptably low level for noise, and to speed up the optimization process, we have not simulated noises. Lower input signal power in EDFAs will result in higher and flatter gain spectra, but input signal power should not be so low that it could not be retrieved from the noise. The designed amplifier is a distributed amplifier, and it is better to define net gain for it. We prefer the signal powers at the end of the link to be the same as their values at the beginning of the link.So, the ideal net gain of our hybrid EDFA/FRA is zero.We have assumed the EDFA to be polarization independent as it almost is, but we consider the polarization dependency of FRA by including a factor in our simulations.
Amplification in the FRA is due to the nonlinear phenomenon of stimulated Raman scattering (SRS). By using a high number of pumps in FRAs with different wavelengths and powers, the gain spectrum is tailored and the EDFA gain variation is compensated. The amplification band can be chosen simply by adjusting the pump wavelengths at appropriate distances. The noise transition from pumps to signals occurs less in the counter-propagating pump scheme, hence it is more advantageous to place the pumps at the end of the FRA and increase the length of link span. We have to appoint the input signal powers to somehow avoid harmful interference with noise due to the low level of the input signal power, and unfavorable nonlinear effects due to the high level of the input signal powers.
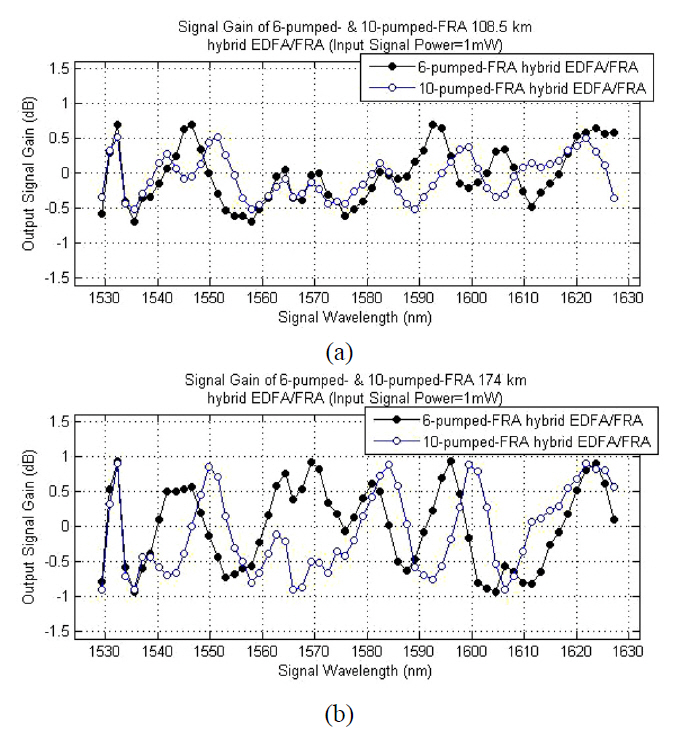
All the optimization results, obtained by PSO, for different schemes and configurations are given in TABLES 5-8. It is obvious that gain spectrum variations will be lower if we choose 10-pumped configurations instead of 6-pumped ones, or if we choose 108.5 km links instead of 174 km ones, and also if we choose 1mW of input signal power instead of 10 mW. As listed in TABLE 5, gain spectrum variations of 1.392 and 1.043 dB are attained for 108.5
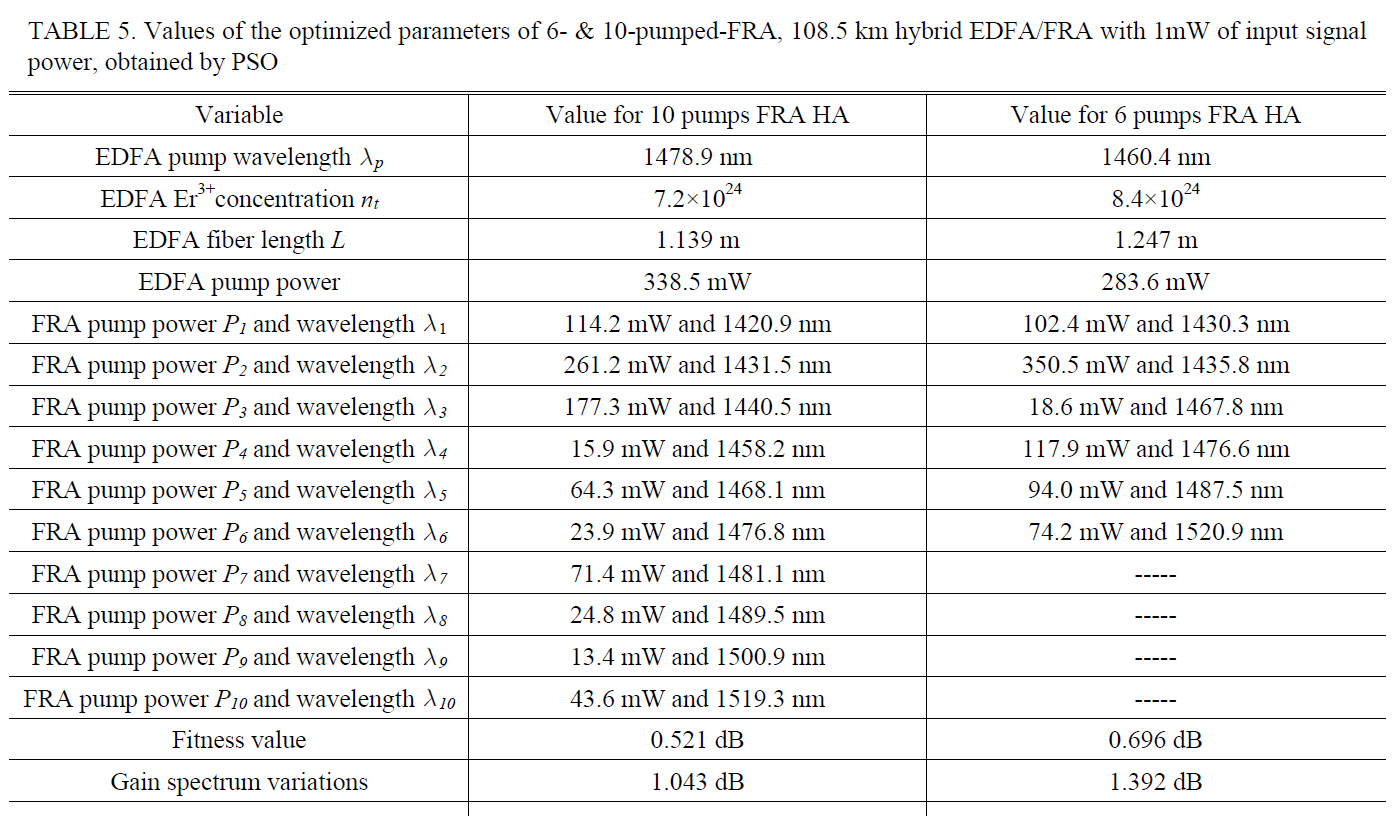
Values of the optimized parameters of 6- & 10-pumped-FRA 108.5 km hybrid EDFA/FRA with 1mW of input signalpower obtained by PSO
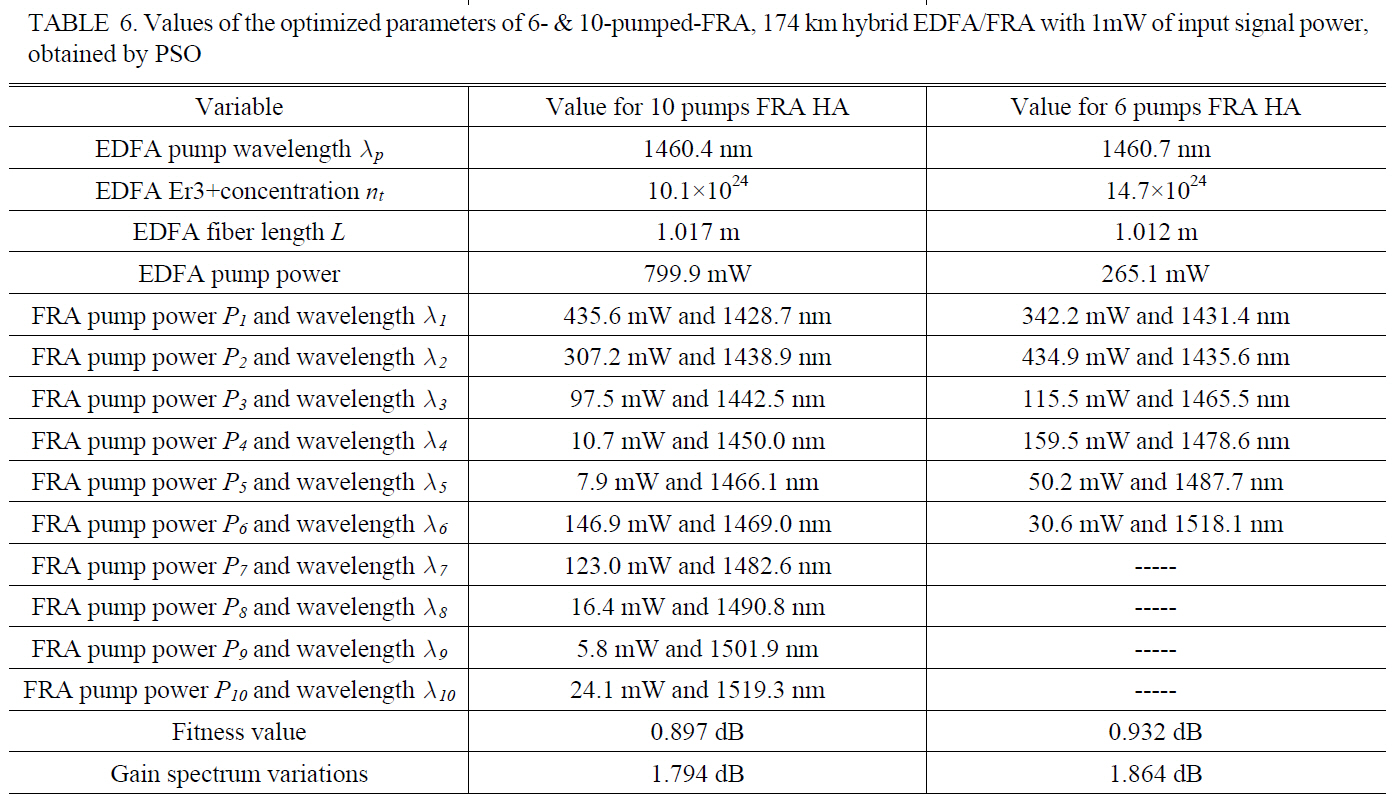
Values of the optimized parameters of 6- & 10-pumped-FRA 174 km hybrid EDFA/FRA with 1mW of input signal powerobtained by PSO
km, 6- and 10-pumped-FRA hybrid EDFA/FRA, respectively with 1mW input signal powers. Also, as listed in TABLE 6, gain spectrum variations of 1.864 and 1.794 dB are attained for 174 km, 6- and 10-pumped-FRA hybrid EDFA/FRA, respectively with 1mW input signal powers.
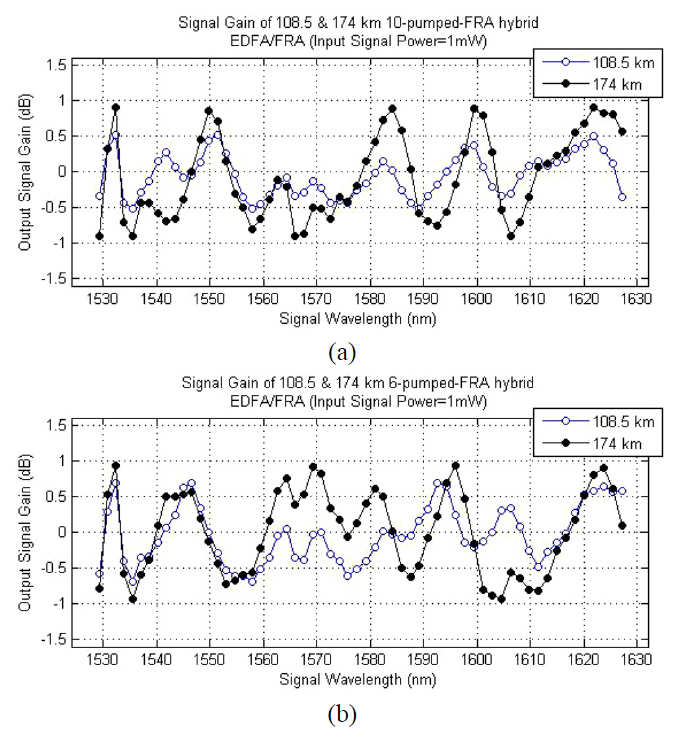
Using the results listed in the TABLES 5 and 6, optimized signal gain spectra of 108.5 and 174 km 10-pumped-FRA hybrid EDFA/FRA are shown in FIG. 3(a), 108.5 and 174 km 6-pumped-FRA hybrid EDFA/FRA are depicted in FIG. 3(b), 6- and 10-pumped-FRA 108.5 km hybrid EDFA/FRA
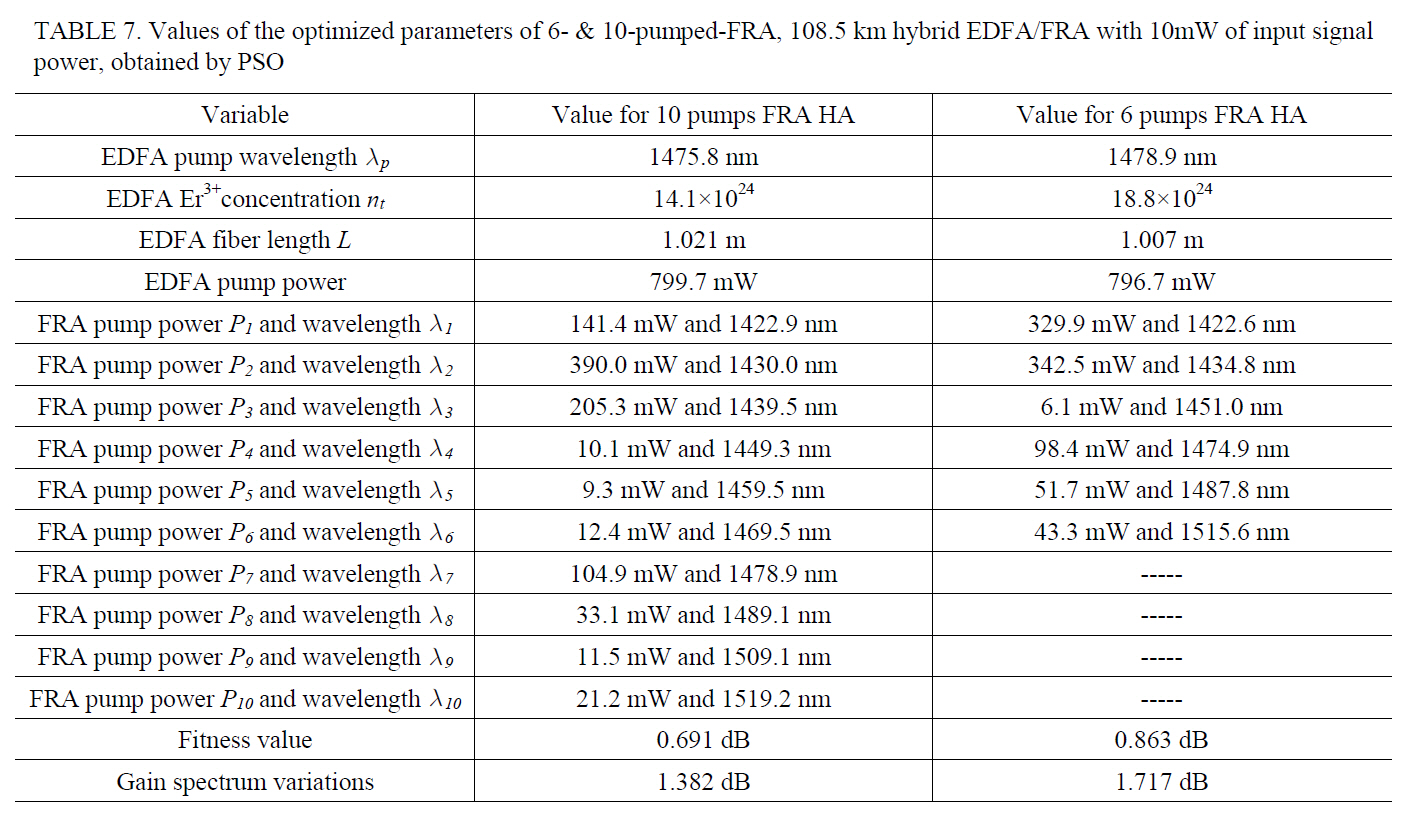
Values of the optimized parameters of 6- & 10-pumped-FRA 108.5 km hybrid EDFA/FRA with 10mW of input signalpower obtained by PSO
is pictured in FIG. 4(a), and 6- and 10-pumped-FRA 174 km hybrid EDFA/FRA is pictured in FIG. 4(b), all for 1 mW input signal powers. These figures present good visual comparison of the optimized gain spectra of different schemes.
It is common to select the FRA pump wavelengths in an equidistant form, but here we search the FRA pump
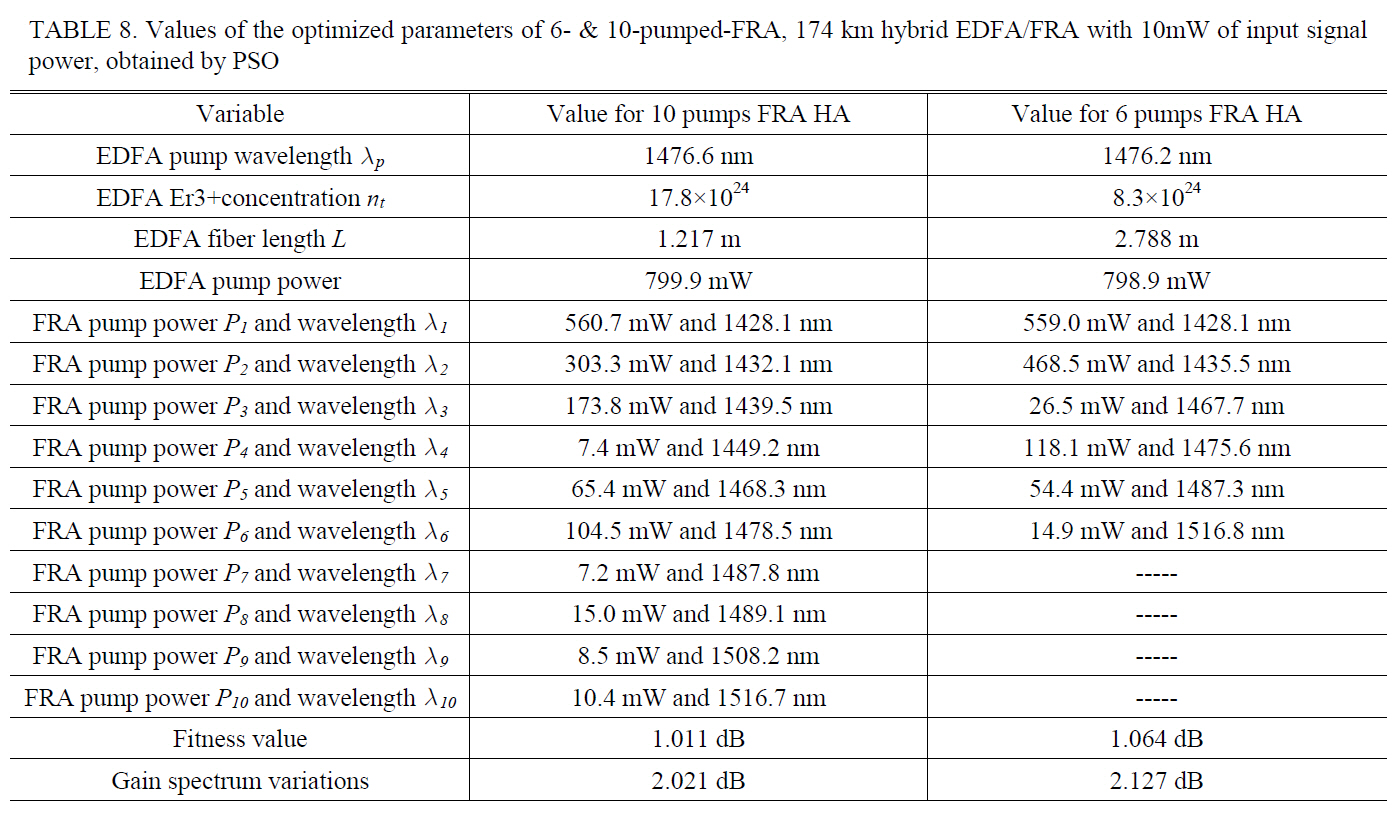
Values of the optimized parameters of 6- & 10-pumped-FRA 174 km hybrid EDFA/FRA with 10mW of input signalpower obtained by PSO
wavelengths through an optimization process which will result in better outcomes for gain spectrum variations. For example, gain spectrum variations of 2.91 dB for a 130.5 km, 6-pumped-FRA hybrid EDFA/FRA, equidistant FRA pump wavelengths [6] has become 1.864 dB for 174 km,6-pumped-FRA hybrid EDFA/FRA, by optimization of FRA pump wavelengths and also gain spectrum variations of 2.03 dB for a 130.5 km, 10-pumped-FRA hybrid EDFA/FRA, by equidistant FRA pump wavelengths [6] has become 1.794 dB for 174 km, 10-pumped-FRA hybrid EDFA/FRA, by optimization of FRA pump wavelengths,which are notable improvements.
For most cases, the wavelength spectral distance between the FRA pump wavelengths, presented inTABLES 5-8,are longer than 8 nm. At the closest point it will reach to 2.3 nm. By using narrow spectral width laser diodes at the places where the pump wavelengths are near the adjacent pump wavelengths, the pump powers will not interfere with each other and sound operation is guaranteed. Typical spectral width of a laser diode is about 0.1-10 nm.
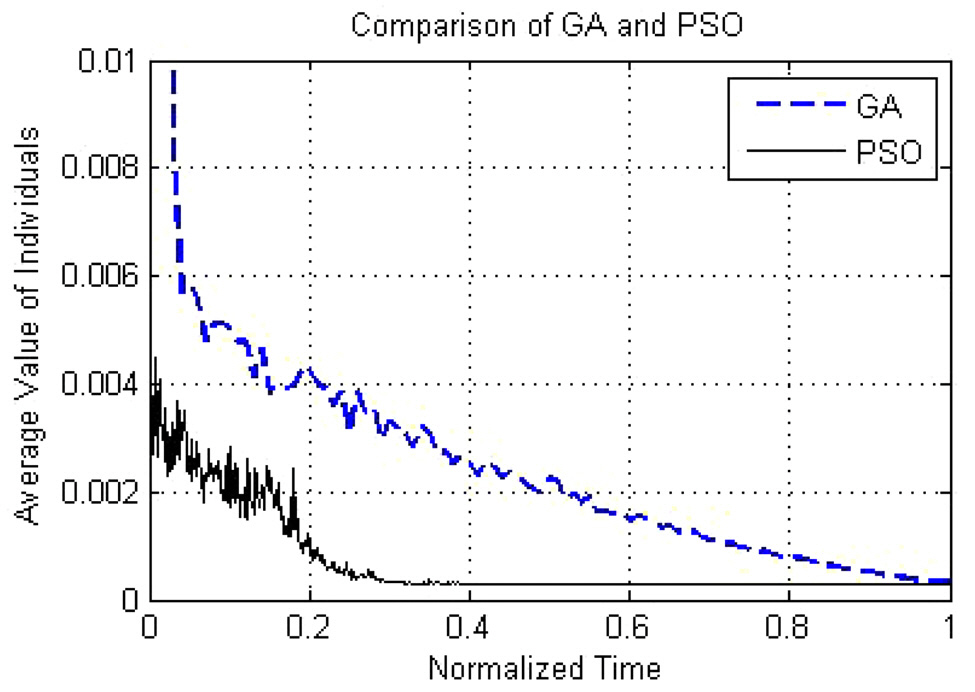
FIG. 5 shows a comparison between the convergence speeds of PSO and GA optimization processes which are carried on the optimization of one of the configurations of our WDM systems. It is apparent that PSO acts faster and more efficiently in searching for the optimum values for a system under test.
In this paper, we have used an effective optimization method, called particle swarm optimization (PSO) to offer optimum constructions for hybrid erbium-doped fiber amplifier/fiber Raman amplifiers (EDFA/FRAs). PSO allowed us to include a high number of parameters in the optimization process, so that we could optimize as much as 24 parameters simultaneously. Using the efficient PSO algorithm, pump wavelengths of FRA are optimized in addition to the FRA pump powers, EDFA pump power and wavelength, Er3+concentration, and EDFA length. This results in obtaining hybrid amplifiers with gain spectrum variations of as low as 1.043 dB for a 108.5 km and 1.794 dB for a 174 km,10-pumped-FRA hybrid EDFA/FRA, respectively. A comparison between the convergence speeds of PSO and genetic algorithm is done that shows that PSO is faster than genetic algorithm in converging toward the best values of amplifier parameters.


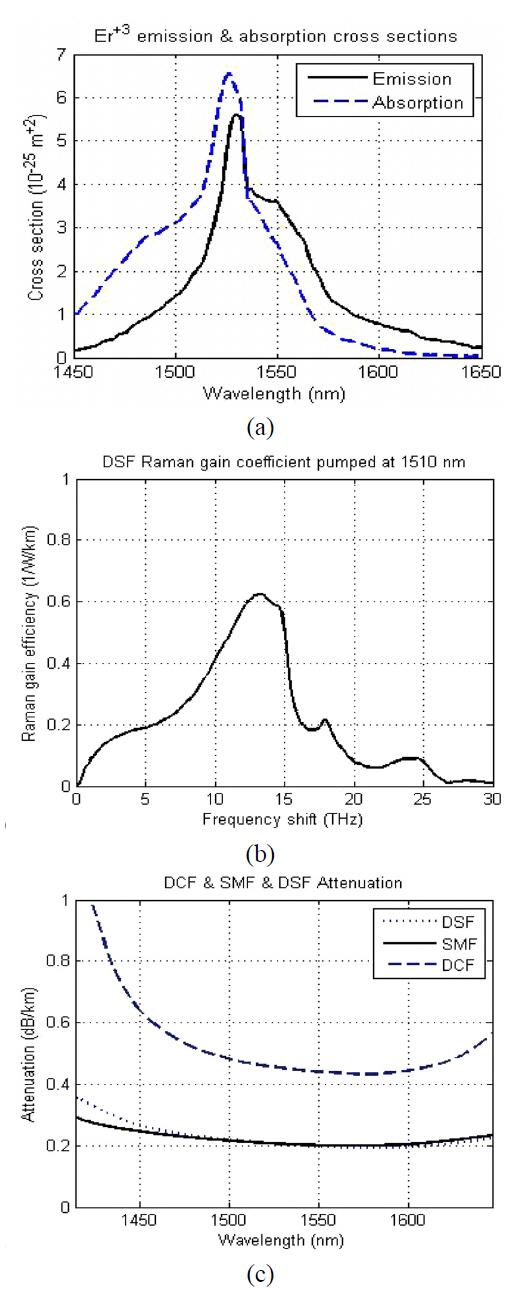
![Characteristics of the fibers (a) emission andabsorption cross sections of Er+3 doped in Al/P-silica SMF (b)Raman gain efficiency of DSF (c) DCF SMF and DSFattenuation spectrum. [2 23 24]](http://oak.go.kr/repository/journal/10741/E1OSAB_2010_v14n4_342_f002.jpg)