Side-polished fibers (SPF) are the building blocks of many single-mode fiber components such as directional couplers, polarizers, modulators, switches and wavelength filters [1-5] due to the accessibility of a significant fraction of the evanescent field of the propagating mode close to the polished surface. The evanescent field coupling between a SPF and an appropriate multimode overlay waveguide(MMOW) has yielded an important platform to realize various fiber optic sensors such as refractive index, pH and temperature sensors [6-12]. Such a composite structure essentially functions as an asymmetric directional coupler with a band-stop characteristic attributable to the wavelengthdependent resonant coupling between the guided mode of the SPF and one or more modes of the MMOW. The throughput power of the SPF exhibits dip(s) at the phasematching(or resonant) wavelength(s) [5, 6]. Since the refractive index (
In this paper, we have studied tunability of the sensitivity of such a temperature sensor by tapering the overlay waveguide interacting with a SPF, and have examined importance of the criticality, if any, of the MMOW’s designed parameters. We have approximated the SPF by an equivalent planar waveguide [15] and pursued the normal mode analysis for the resultant composite structure through a matrix method [16]. Curvature of the single-mode fiber affixed on the polished block was approximated with a staircase profile. This technique has been successfully used to model a fiber-optic temperature sensor with linear response in the temperature range 25 ~ 100℃ having a wavelength sensitivity (in terms of shift in the resonance wavelength) of 6~9 nm/℃, which is much higher compared to even the reported high-sensitive temperature sensors based on in-fiber gratings [17, 18]. We may mention that the temperature range measurable by this sensor is limited by the choice of the thermo-optic overlay material and can be increased further through suitable choice of a different MMOW. For completeness and standalone understanding of the concept, we describe below the functional principle of the model along the lines we described earlier in [12, 13].
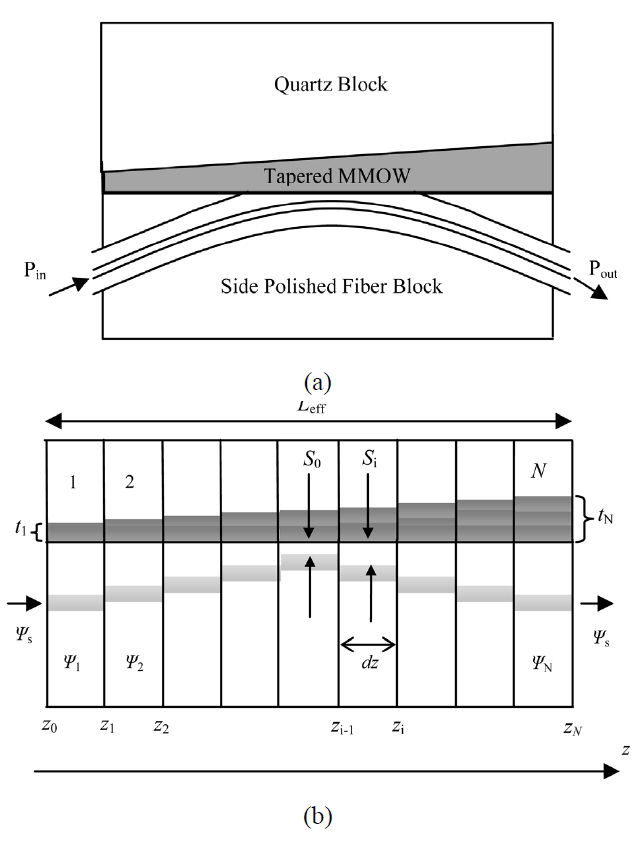
A schematic of a SPF-MMOW-based temperature sensor is shown in Fig. 1 (a), in which a SPF having limited cladding on one side of the fiber core up to a desired extent is loaded on its top with an appropriate thermo-optic MMOW. In order to model this device, we have used a semi-numerical normal mode analysis [5, 7], which involves approximating the SPF by an equivalent planar guide (EPG) [15] and the composite structure can then be treated as a planar multi-layered structure as shown in Fig.1 (b). Modal characteristics of such a structure can be easily obtained by using the normal-mode formalism based
on a well-known matrix method [16]. In reality, the remaining cladding thickness of SPF varies along the length of interaction due to the curved nature of the convex slot in which the fiber is fixed. Moreover, overlay waveguide is also typically non-uniform along the length of the block. The effect of both these non-uniformities has been taken into account through the staircase approximation.If the effective interaction length between the SPF and MMOW is
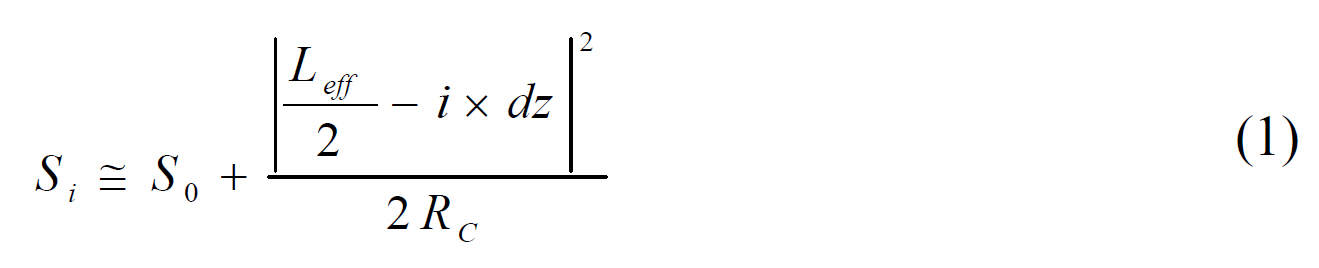
where,
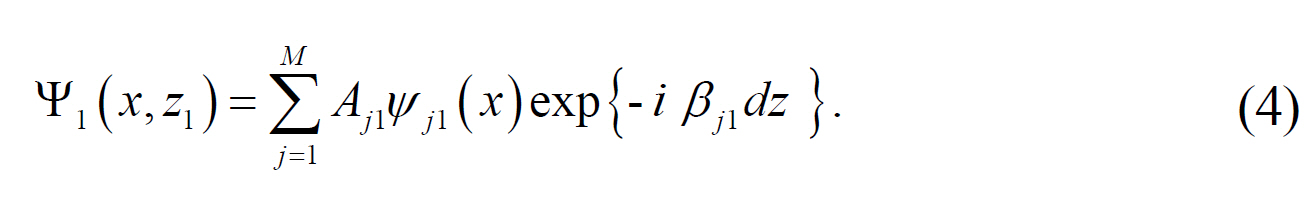
For modeling the tapered waveguide, we assume a linear variation of MMOW thickness along the z direction, whereas,in the case of a non-tapered waveguide the thickness of MMOW is assumed constant in each segment. To evaluate the throughput power of such a structure (shown in Fig.1(b)), we evaluate the power exchange in terms of the normal modes of the planar multi-layer structure consisting of the EPG and MMOW. We assume that unit power is launched into the device through the SPF, and at the device input it would excite all possible normal modes corresponding to the first segment of the structure. If
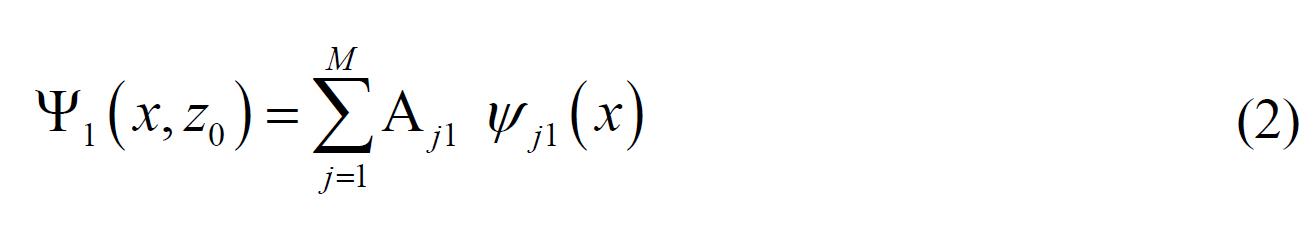
where
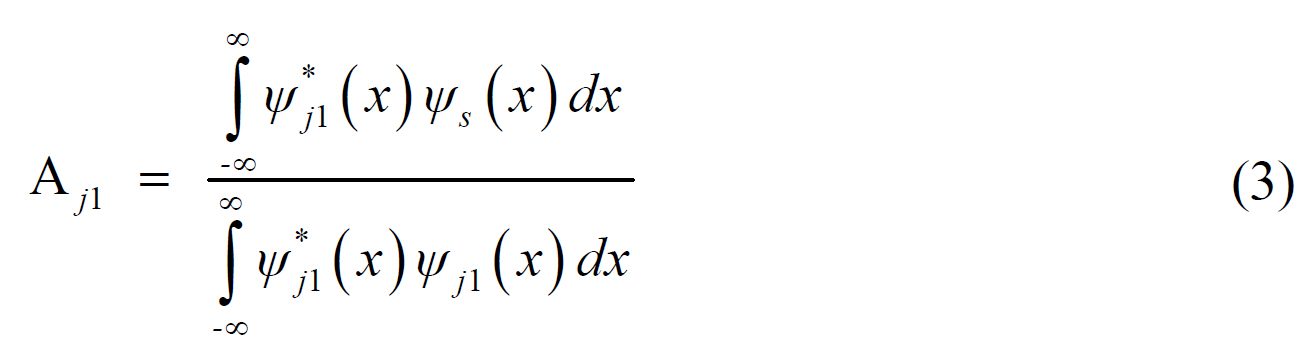
Since the refractive index distribution corresponding to each segment in the structure is known, the transverse field distributions of all the normal modes would also be calculated and hence the coefficient
At the interface
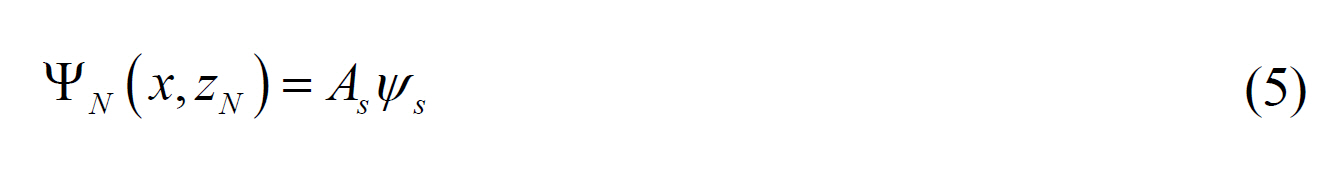
where
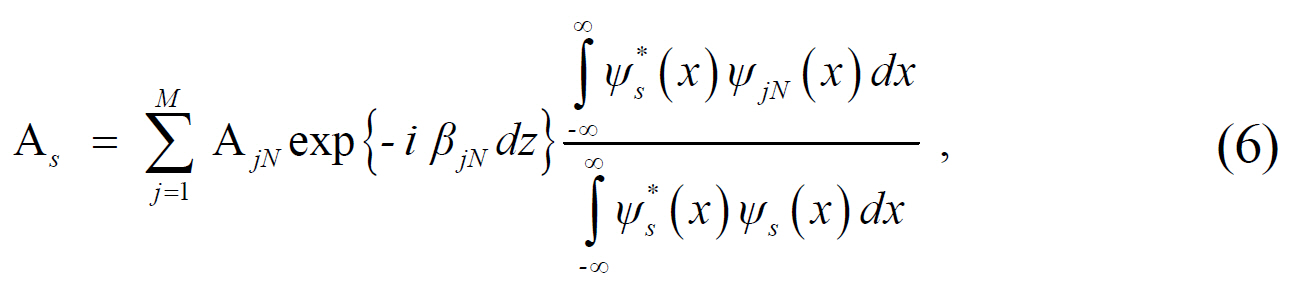
and the normalized throughput power
To study the effect of tapered MMOW on temperature sensing, we have analyzed both tapered and non tapered MMOW on a side-polished fiber. Through simulations, the parameters,
where
Various thicknesses (20-40 ㎛) and ratios were considered in simulations for the tapered MMOW. The thickness of the MMOW on the fabricated sensor was estimated to be 28.5㎛. The SPF half-coupler block used in the device was fabricated in-house with a standard Corning fiber (SMF-28).The unjacketed portion of the fiber was fixed into a convex slot cut in a quartz block of length ~ 3 cm, with radius of curvature ~ 27 cm. Then the block was polished up to the desired extent through selective removal of the fiber cladding from one side. MMOW was realized by spin coating the SPF with an appropriate polymer.
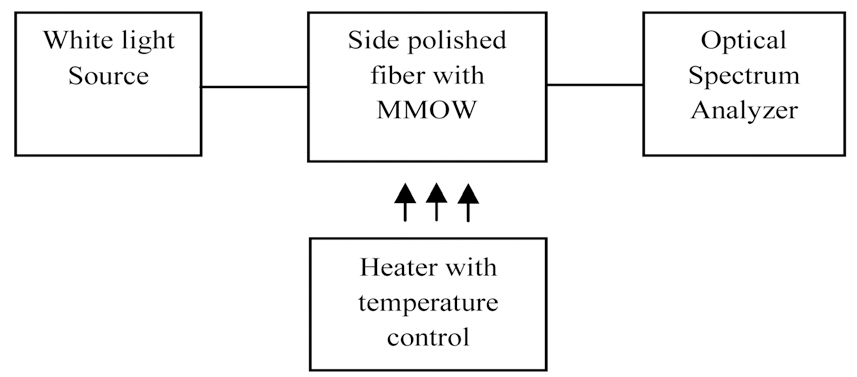
Detailed numerical investigations were carried out for the optimization of the device parameters to achieve the desired throughput loss spectrum of the device having clearly identifiable wavelength resonance notches. To demonstrate the sensing ability of the device experimentally, light from a white light source was launched at the input end of the fabricated device. The output power was measured using an optical spectrum analyzer (OSA). Temperature of the device was controlled by using a heater having temperature control and was measured by using a digital thermometer. Figure 2 shows a block diagram of the experimental setup of the proposed sensor.
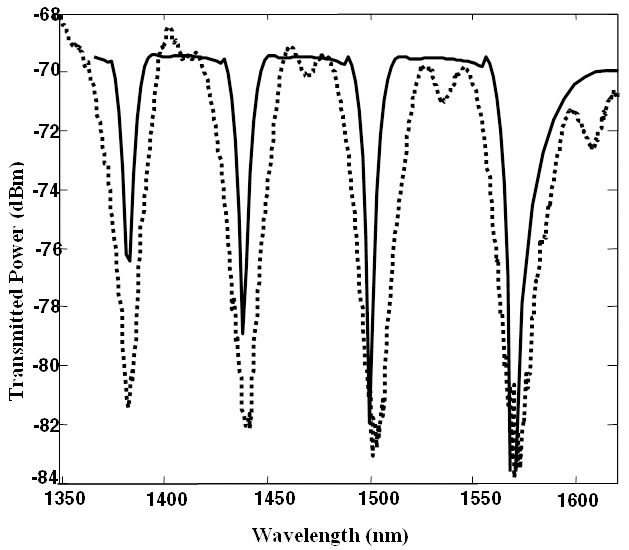
The variation of throughput power as a function of wavelength i.e. the throughput power spectra, obtained experimentally and theoretically at room temperature, are shown in Fig. 3. The solid curve corresponds to theoretically estimated
spectrum whereas the dotted curve shows measured throughput spectrum. This figure clearly illustrates a good agreement between our model and the experimental results; whatever small disagreement there is could be attributed to lack of precise knowledge of some of the parameters of the fabricated device, like remaining cladding thickness of the SPF and the consequential length of interaction,..
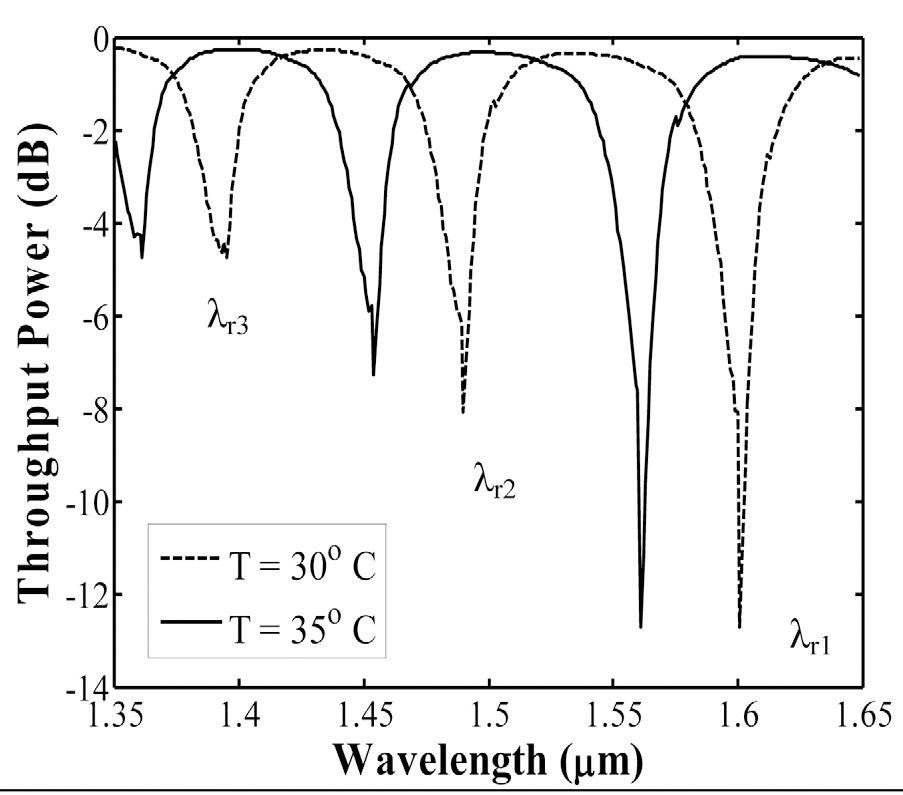
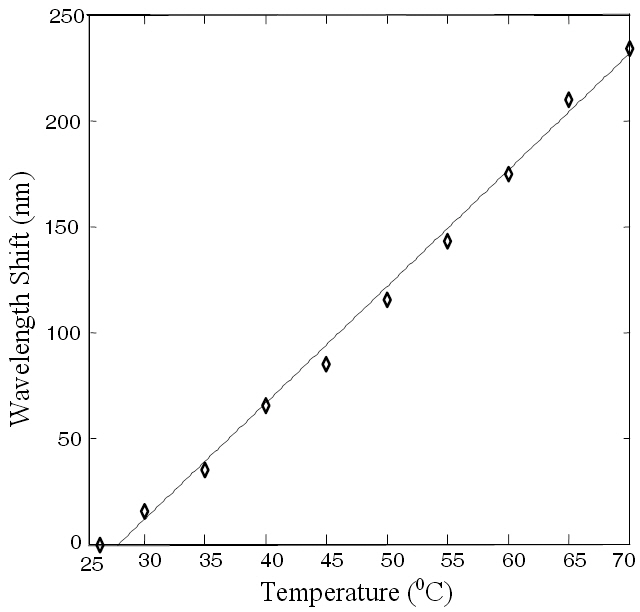
Figure 4 shows the variation of throughput power as a function of wavelength for two different temperatures for a tapered overlay waveguide (
variation is almost linear with temperature. It is worthwhile to mention that in the simulations similar linear trend was observed even up to ~ 100℃. The resonance wavelength shifts towards a shorter wavelength with increasing temperature,as evident in Fig. 4. This is due to the fact that the polymer chosen as the overlay has a negative thermo-optic coefficient, i.e., as the temperature increases, the refractive index of the overlay decreases, which results in a blue shift of the resonance wavelengths.
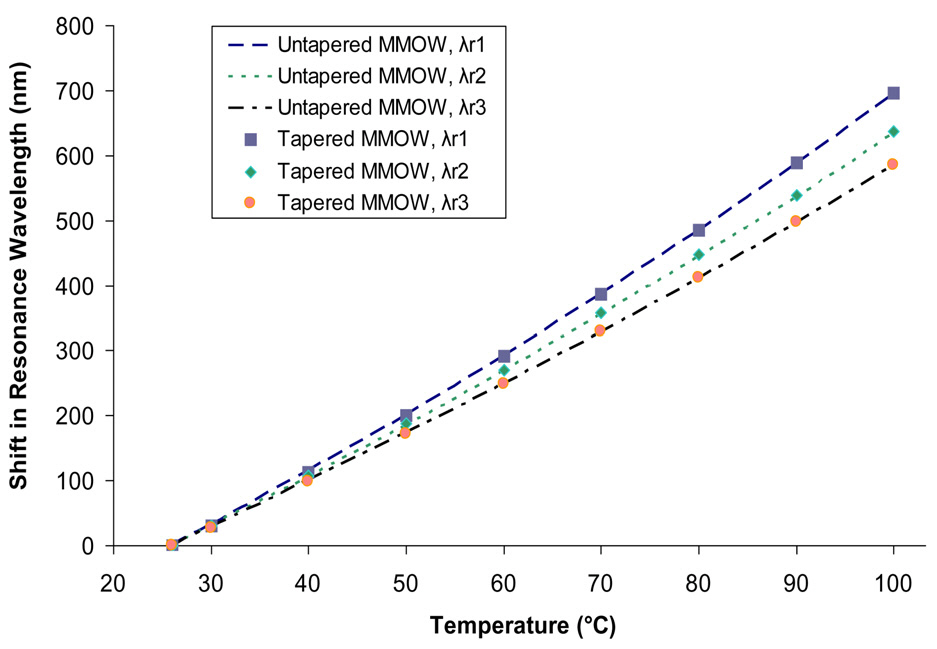
Figure 6 compares the shift (change) in the resonance wavelengths (λr1, λr2 and λr3) with temperature for a tapered MMOW and for the corresponding uniform MMOW by considering the throughput power at 26℃ as the reference.The wavelength shift in both the cases is almost linear with temperature. As can be seen in the figure, the shift in resonance wavelength is nearly the same for both tapered and non-tapered MMOW, and hence both have almost the same sensitivity. However the sensitivity varies with the choice of the resonance wavelength. For example, using a resonance wavelength towards the longer end of the throughput power spectrum (e.g. λr1 in Fig. 4), one can achieve higher sensitivity compared to the sensitivity attained at the lower end of the spectrum (e.g. λr2 or λr3).The sensitivity of the device as calculated from the slopes of these curves can be tuned by 6 ~ 9 nm/℃. Thus one could choose an operating wavelength based on sourcedetector availability and desired sensitivity. In a uniform MMOW, the spectrum is fixed and so are the positions of dips (resonance wavelength) in the throughput power spectrum while in a tapered MMOW, the resonance dips in the throughput power spectrum can be tuned through slightly translation of the upper quartz block relative to the MMOW underneath. From Fig. 6, one can also infer that the non-uniformity of the MMOW is really not a matter of concern for attaining high sensitivity of the device as long as the tapering of the MMOW is not large. Moreover in practice, it is hard (almost impossible) to fabricate a device consisting of a MMOW on a side-polished fiber
block precisely with the parameters that were obtained at the design optimization stage. Thus our results could be gainfully exploited to tune the device response through slight tapering of the MMOW if desired. Since a small amount of longitudinal taper is usually invariably present in a fabricated MMOW structure, our results indicate extent of tolerance to such longitudinal tapering in MMOW besides explicit results showing utility of such a tapered MMOW, which can be gainfully exploited. Also, the sensitivity achieved in both tapered and non-tapered cases is much higher than the fiber optic temperature sensors that rely on LPG and FBG [17, 18].
A highly sensitive fiber optic temperature sensor based on evanescent coupling of a side-polished fiber to a multimode overlay waveguide is designed and realized.Both tapered and non-tapered MMOW were studied for the temperature sensitivity. We can achieve sensitivity up to 9 nm/℃ in the temperature range of 25 to ~100℃. The sensitivity is more than 6 times higher compared to earlier reported high-sensitivity fiber optic temperature sensors based on e.g. in-fiber Bragg and long period gratings. Also our studies have indicated that a small tapering in the MMOW is tolerable and it does not affect the sensitivity of the proposed temperature sensor significantly while at the same time offering the advantage of certain amount of tunability in the choice of the operating wavelength/temperature range. Tapering also offers greater possibility of realization of the overall device closer to the parameters optimized at the simulation stage.