The demand for higher quality images has increased in many fields of application such as precision cameras, microscopes,spectrometers, displays, and nano-scale photolithography[1-3]. Finding out the optical noise sources and canceling the noise can play a key role for the entire optical system. Optical noise cancelation starts from determining where, why, and how much noise can be generated and how it can disturb the imaging signal quality. Nowadays analyzing stray light incoming along abnormal optical paths and canceling optical noise are recognized as the core technology of high quality optical systems. In particular, stray light that is unwanted light reaching a detector sometimes lessens the signal to noise ratio of the system by generating scattered or directional optical noise from various sources[4-6]. Analyzing the stray light of the system is therefore important because it reduces the risk of redesign or even of irreversible error. In the case of the payload camera system of a satellite, even a slight mistake cannot be acceptable,because correction is hardly possible after it is launched out to earth orbit. With the recent progress in space technology,the resolution of space borne electro-optical camera systems is becoming more competitive. During earth watching by an electro-optical payload on a LEO(Low Earth Orbit)satellite, the imaging quality can be accidentally disturbed by many kinds of noise that render the signal obscure,reduce the visibility, and cause incorrect radiometric results.
The most common method of analyzing stray light and canceling optical noise is radiometry, which can provide the calculated power of a beam of transferred stray light from object to object in an optical system [7-10]. However,radiometry can give only limited visualization though it is efficient at getting a numerical result for the signal to noise flux ratio. On the other hand, the ray tracing method can provide not only a better computational capability but also visual information. Therefore, we used a ray tracing method as a graphical help when we analyze stray light sources and perform an optical noise cancelation for an electro-optical payload on a LEO(Low Earth Orbit) satellite.
In this study analyzing stray light and canceling optical noise is focused on the effect of a window placed in front of an FPA(focal plane area). Though the role of a window is frequency filtering before a signal reaches the detector array, other possible effects of a window, including internal and external reflection of the signal, need to be discussed.We discuss two possible noise effects that can be generated by a window. The processes of possible optical noise generation are discussed with some parametric assumptions.The amount of optical noise flux is estimated for each noise source. Of course, there are many noise sources such as electric, mechanical and quantum effects. Those noises can be more significant than the optical noise, but in this paper we exclude those noises and discuss only the optical noise.
II. ANALYZING THE PROCESS OF OPTICAL NOISE GENERATION
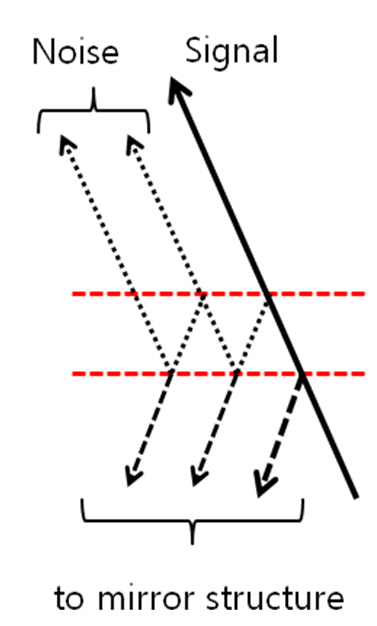
In front of a detector array that is composed of long units, a window is placed for filtering signals for intended frequencies. Figure 1 describes the dividing process of a signal ray reaching a detector. Most signal rays can reach an FPA along the normal optical path, but some of rays reflect to the mirror structure by internal and external reflections at the window.
In Fig. 1 an obliquely incident ray is first divided at the window filter into transmitted and reflected beams. The transmitted beam proceeds along the normal optical path,but the reflected beam proceeds to the unintended destination of a mirror structure. Even the transmitted beam, of course, experiences multiple internal reflections inside the window filter and may generate ghost images on a FPA.In this kind of a noise, a higher order of an internal reflection has a relatively small flux and can be neglected compared to the beam flux of the first reflection inside the window filter.
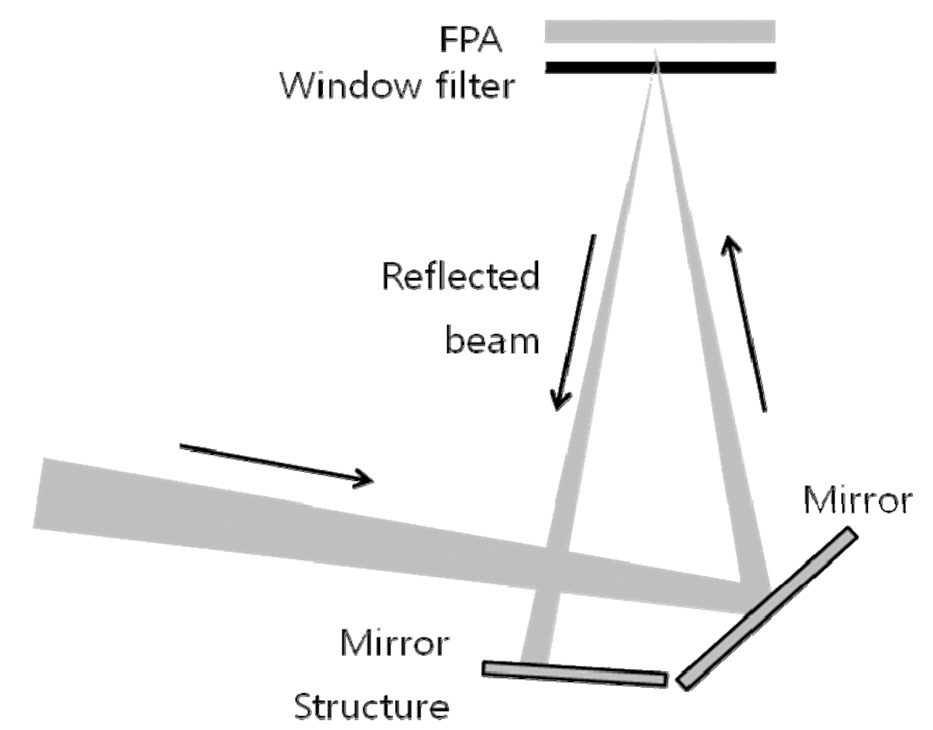
Figure 2 is more descriptive of the beam dividing process at the window and of the optical noise generation process.Only the beam flux reaching an FPA along a normal optical path can be a signal, and anything else of the beam flux cannot be a signal even if it also reaches the same destination of an FPA. About 99.82% of the beam flux reaching an FPA was calculated to be signal and 0.18% of the beam flux was found to be noise that had the same destination FPA, when the beam flux reflected to the mirror structure was neglected. However, in our former
study of stray light analysis, the reflected beam flux to the mirror structure was imaged on the surface of a mirror structure, and we recognized that it needed to be handled because some of the beam flux on the surface of a mirror structure was not absorbed and instead was scattered back to an FPA.
III. OPTICAL NOISE REMOVAL FROM THE REFLECTED BEAM THAT WAS DIRECTED TO THE MIRROR STRUCTURE
In this study, an optical noise cancelation was performed for the beam flux that was directed to the mirror structure.The reflected beam flux cannot be fully absorbed at a surface of the mirror structure. The reflected beam flux at the window can be scattered at the surface of the mirror structure in a randomized pattern and may be directed back to the FPA. We applied a scattering model to the surface of the mirror structure to estimate the magnitude of the effect of scattered flux on the signal to noise ratio if there is any optical noise effect to the FPA. Table 1 shows variations of a relative optical noise flux and a signal to noise ratio with the presence of a scattering model application to a surface of the mirror structure. The applied scattering model was a well-known diffuse metal model.
An optical noise means all flux falling on the FPA except for signal rays. Some optical noise flux can have the same destination as the focal point of a signal. The‘relative noise flux’ is optical noise flux as a percentage of
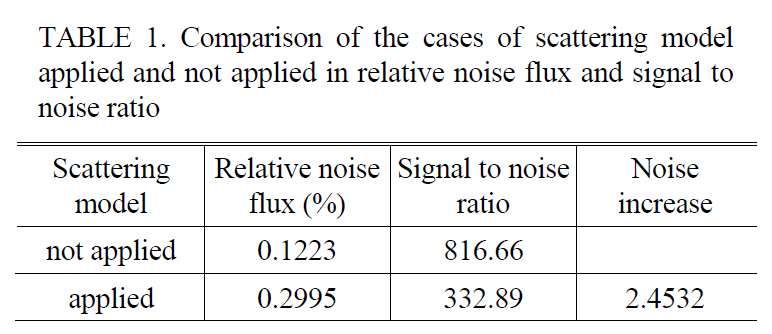
Comparison of the cases of scattering modelapplied and not applied in relative noise flux and signal tonoise ratio
the total flux on the focal plane.
For the case where the scattering model is not applied,we assumed that the beam flux reflected from the window is fully absorbed at a surface of the mirror structure and no beam flux can bounce back to the FPA. In Table 1, the noise flux indicates the relative amount of beam flux that has the same destination FPA as the signal. For the case where the scattering model is not applied, a noise flux of 0.1223% is a relative amount that reaches the same FPA as a signal. On the other hand, in the case of scattering model applied, a noise flux increases to 0.2995%, which means that some scattered beam flux at a surface of the mirror structure bounced back to the same destination FPA as the signal. Therefore, the relative amount of noise flux has increased from 0.1223% to 0.2995% by applying a scattering model to the surface of the mirror structure.Therefore, a proper countermeasure should be applied to decrease the relative optical noise ratio and increase image quality.
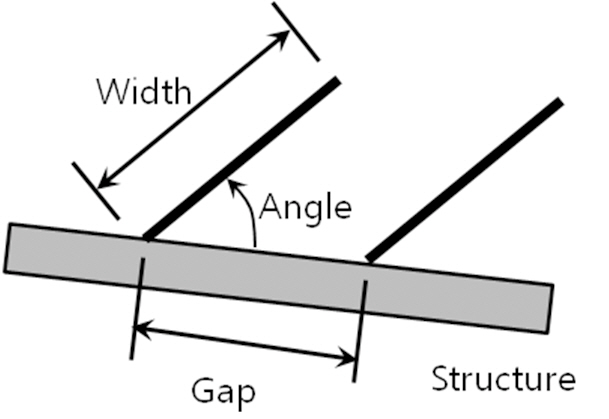
To prevent a relative noise flux increase as shown in Table 1, a baffle patterning on the surface of a mirror structure was proposed as shown in Fig. 3. Three simplified parameters of a baffle pattern were width, angle, and gap. We
investigated how a relative noise flux changes with various compositions of three parameters.
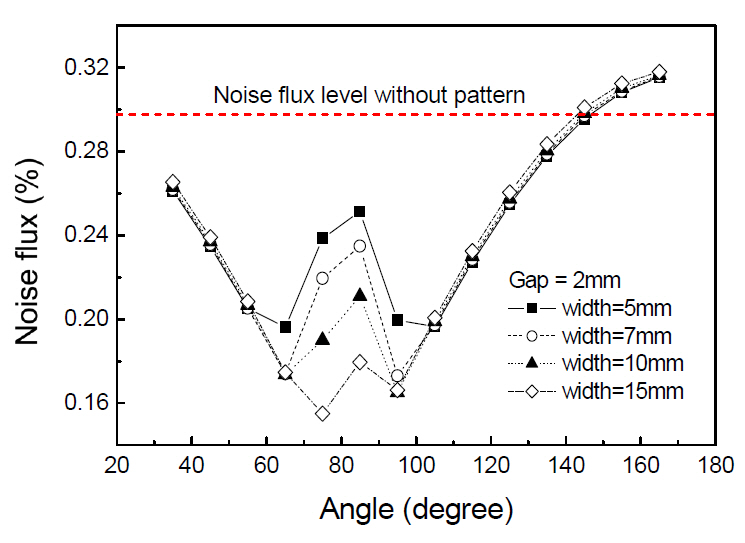
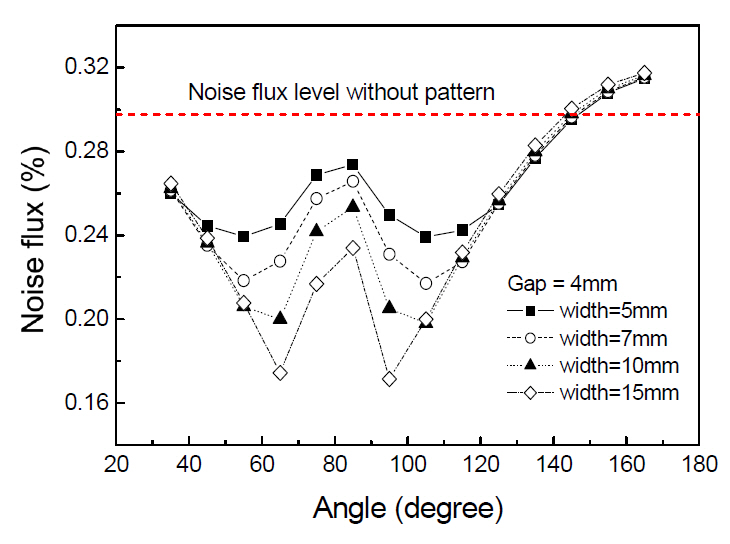
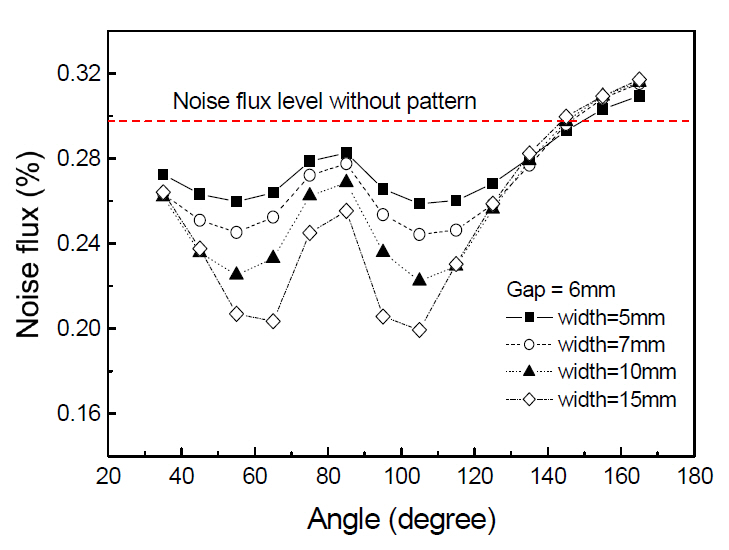
Figure 4 is a simulation result of noise flux variation with the angle of a baffle pattern when the gap is 2 mm and the widths are 5, 7, 10, 15 mm. The relative noise flux level without patterning is also marked in Fig. 4 as discussed in Table 1. The minimum relative noise flux appears at the values of 15 mm and 75° in gap and angle,respectively. The calculation results showed the second dip in a relative noise flux decrease around 95° in angle of baffle pattern. Larger widths showed lower relative noise flux in a range of 55° ~ 105° in angle of a baffle pattern. Figure 5 and 6 are also simulation results of a relative noise flux variation with the angle of a baffle pattern when the values of the gap are 4 mm and 6 mm, respectively. The values of a baffle width are also 5, 7, 10, 15 mm as the same condition of Fig. 4. The relative noise flux increases as the gap widens, but decreases as the width of a baffle pattern lengthens. Two dip values in Fig. 4~6 become
noticeable with decreasing gap of a baffle pattern, and the interval between the two dips in angle got narrower. Regardless of gap value, the longer width showed a decrease of a relative noise flux and a closer spacing of the two peak dips in angle.
IV. OPTICAL NOISE REMOVAL FROM THE TRANSMITTED BEAM REACHING AN FPA PLANE
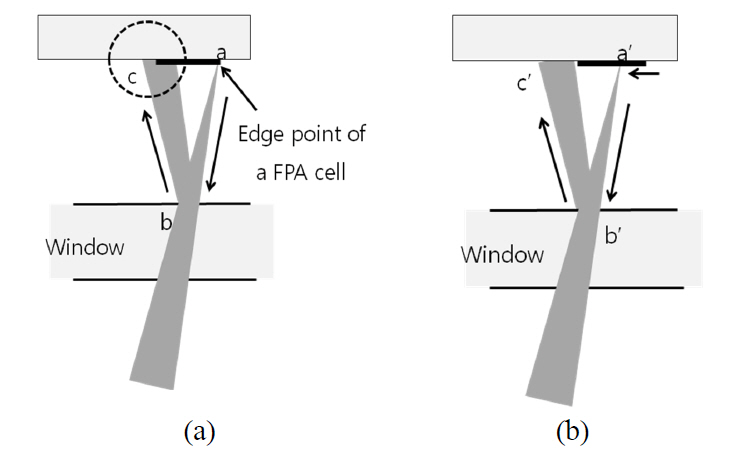
Transmitted beam flux of a signal may not be wholly absorbed by a sensor, and and it can be converted to a signal due to a reflection on the surface of a sensor. Figure 7 shows how noise can be generated by a successfully transmitted beam that has reached the FPA plane. At point a in fig. 7(a) some flux from an incident beam reflects at the FPA surface and is directed to point b of the window surface. Partial beam flux at the point b may experience a reflection and redirect to the third point c on the FPA plane. The amount of beam flux travel along this process,of course, depends on the reflectance of a sensor and of a window surface. And the sensor geometry on the FPA plane is also an important factor to be considered. The additional noise flux due to an internal reflection inside a window should also be considered, but the relative amount may be small as compared to the noise flux described in Fig. 7.
Noise generation due to a reflection on the surface of an FPA cell sensor is a little complicated. As described in Fig. 7 the generated noise flux depends on the width of an FPA cell sensor and on the expanded beam size. The expanded beam on the point c puts a leg on the surface of an FPA cell as shown in Fig. 7(a), and it generates ghost noise. If the position of a beam reaching an FPA cell moves to the center of an FPA cell as depicted in Fig. 7(b), the reflected beam at the point b′ could not put a leg on a FPA cell,and it falls on the substrate plane. The amount of a ghost flux appearing on the surface of an FPA cell depends on the reflectance of a cell and of the window surfaces.
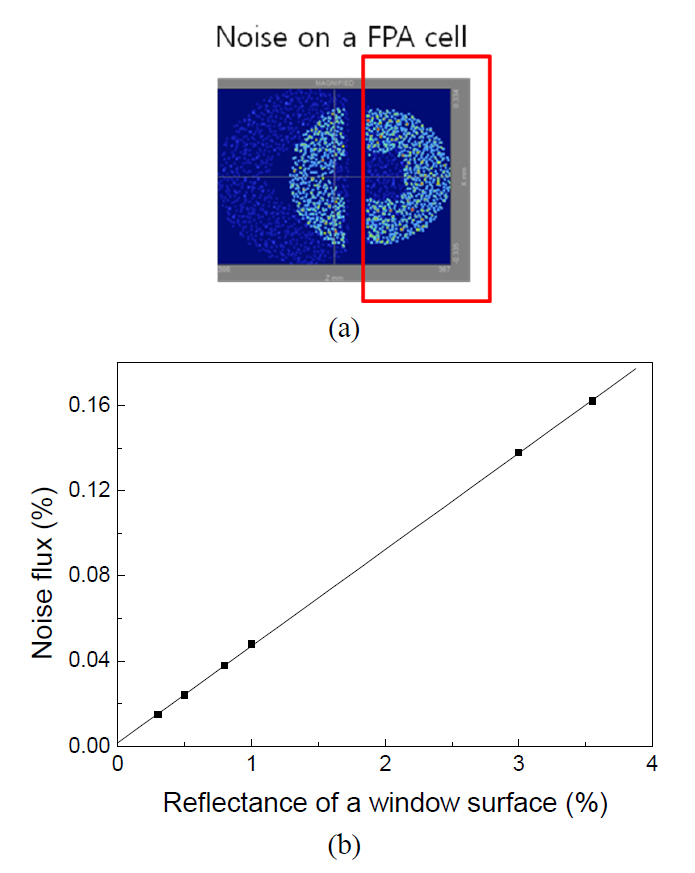
Figure 8(a) shows the ghost image on an FPA cell for the case of Fig. 7(a), and Fig. 8(b) is the calculated noise flux versus the window reflectance. The noise flux in Fig.8(b) is the beam flux inside a solid box denoted in Fig.8(a). In the calculation of the Fig. 8(b) graph, the reflectance of the surface of a FPA cell is assumed 10% for the incident beam reaching the FPA plane.
In Fig. 8(a) a solid box denotes the area of a FPA cell.Some of the donut shaped beam flux is incident on an FPA cell and the rest of the beam flux falls on the substrate plane. The latter does not give any effect on an image quality up to this step. Of course, the next step for the reflection from the bottom plane can change the signal to noise ratio, but it is given no more consideration due to its low contribution to a signal to noise ratio. In the graph of Fig. 8(b), we assume the beam flux of point a denoted in Fig. 7(a) to be 100%. The noise flux was less than 0.16%when the window was not coated. The calculated noise flux does not look serious even if the reflectance of an FPA surface is assumed to be as high as 10%.
In this paper we discussed two noise sources in the electro-optic camera loaded on a low earth orbit satellite.Two sources of optical noise generation are due to a window placed in front of the FPA plane. The first was generated when the signal rays are incident on the window which is placed before the FPA plane. The rays reflected by the window are directed to the mirror structure and scattered there. We applied a scattering model to the surface of a mirror structure and calculated how much the scattered beam flux influences the signal to noise ratio. We provided some calculations for three parametric solutions. The second optical noise source was due to the reflection from an FPA cell surface. Though the beam transmitted through a window successfully reaches on the FPA cell surface, it is not fully absorbed.
As mentioned in the introduction, the space borne payload camera plays a key role in the entire capability of a satellite.Even a little mistake is not acceptable because any remedy is difficult after the satellite is launched out into earth orbit. In this paper we pointed out two optical noise sources that can influence the signal to noise ratio. No matter how small the optical noise effect is, it is important to prevent mistakes. Future research into this area will be valuable even if the impact of the errors studied is very small.