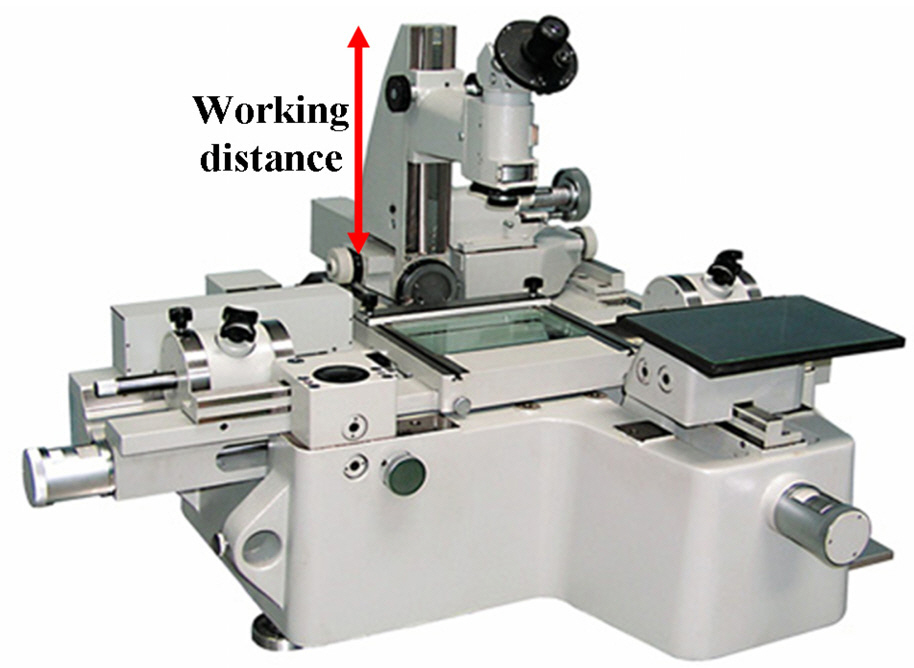
Sieves with different opening sizes have found many applications in industry [1-3]. They are used to sift just about anything like metal powders, sand, flour, toner powder,sugar, pharmaceutical powders, and adhesives. Sieve calibration is therefore essential for accurate measurement. There are two commonly recognized methods to calibrate test sieves:microscopy and glass beads. Used correctly, both methods are accurate but, for every day use, they suffer from a number of disadvantages. Microscopy is expensive and time consuming,and the method examines only a fraction of a percentage of the sieve surface. The universal microscope which is the most common microscope used for sieves calibration is shown in Fig. 1. An alternative method uses glass beads[1-3]. Although this method has many advantages over the microscopy method in terms of speed (It can calibrate test sieves within a few minutes) and accuracy (glass beads pass over virtually the total surface of the sieve), it also suffers from some disadvantages. One of these disadvantages is a calibration of the glass beads used. Microscopy is used commonly to characterize glass beads, which in turn are used to measure the sieve opening size. The disadvantage here is that the accuracy of the method is dependant on the sphericity of the beads. This means, any deviation gives rise to inaccuracies because opening sieve diameters can be quite different from the equivalent spherical diameters of nonspherical particles as measured by microscopy. In addition, the glass bead method requires calibrated glass beads for every sieve. In this paper, we describe, throughout a Mach-Zehnder interferometric scheme, a new test sieves calibration method based on off-axis digital holographic phase measurement.The experiment is conducted on a test sieve with square openings. The size of the opening aperture is 1.00 mm nominally. The schematic diagram used is shown in Fig. 2.A single shot off-axis hologram has been captured by using a CCD camera with 1024×768 pixels. Each pixel size of the CCD camera is Δ
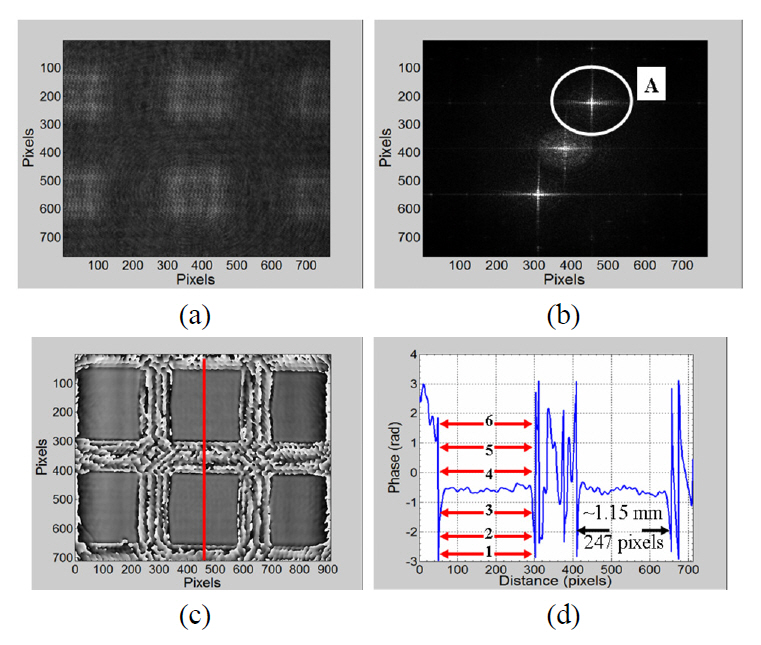
in front of the CCD camera) instead of an imaging scheme(where an imaging lens is used in front of the CCD camera)to overcome the imperfections such as image distortion or aberration that may be produced by the lens based imaging scheme. From the reconstructed phase, nearly 6 opening sizes in the field of view (FOV) have been measured. The average size of the measured openings calculated from the reconstruction phase has been estimated to be around 1.15 mm (the nominal sieve opening is 1.00 mm with maximum individual opening of 1.14 mm in size). The average size of the measured openings extracted from the reconstruction phase has been compared with the average size of the measured openings extracted from the reconstructed intensity and conventional microscopy methods. Because steep abruptions occur in phase reconstruction, the opening size measurement based on phase reconstruction is much better in terms of precision than that based on intensity reconstruction and conventional microscopy methods. For clear description, numerical precision comparison has been presented for the proposed and the conventional methods.
The advantage of the proposed method over the conventional methods [1-3] is that the proposed method can calibrate openings of the test sieves very precisely and with moderate accuracy. The proposed method may require initial calibration for matching between pixel number in the reconstruction and the real length on the specimen plane. The accuracy of the proposed method may be increased when the light beam illuminates the total surface of the test sieve. This can be done by enlarging the beam size (the beam diameter can reach around 10 cm by using beam expander, for example)or by using a scanning stage to cover a large area around the test sieve.
II. RECONSTRUCTING THE OBJECT WAVE BASED ON FRESNEL TRANSFORM
The hologram intensity resulting from the interference of the object wave

In Eq. (1), * stands for the complex conjugate: the first two intensity terms are of the zero order, which can be directly filtered in the Fourier domain [11]; and the last two terms represent the interference terms with the object wave
Here,
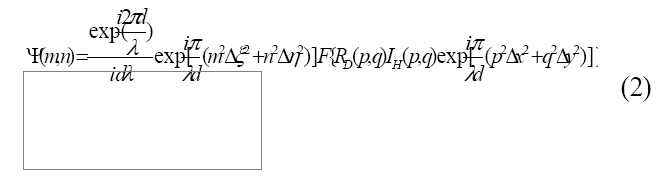
An amplitude-contrast image and a phase-contrast image can be obtained by using the following intensity [Re(Ψ)2+Im(Ψ)2] and the argument [Re(Ψ)+Im(Ψ)], respectively. In the reconstruction process, the intensity of the filtered interferogram is multiplied by the amplitude of the original reference wave, which is called a digital reference wave

where,
III. EXPERIMENTAL RESULTS OF THE PROPOSED SCHEME
Interferometry is a well-established technique for surface profiling [12]. It is non-contacting, nondestructive and highly accurate. In combination with computers and other electronic devices, interferometers have become faster, more reliable,more convenient and more robust. Information about the surface under test can be obtained from interference fringes which characterize the surface. Figure 2 shows the schematic diagram of the proposed optical setup based on the Mach-Zehnder interferometric configuration.
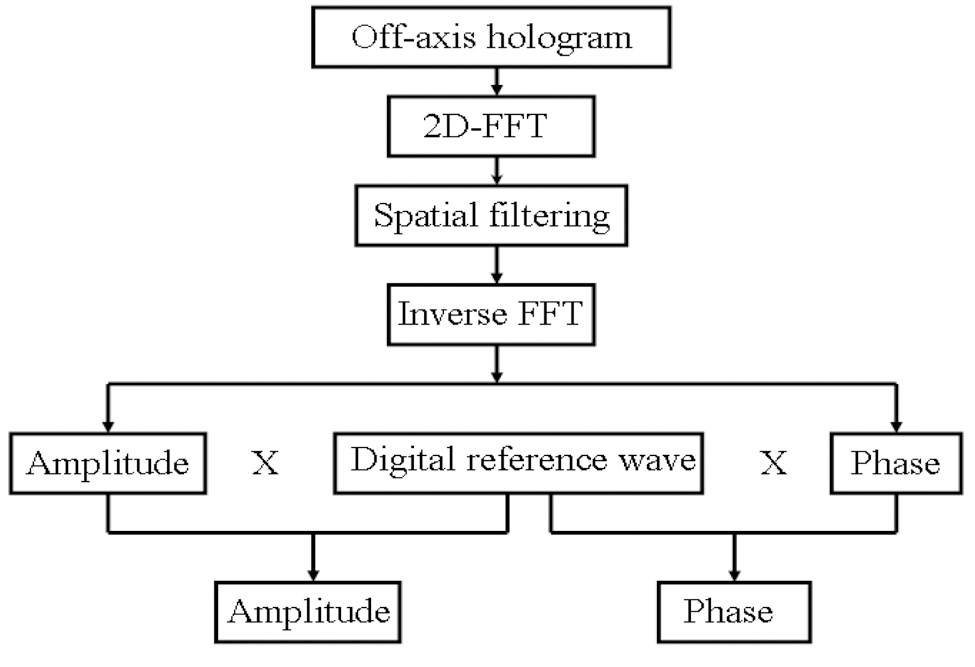
A laser diode beam passes through a collimating lens and expands. This expansion is necessary to illuminate a greater area of the surface to be imaged and to reduce the error measurement due to the inhomogeneity in the Gaussian beam. The collimated beam of the laser light falls upon the beam splitter BS 1, which transmits one half and reflects the other half of the incident light. The reflected beam acts as the reference beam and it travels to the BS 2 by way of the mirror M2. Meanwhile, the reflected portion of the beam which is called the object beam reflects from the mirror M1 to illuminate the openings of the object (test sieve) and then travels to the BS 2. The interference fringes are generated at the BS 2 and recorded by the CCD camera.The off-axis hologram at perfect collimation is numerically processed using Fresnel transform [10] to obtain the object wave. Figure 3 shows the flow chart of the algorithm that was used to analyze the off-axis hologram.
Figure 4(a) represents the measured off-axis digital hologram.The filtering window A as shown in Fig. 4(b) has been chosen carefully. The inverse 2D-FFT is applied after filtering
out the two undesired terms, and the complex object wave in the interferogram plane is extracted. After the spatial filtering step, the digital reference wave
been estimated to be around 1.15 mm.
The illuminated openings of the test sieve have also been tested with the reconstructed intensity obtained by the off-axis digital holography as shown in Fig. 5 and the average size of the measured openings has been estimated to be around 1.10 mm.
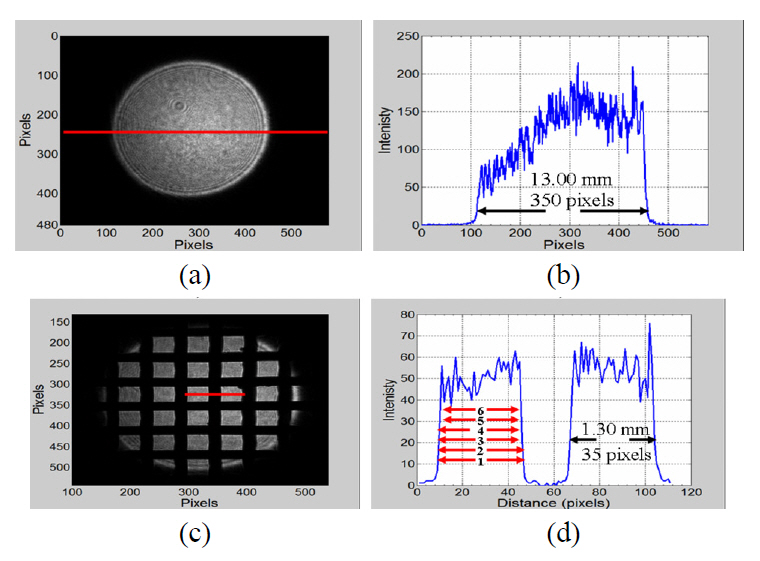
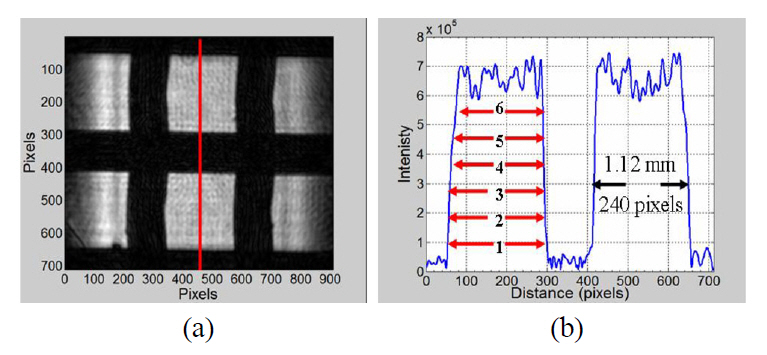
The illuminated openings of the test sieve have been tested using a conventional method based on imaging microscopy with a beam size as a reference as shown in Fig. 6. The object arm of Mach-Zehnder interferometer (see Fig. 2),after blocking the reference arm has been used to illuminate the openings.
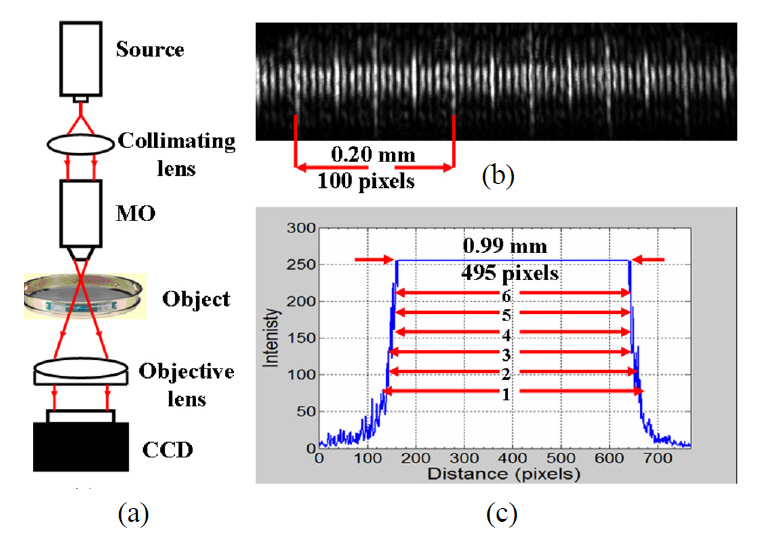
In this method, the illuminated beam size which serves as a reference has been estimated to be around 13.00 mm.This corresponds to 350 pixels as shown in Fig. 6(b). The test sieve which serves as an object has been imaged as shown in Fig. 6(c) by an imaging lens used in front of the CCD camera. The profile of two selected openings is shown in Fig. 6(d). The average of the measured openings has been estimated to be around 1.27 mm. The illuminated openings of the test sieve have also been tested using a conventional method based on imaging microscopy with a stage micrometer as a reference as shown in Fig. 7. The schematic diagram of the optical setup used is shown in Fig. 7(a).The technique has been built to image the test sieve (object)and to calibrate its openings with a stage micrometer (reference).A stage micrometer is simply a microscope slide with a finely divided scale marked on the surface. The scale is of a known true length and is used for calibration of optical systems. The stage micrometer which has been used for calibration of the openings of the test sieve is a scale of 1mm in 0.01mm divisions. The scale of the stage micrometer used has been imaged by a microscope objective (MO) of 10x. The image of nearly 0.6 of the scale of the stage micrometer is shown in Fig. 7(b). Figure 7(c) shows one opening of the mesh test sieve imaged by the MO of 10x.The size of the opening has been estimated to be around 1. 00 mm. Although the method is accurate, it suffers from
the non-steep abruptions of intensity, which means, it is difficult to know which measured value is correct.
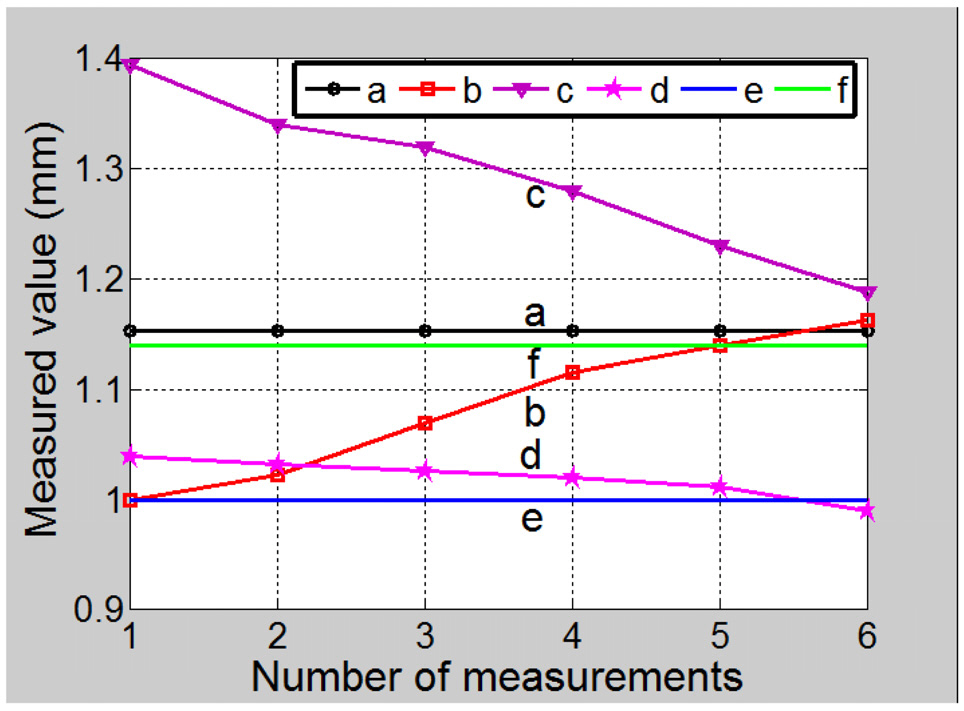
The results extracted from Fig. 4(d), Fig. 5(b), Fig. 6(d),and Fig. 7(c) signify that openings size measurement based on phase reconstruction is much precise than that based on intensity reconstruction, imaging microscopy with a beam size as a reference, and imaging microscopy with a stage micrometer as a reference methods. For more clarity, one opening aperture (see Fig. 4(d), Fig. 5(b), Fig. 6(d), and Fig. 7(c)) has been measured 6 times at different positions.The number of measurements against the measured value is shown in Fig. 8 which represents the effect of non-steep abruptions of intensity reconstruction on openings measurement. The measured value based on intensity reconstruction
varies between 1.00 mm to 1.17 mm, while the measured value based on phase reconstruction is nearly constant at a single value (1.15 mm). Measurement based on the conventional method show that the imaging microscopy with a stage micrometer method is better in terms of precision than the imaging microscopy with a beam size as a reference method.This may be due to the inaccurate measurement in the reference beam used. The variation of the measured value based on intensity reconstruction, imaging microscopy with a beam size as a reference, and imaging microscopy with a stage micrometer makes it difficult to choose one measured value as the correct value. For this sake, we claim that the phase reconstruction based measuring method is much precise than that based on intensity reconstruction, imaging microscopy with a beam size as a reference, and imaging microscopy with a stage micrometer as a reference methods for calibrating test sieves.
For the single-shot off-axis based digital holography, we can say that the main error sources are inevitable signal processing errors due to the FFT based spatial filtering process.As well known, an energy leakage problem due to the FFT process is inevitable in most applications. As a solution for this, the image processing technique called “apodization” can be used to reduce the fluctuation error due to the energy leakage problem [13]. And also, the spatial filtering process can increase the calculation error of the off-axis scheme since we can not filter only what we want from the spatial frequency domain data. The uncertainty budget [14] of the off-axis scheme can be as small as around mm for a perfectly flat mirror surface in case that we apply the apodization filter for the off-axis digital hologram.
We presented, throughout the Mach-Zehnder interferometric configuration, a new high precision test sieves calibration method based on off-axis digital holography. The proposed method can provide a real time solution for calibrating test sieves. In addition, it is very precise and can provide moderate accuracy (the accuracy can be increased when a larger area around the test sieve is illuminated; this can be done by enlarging the beam size or by scanning, for instance).