Optical coherence tomography (OCT) offers a very effective noninvasive method for the visualization of biological tissues with high resolution and measurement speed [1]. The development of Fourier domain OCT (FD-OCT) [2] has great advantages in terms of acquisition time and sensitivity compared with time-domain OCT (TD-OCT). These pro-perties have made FD-OCT applicable for 3D ophthalmic imaging [3].
Conventional retinal OCT uses a probing wavelength of 830 nm, but 1-μm retinal OCT systems have also been developed. What makes 1-μm OCT a very interesting alternative for retinal ophthalmic imaging is that the water absorption has a local minimum at 1.06-μm [4]. In addition, the longer wavelength scatters less than 830 nm wavelength and allows light to access even the choroid and sclera, providing the great imaging depth mandatory for retinal and choroidal imaging [5]. Another important feature of this wavelength is that the zero dispersion point for water exists in this wavelength range [6]. Most of the previously reported Fourier domain OCT (FD-OCT) systems for the 1-μm probing band are based on swept source OCT (SS-OCT) technology [5, 7, 8]. It is still uncertain which is better for ophthalmic retinal imaging, SS-OCT or SD-OCT, and that is one reason why we want to evaluate our full-range SD-OCT system. Although 1-μm SD-OCT is a very pro-mising imaging technique for ophthalmic imaging, implementing a practical system is a challenging task. SD-OCT requires a high-speed spectrometer utilizing a high-speed line camera. Currently, only a few line detectors are available for the 1-μm band, and most of them suffer from a low pixel number, typically less than 1024 pixels. The achievable imaging depth of SD-OCT zdepth is determined by spectrometer’s resolution δλ and the central wavelength λ 0 according to zdepth = (2ln2/π n) (λ 0 2/δλ ), where
A severe problem with SD-OCT, and not only in the 1-μm band, is mirror images which significantly reduce the imaging depth and the signal-to-noise ratio (SNR). As SD-OCT images are calculated from a measured non-complex spectral interferogram, they not only comprise a primary OCT image, but also an autocorrelation image and a spatially reversed complex conjugate image. Coherent mirror images reduce the measurement depth range of SDOCT to less than half the original range. In addition, they decrease the SNR of the measured signal.
To eliminate these artifacts, several techniques including phase-shifting methods [9-23], a polarization based demodul-ation method [24], and a 3 × 3 fiber coupler based method [25] have been proposed. By obtaining the full complex interferogram, the complex ambiguity problems of SD-OCT can be solved. However, for that purpose we have to measure at least two A-scans from the same sampling position with different phase.
When OCT is used for ophthalmic applications, high imaging speed and good tolerance for sample motion is needed. Methods that are based on simultaneous detection of the phase shifted signals [12, 17, 24-25] tolerate the sample movement, mechanical vibration or air fluctuation. Thus, they are quite useful for
The phase of the spectral interferometric signal can also be measured time sequentially to obtain the full complex interferogram. The phase shifting interferometric method [9] requires more than three frames with different phase offset to construct a complex spectrum. Stable phase shift between these frames is required. On the other hand, the phase shifting error caused by sample motion can be corrected [10], but it increases the needed signal processing gratuitously. One of the main problems in ophthalmic imaging is the sample motion and that is the reason why this method is not so suitable for in vivo imaging. The two frame method [11, 13, 16, 22] reduces the number of required frames to resolve complex ambiguity making it faster than the phase shifted interferometric method. The drawback of that two frame method is that it requires exact 90 degree phase shift between adjacent frames. Yet another method for the phase measurement of the spectral interferometric signal is simultaneous B- and M-mode scanning method (BM analysis method) [14-15, 19-21, 27-29]. This method modulates the phase of the probe or reference beam along transversal scanning, and extracts the phase of the spectral interference signal by a digital demodulation of the transversal carrier signal which has been generated by the phase modulation. It is know that the BM analysis method has good tolerance to sample motion, miscalibration of the phase shifting device and chromatic phase shifting error. Because of these advantages, we decided to use the BM-analysis method in our SD-OCT for human retinal and choroidal imaging. The phase modulation is typically performed by a piezoelectric device [14-15] which means that phase modulation is based on mechanical movement of a mirror. Thus the temporal response is quite poor in high speed SD-OCT applications. Another approach to perform phase modulation is based on transverse scanning by a scanner [19-21]. The advantage of this method is that the phase modulation can be performed without any additional components. However, the phase modulation depends on the beam offset on the scanning mirror and the scanning angle. These properties restrict the scanning protocol. To bypass this problem, the electro-optical phase modulator (EOM) is utilized in our system [26]. A stepwise control waveform is used to drive the phase modulator to avoid fringe washout.
In this paper we present complex conjugate resolved 1-μm spectral domain OCT for human retina imaging in vivo. To resolve complex conjugate ambiguity in SD-OCT we modulate the phase of the reference signal using electro-optical phase modulator. The detailed description of our method and experimental setup is presented and experimental full-range images of the healthy and the AMD patient eye are shown. It should be noted that this paper is organized to supplement our previous paper [29] which describes a high-speed full-range ophthalmic OCT applications based on the method described in this paper but does not describe the mathematical details.
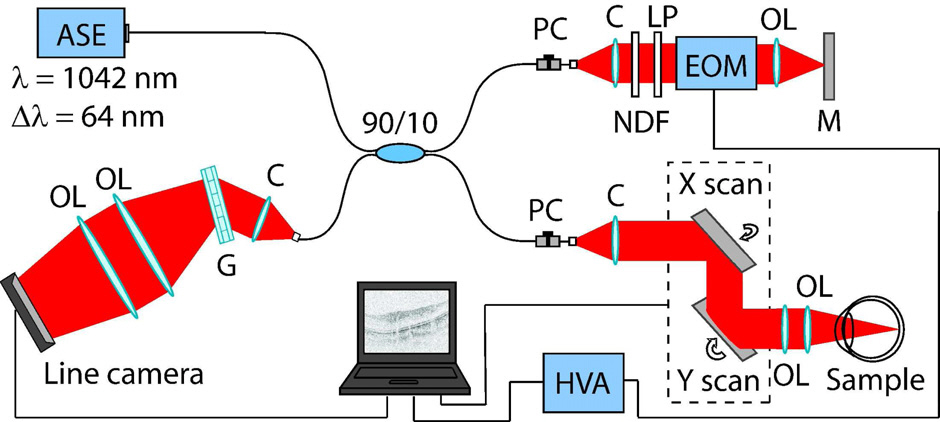
Figure 1 shows the optical setup of our SD-OCT system based on the Michelson interferometer. As a light source, a 1-μm ASE source (NP Photonics) with a bandwidth of 62.3 nm (FWHM) and a central wavelength of 1042 nm is employed. The light beam is split by a 10/90 coupler and 10 percent of the power is coupled to the sample arm and is connected to a semi-custom retinal OCT scanning head based on the TOPCON 3D-OCT 1000 (Topcon corporation, Japan) scanning module. After beam splitting, light passes through polarization controllers placed in the sample and reference arms. The optical probing power on the cornea was 840 μW, which is lower than the ANSI safety standard (ANSI Z136.8-2000). In the reference arm, the beam is collimated and linearly polarized before EOM (Thorlabs, EO-PM-NR-C2). In the measurement arm, the backscattered light and reference signal are combined and guided to a transmission grating (Wasatch Photonics, 1450 lines/mm). A combination of two achromatic lenses (f = 300 mm and f = 150 mm, effective f = 160 mm) is used for spectrum imaging along the horizontal detector area of the line camera
(Sensors Unlimited Inc., SU1024LE, 1024 pixels, 7.69 kHz line rate, integration time 24.4 μs and duty cycle 18.8 %). The axial resolution of the measurement system is 9.6 μm in air.
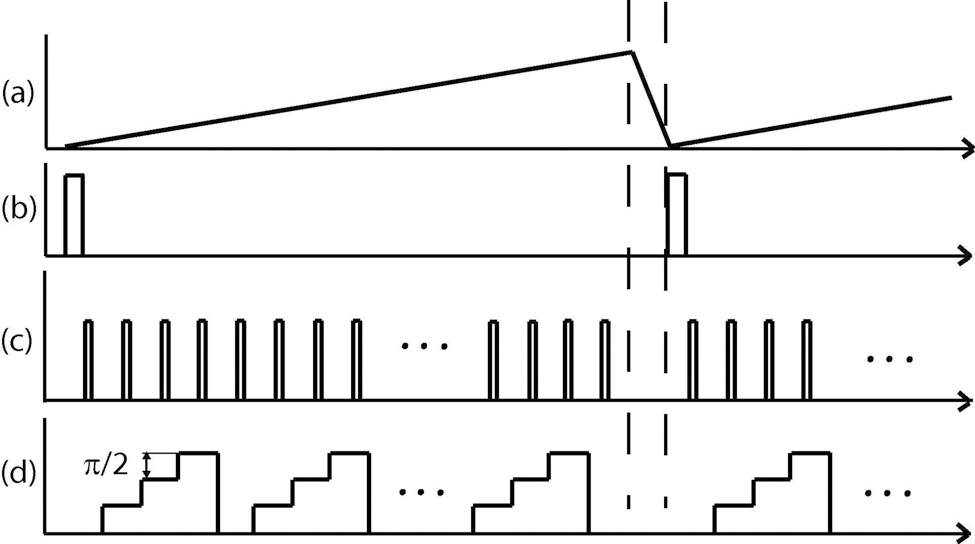
For the proper operation of the SD-OCT system, the data acquisition of the line camera, the scanning of the probing beam and the phase modulation of reference arm have to be synchronized. Control signals are generated by a standard PC running custom built LabVIEW software. EOM control is performed so that the phase step between each A-scan is π /2 rad. The phase of the reference arm is modulated simultaneously as the probing beam scans the sample laterally (B-scan). The spacing of each adjacent A-line is kept smaller than the lateral optical resolution (~20 μm) to be able to separate signal from its complex conjugate signal in the spatial frequency domain. The ratio (spacing/spot size) should be smaller than π /8 and thus the spacing between adjacent A-scans is 2.93 μm. The measurement time to obtain a 2D spectral interferogram is identical with that of a non-complex FD-OCT [14]. Figure 2 presents a time chart used to control the galvano-scanner, the line-camera and the EOM.
Our previously published paper summarized the principle of the complex conjugate resolving method in general [29]. However, a more comprehensive explanation of mathe-matical details is provided here to clarify the method which is employed. As the phase of the reference arm is modulated synchronously with the lateral scanning of the sample, the obtained 2D spectral interferogram ? (
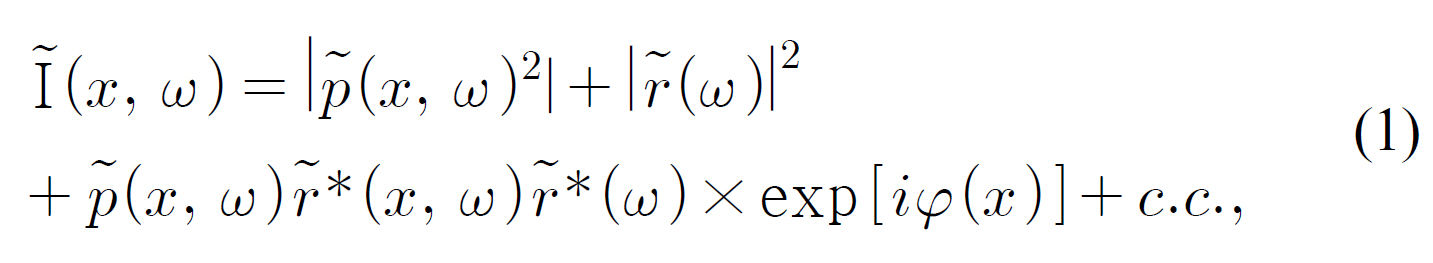
where

and

are the temporal Fourier transforms of the complex profiles of the probing and the reference beams,respectively, φ is the phase offset and * denotes the complex conjugate of the concerned term. The abbreviation
c.c. refers to the complex conjugate of the third term on the right-hand side of this equation. The first two terms are the autocorrelation of the probe beam and the reference beam, respectively. The third term corresponds to the OCT signal, and it is modulated by the exponential term of exp[
where
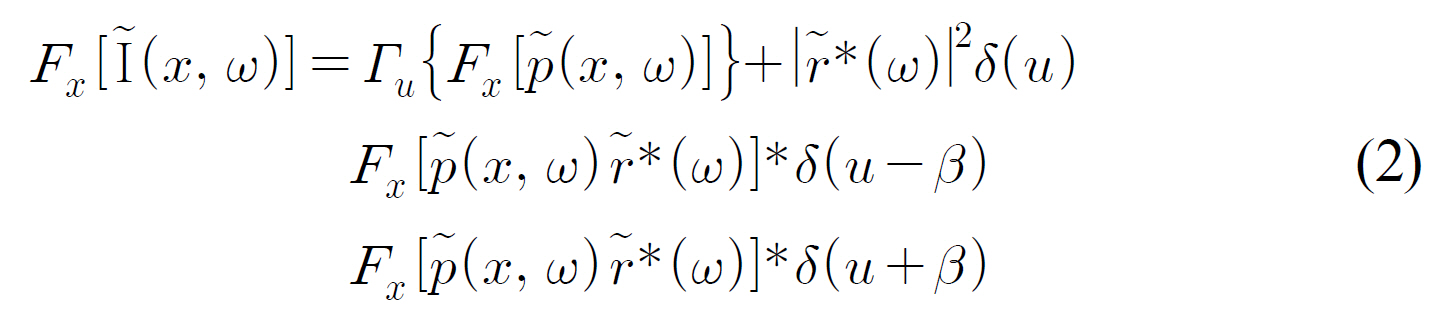
Information on the OCT signal is extracted by using a suitable frequency filter, which clips only the third term of Eq. (2), followed by an inverse Fourier transformation.

As expressed in this equation, the complex 2D spectrum btained is identical to the complex spectra obtained by phase-shifting FD-OCT [9]. Using that 2D complex spectrum allows us to obtain full-range imaging depth.
In order to remove fixed-pattern noise, the measured raw data was filtered. For each image, the spectra with different phase shift (0, π /2, π , 3π /2) were assorted to their own groups. The averaged spectrum for each phase shift is calculated and subtracted from the original spectra with corresponding phase shift [30, 31]. Using that procedure the great fixed-pattern noise rejection in the final OCT image is obtained.
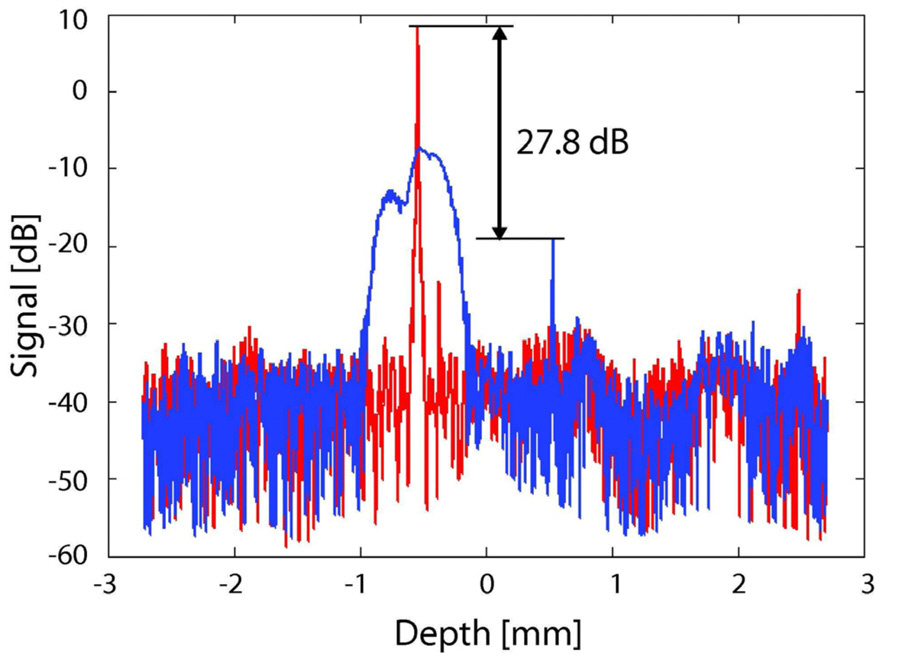
The efficiency of the method used in removing the complex conjugate signal was evaluated quantitatively using a mirror as a sample. Figure 3 shows the obtained results. Both of the red and blue curves were obtained by the same full range measurement but different configuration of numerical dispersion compensation. Since the interferometer used in this study has unbalance dispersion between the sample and reference arms, numerical compensation of dispersion,by which a numerical phase pattern is added to the OCT spectrum, is required. In addition, the numerical phase patterns which compensate the dispersions of the OCT image and mirror image are conjugate to each other. Namely, the numerical phase which cancels the dispersion of the OCT image blurs the mirror image, and vice versa. To fairly evaluate the ability of our full range method, the elimination ratio of the mirror signal is defined by the ratio between the peak intensity of an OCT signal which is numerically dispersion-compensated for itself (red sharp peak in Fig. 3)and that of mirror signal which is again numerically dispersion-compensated for itself (blue sharp peak in Fig.3). Figure 3 shows that our method suppresses the mirror signal by about 27.8 dB at the depth of -0.5 mm and suppresses the autocorrelation signal to the noise level.
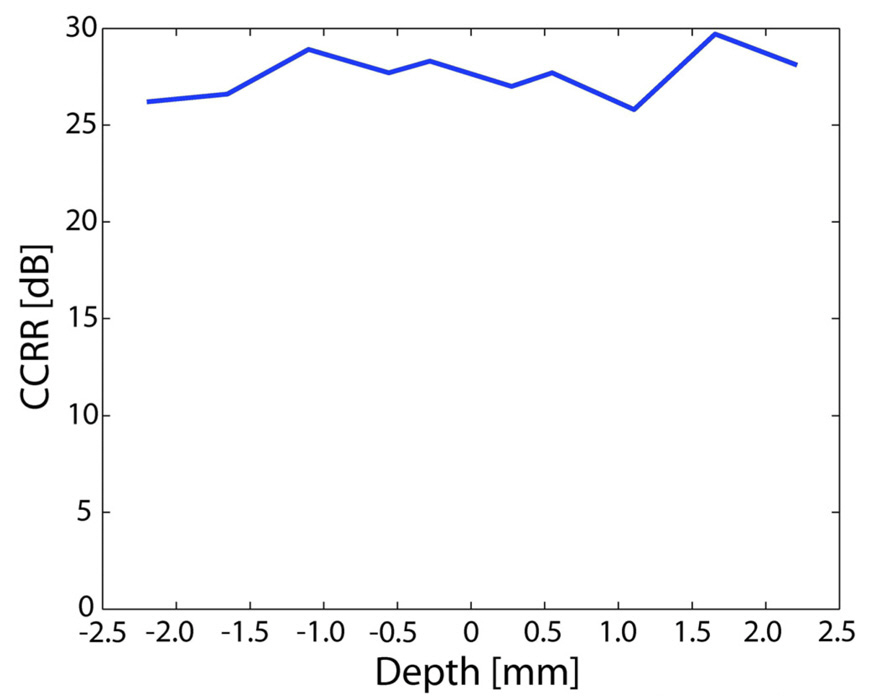
Due to the dispersion of the used EOM, the signal peak obtained from the mirror is distorted. However, by employing a numerical dispersion compensation method, the peak of the OCT signal is sharpened and the conjugate signal peak is further degraded. This property of dispersion further enhances the mirror image extinction ratio. The complex conjugate rejection ratio (CCRR) as a function of imaging depth is shown in Fig. 4.The measured CCRR is almost depth independent.
The acceptable axial motion is calculated to be - 0.11< vz < 0.29 mm/s. This acceptable axial motion is defined as the maximum allowable Doppler frequency at which, in the spatial frequency domain of the transversal scanning, the -3 dB point of the OCT signal overlaps the -3 dB point of the frequency filter which is employed for the BM analysis. If the axial motion exceeds this velocity, the OCT signal shifts out from the spatial frequency filter, and is degraded significantly.
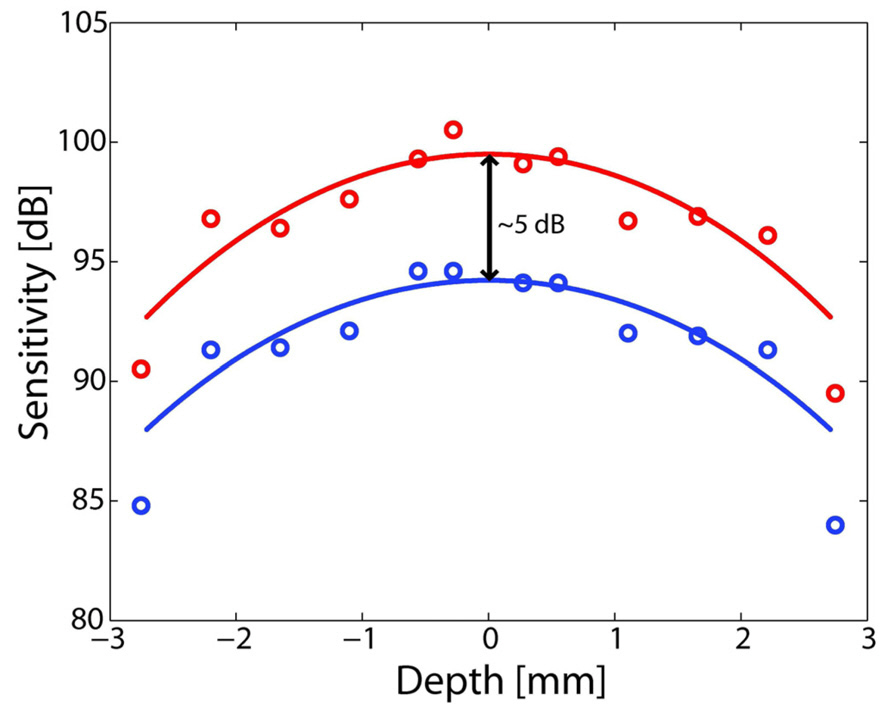
The sensitivity of the SD-OCT device was measured as a function of imaging depth with and without phase modulation in the reference arm. A reflector and a neutral density filter were attached to the sample arm. The single pass sample beam attenuation was measured to be -18.1 dB. The signal of sample mirror is located at delay of 550 μm and 512 A-scans were measured and averaged in intensity to determine the signal strength, while the noise level is determined from the standard deviation of the noise floor. The sensitivity is defined as an attenuation-corrected SNR. The obtained results are shown in Fig. 5. The sensitivity gain achieved exceeded 3 dB and was found to depend on the frequency filter bandwidth. The measurement results are fitted by theoretical sensitivity decay curves [32]. Since this method is based on band-width limitation, sensitivity is increased due to a reduction in noise power. In our experiments, average sensitivity increased by 5.12 dB if our phase modulation method is used. The detailed theory of this sensitivity gain is described in Ref. 29.
Full range imaging also enables the sample measurement at zero delay position where the SNR reaches its maximum. This is because the effect of depth-dependent signal degradation is minimized. Assuming that the 2.0-mm effective imaging depth is needed, the measured OCT signal will be decreased about 11 dB if half-range imaging is performed. The corresponding signal degradation of full-range imaging will be less than 4 dB. Taking into account the effect of average sensitivity increment of our method and lower depth dependent signal degradation, more than 12-dB sensitivity improvement can be achieved over 2-mm imaging range compared with half-range imaging.
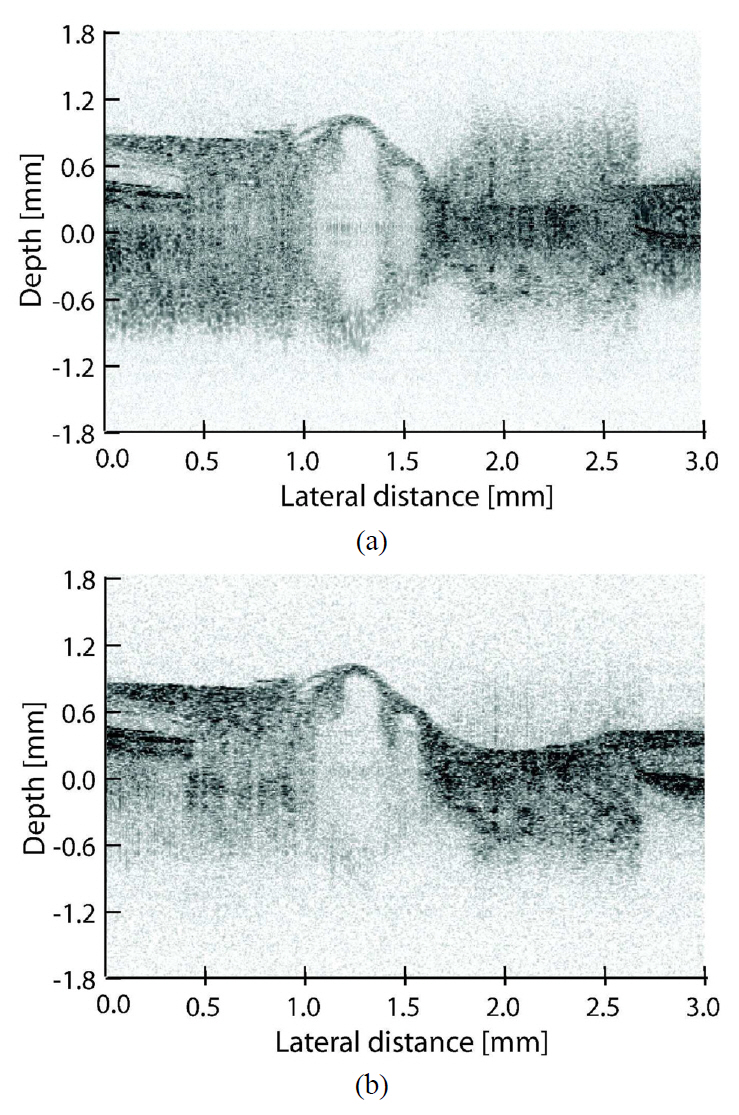
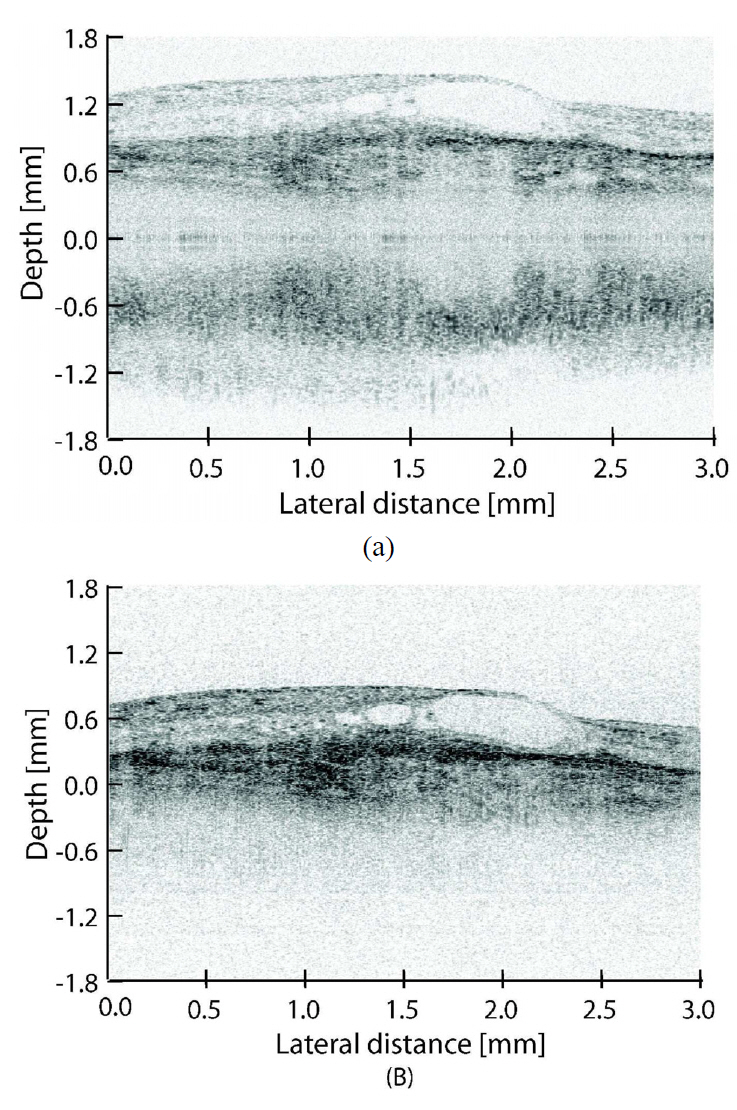
To demonstrate the effect of eliminating the mirror image of this SD-OCT, a normal eye of an Asian male was measured in the normal and mirror-image elimination modes. Figure 6 displays the measurement results. Both cross-sectional images comprise 1024 A-scans, and the width of the measured line was 3 mm. Moreover, with a dynamic range of 45 dB and a minimum value of 5 dB subtracted from the noise floor, the images are fully comparable. Although Fig. 6 shows only the region-of-interest (ROI) of 3.6 mm, the maximum imaging depth was 5.4 mm. In the normal mode (A), the ROI is close to the zero delay and thus the autocorrelation images and complex conjugate image disturb the image quality. This means that if half range imaging is performed, the ROI has to be located sufficiently far from the zero delay. Thus, the effective imaging depth is less than half of the original (2.7 mm) which is not always sufficient for the study of pathologic eyes. However, mirror image elimination mode (B) solves the problem, enabling a clear visualization of the retina and choroid with sufficient imaging range.
As we already mentioned, the requirements for OCT system are typically much higher for investigation of pathologic eyes. Thus the macula of an Asian male with AMD was
measured in the normal and mirror-image elimination modes to demonstrate the applicability of our system to real patient imaging. Figure 7 shows the measurement results. The imaging was performed with similar settings to the normal eye measurement except that the ROI in normal imaging mode is shifted away from zero delay. This is done to minimize the effect of complex conjugate and autocorrelation artifacts on the ROI. Comparing the images obtained using normal mode (A) and mirror image elimination mode (B), it can be seen that the contrast is decreased in normal mode imaging because the sensitivity of SD-OCT is imaging depth dependent.
The development of the high-speed and 3D version of this system is now in progress. We believe that this high-speed property reduces the problems of the fringe washout and improves the modulation phase stability among B-scans. Because of these advantages, the measurement stability of our system will be improved. In addition, we expect that almost no missing frames exist in the 3-D OCT volume making that system very effective for retinal imaging
In summary, a full-range 1-μm SD-OCT device was demon-strated. A complex conjugate resolved OCT signal was
obtained by modulating the phase of the reference signal using an electro-optical modulator. A comprehensive mathe-matical explanation of the complex conjugate resolving method that was used was provided. The measurements performed on a normal and AMD eye proved that this method is applicable to practical ophthalmic studies.


![Complex conjugate rejection ratio as a function ofdepth. Measured sensitivity of SD-OCT as a function of measurement depth. Blue without phase modulation red with modulation. The measurement results are fitted by theoretical sensitivity decay curves [31].](http://oak.go.kr/repository/journal/10704/E1OSAB_2011_v15n2_111_f004.jpg)
![Measured sensitivity of SD-OCT as a function of measurement depth. Blue without phase modulation red with modulation. The measurement results are fitted by theoretical sensitivity decay curves [31].](http://oak.go.kr/repository/journal/10704/E1OSAB_2011_v15n2_111_f005.jpg)