An understanding of the distribution of trace gases is required for constructing chemical transport models in urban areas. However, it is difficult to monitor the dispersion and distribution of ambient trace gas species. It is especially challenging to identify the spatial distribution of trace gases emitted from moving sources in an environment that contains complex structures, such as urban sites, for which high spatial and temporal resolution is required to identify the spatial distribution of pollutants. Many recent studies have demonstrated that both passive and active optical remotesensing techniques can be applied to monitor trace gases with high temporal and spatial resolution [1-11].
Passive remote sensing techniques, which utilize scattered sunlight as a light source, have been widely used to monitor various trace gas species at sites for which access is limited. This approach has the advantage of recording light signals in any direction, because of the utilization of ubiquitous scattered sunlight. This is in contrast to other types of remote sensing techniques, including FTIR, for which the viewing direction is limited because direct natural light sources are used, such as direct sunlight. In addition, passive remote sensing techniques can only provide trace gas information in terms of column density because information on the light traveling distance between the detector and the last scattering location is unknown. Consequently, information on the light path length is important because it enables the conversion of the column density of trace gases to the volume mixing ratio. The merit of combining scanning spectrograph and transmissometer measurements is capability of retrieving surface trace gases in a distance of several kilometers in 360o horizontal directions. Additionally, mixing ratios of multi gases such as NO2, SO2, and HCHO can be simultaneously derived while in-situ monitors need the number of instruments to measure the corresponding number of trace gases.
In this study, we describe simultaneous measurements of traffic NO2 mixing ratios using a scanning spectrograph system and transmissometer. The proposed measurement technique is applied to a traffic road site in Gwangju, Korea. The accuracy of the obtained data was assessed by comparison with data measured by an
II. MEASUREMENTS AND NO2 RETRIEVAL
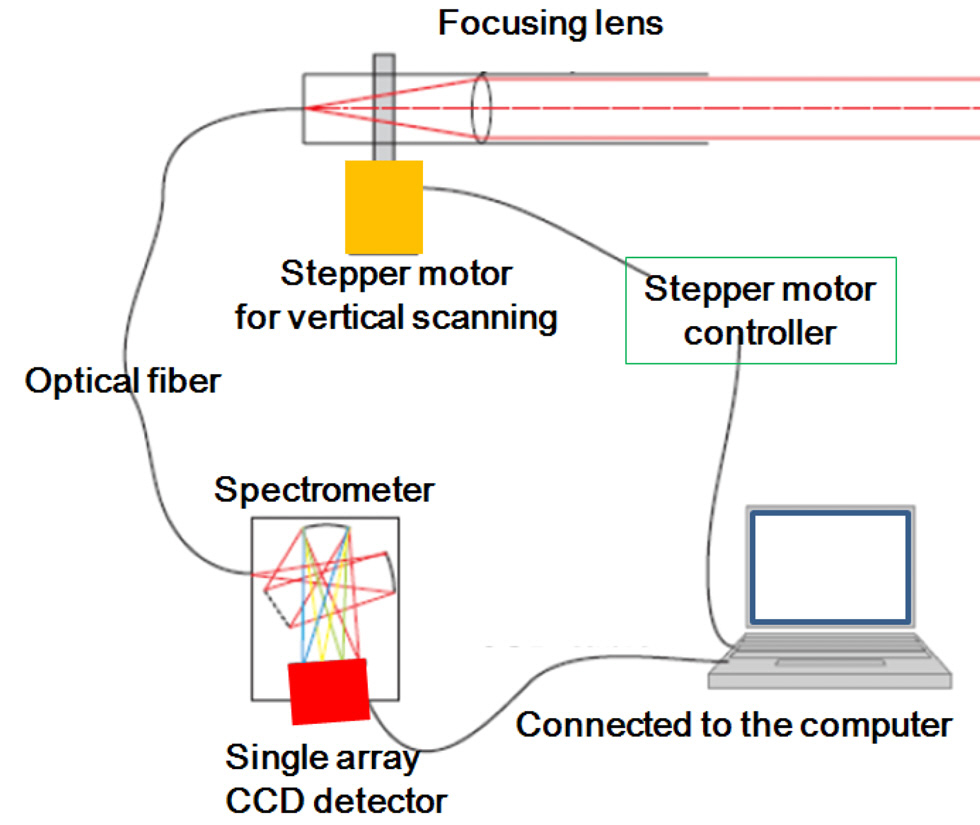
The measurement system consists of a transmissometer and a scanning spectrograph equipped with a single array CCD detector. The scanning spectrograph device is composed of entrance optics, a small Czerny?Turner spectrograph, and a stepper motor unit (Fig. 1). The entrance optics consists of a quartz lens coupled to an optical fiber. The lens, which collects the scattered sunlight into an optical fiber, has a focal length of 40 mm and diameter of 20 mm. The optical fiber transfers the collected light onto the spectrograph entrance. The spectrograph (Ocean optics USB2000) covers the wavelengths between 289 and 431 nm with a spectral resolution of 0.7 nm on a charge coupled device (CCD) detector (Sony ILX511, 2,048 pixels). A Peltier cooler was attached to a spectrograph plate to reduce the dark current of the CCD detector and to maintain a constant spectrograph temperature (5±0.5℃).
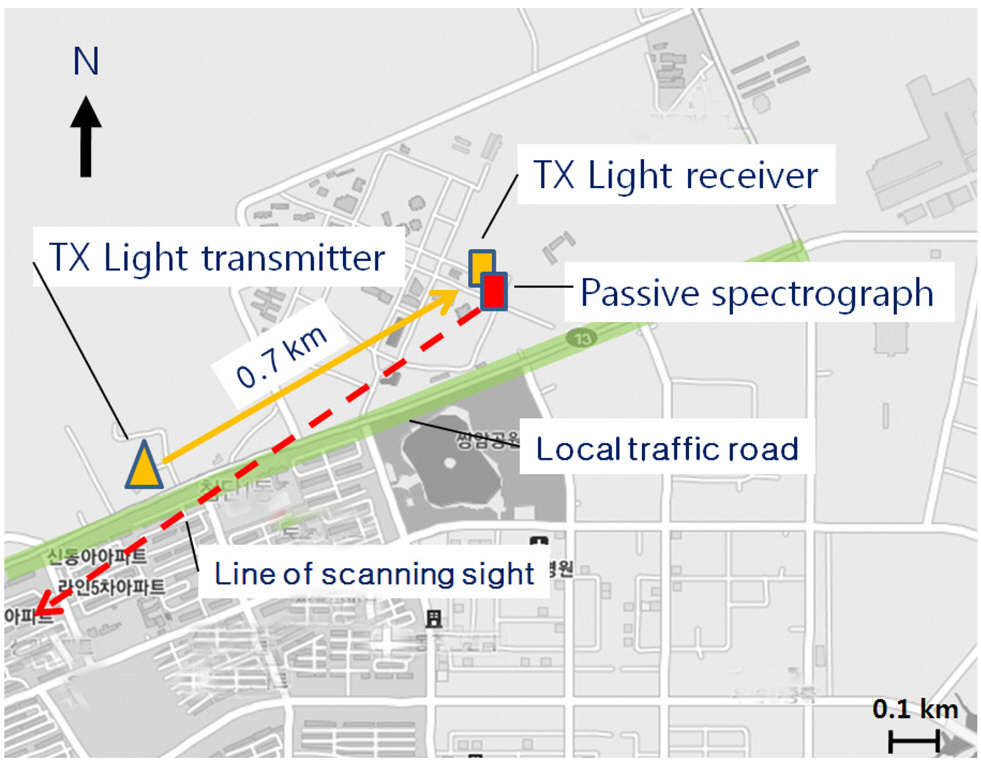
Light extinction coefficients were obtained using a transmissometer (LPV-2, OPTEC) comprising a light transmitter and a receiver. The light receiver was installed near the site of the UV spectrograph, while the light transmitter was located at 0.7 km from the light receiver, across a local traffic road (Fig. 2). The transmissometer provided light extinction information centered at a wavelength of 550±50 nm [13]. The transmissometer measurements were performed concurrently with the scanning spectrograph measurements.
The scanning spectrograph system was operated for approximately 1 month, from 1 May to 4 June 2009 in Gwangju, Korea.The scanning spectrograph device was operated between 06:00 and 18:00 local time (LT) on the rooftop of the Advanced Photonics Research Institute building (35.13°N,126.50°E). The viewing azimuth angle of the spectrograph scanner was 237°, pointing across a local traffic road. The scanning spectrograph was installed in an aluminum box connected to the stepper motor, which allowed the device to sequentially record scattered sunlight signals at elevation angles (EAs) of 3°, 10°, 20°, 30°, and 90° above the
horizon during the measurement period. Scanning by the spectrograph was performed hourly in an automated measurement loop, with each loop taking 10?20 minutes to scan the prescribed EAs. The measured spectra were analyzed to quantify the NO2 slant column density (SCD) based on the specific structured absorption features in the UV wavelength range [14].
Since the transmissometer measures light extinction coefficient at 0° EA, it would have been best for the spectrograph to record spectra at 0° EA in order to reduce discrepancy in measurement geometries. However, spectra measured at 3° EA are best in terms of representing surface NO2 since lower EAs than 3° could possibly have led to shortened light path length along the lines of sight due to nearby surface obstacles with 0.43° filed of instrumental view. NO2 SCDs were derived by analyzing the recorded scattered sunlight signals collected at 3° EA, based on the DOAS technique [14?16]. The dark current and offset signals of the single array CCD detector, recorded before and after daily measurements, were removed from each of the collected scattered sunlight spectra. The pixel to wavelength calibration of the spectra was performed by fitting the collected spectra to a solar reference spectrum [17]. The wavelength interval between 390 and 417.5 nm was used to retrieve the NO2 SCDs. The spectrum recorded at around noon on May 28 was used as the reference spectrum. A 2nd-order polynomial was fitted to the data to account for broadband structured attenuations, including Rayleigh effects due to air molecules and Mie scattering due to atmospheric aerosol.Ring spectra [18] accounting for rotational Raman scattering effects were calculated from the reference spectra using the DOASIS software developed by Heidelberg University, Germany. NO2 reference absorption cross-section spectra [19] were convoluted with the instrumental function to adapt the spectral resolution of the scanning spectrograph system, as described previously [14].
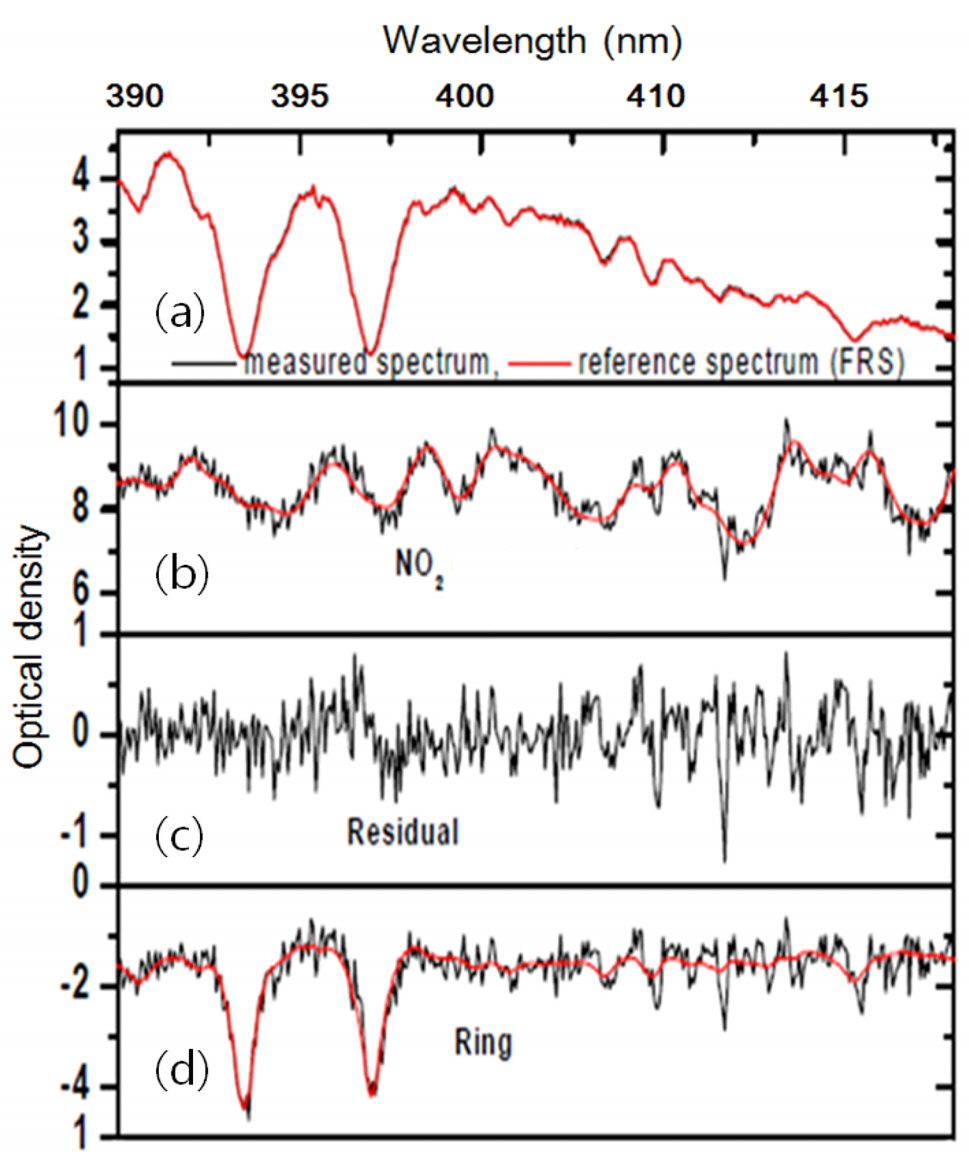
Fig. 3 shows an absorption cross-section of NO2 [18], the reference spectrum, and the ring spectrum simultaneously fitted to the measured spectra using WinDOAS V2.10[20] based on a nonlinear least-squares method [14, 21].
SCDs were then obtained from the following equation.
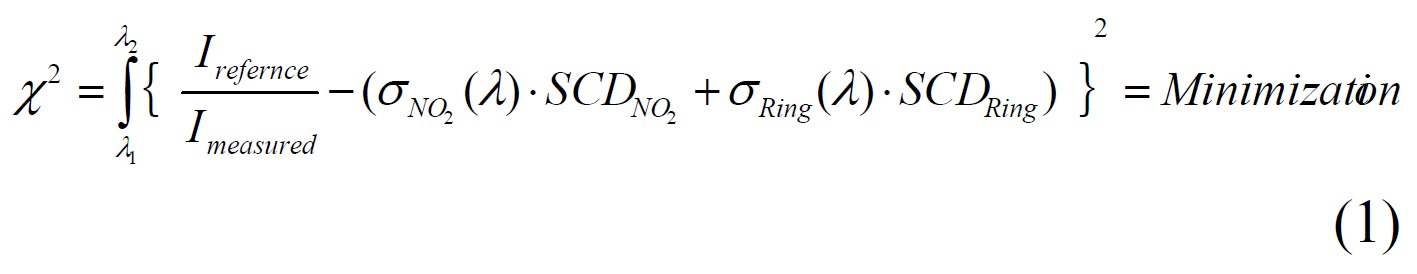
where Ireference and Imeasured denote a reference and measured spectrum, respectively. Examples of Ireference and Imeasured are plotted in Fig. 3 (a). In Eq. (1), σNO2 and σRing denote a respectively and SCDNO2 and SCDRing denote unknown NO2 and Ring slant column densities, respectively. A NO2 absorption cross section (σNO2) and calculated ring spectrum (σRing) multiplied by unknown NO2 and Ring SCDs, respectively are plotted in Figure 3(b) and (d), respectively. Eq. (1) can
be solved using the nonlinear least-squares (NLLS) method [13, 20]. In Eq. (1), τResidual, an example of which is plotted in Fig. 3 (c), accounts for residual from NLLS optical density fitting using Eq. (1).The measured spectra at 3° EA were evaluated with the zenith spectrum (α = 90°) in the same measurement loop,

where SCD(
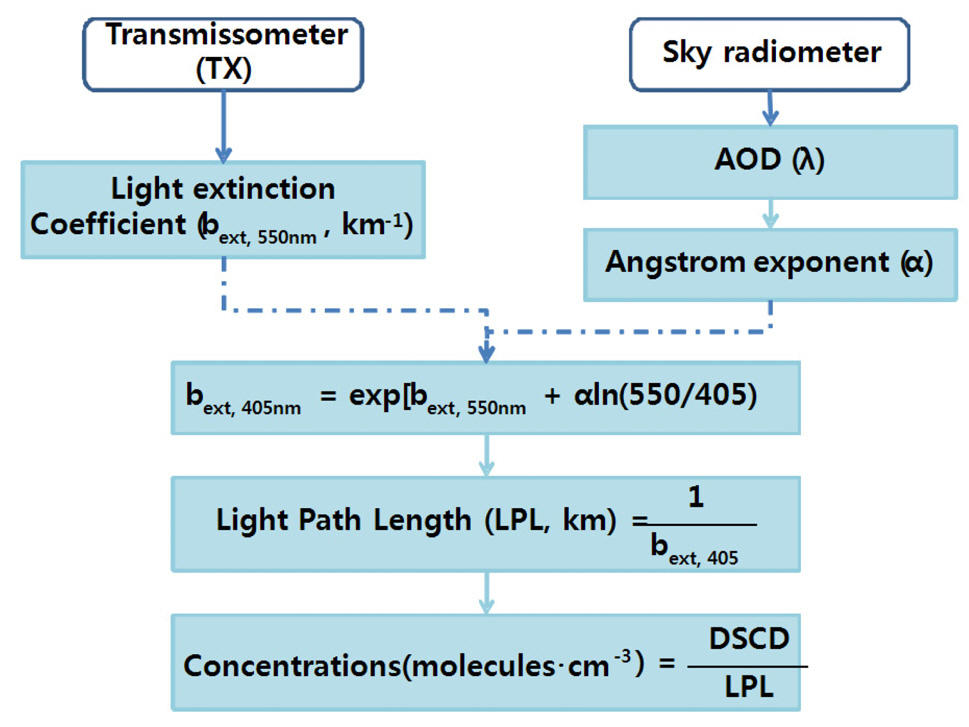
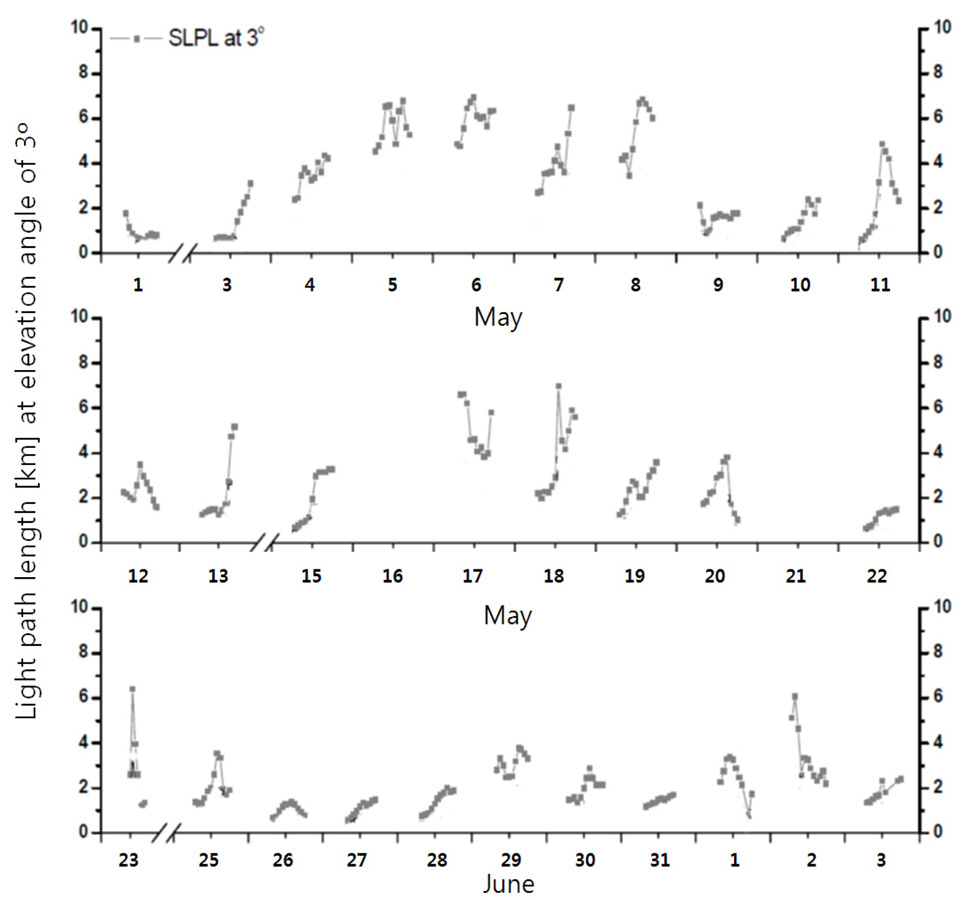
Fig. 4 shows the procedure for retrieving the NO2 volume mixing ratio based on the NO2 DSCD and the light extinction coefficient. The light path length was obtained using 1/bext at 405 nm (Fig. 5). The NO2 volume mixing ratios were then derived by dividing the NO2 DSCDs measured at an EA of 3° by the light path lengths, and multiplying the resulting concentrations by a constant for conversion of concentration into mixing ratio. Angstrom exponent information,
as obtained from sunphotometer measurements, was also included to convert the light extinction coefficients at 550 nm to those at 405 nm. However, information on the Angstrom exponent is not necessary if the transmissometer provides the light extinction coefficient at a wavelength that is also covered by the scanning spectrograph device. The errors associated with obtaining LPL can be reduced if a transmissometer provides the light extinction coefficient at a wavelength that is also covered by the scanning spectrograph.
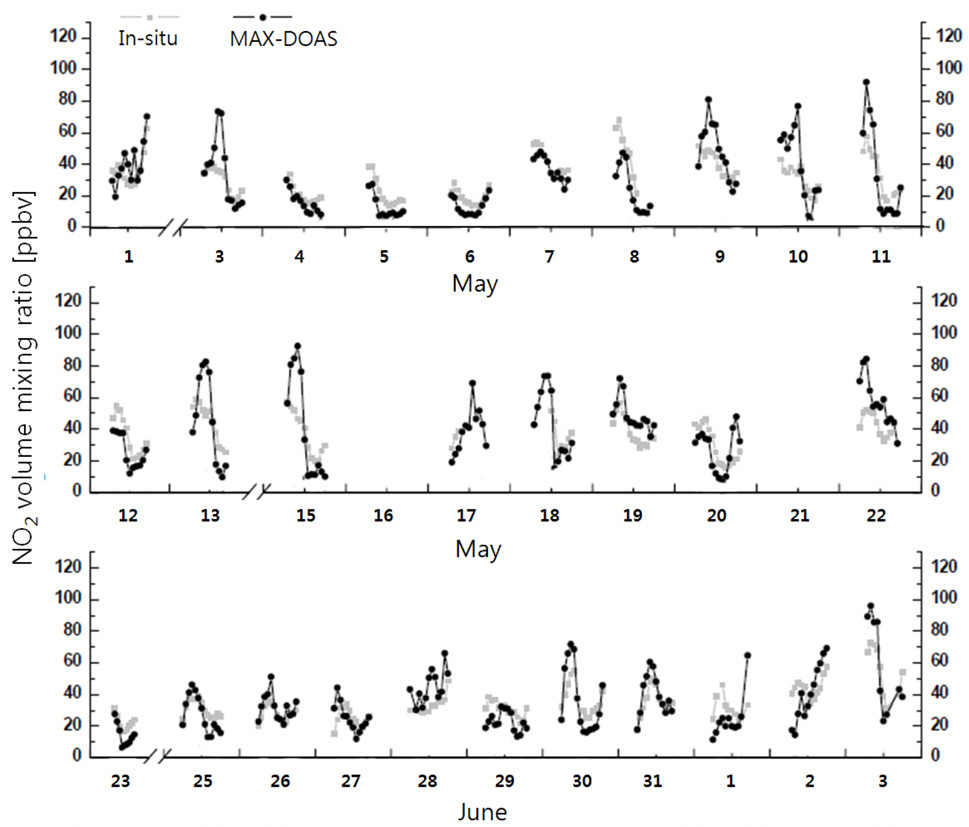
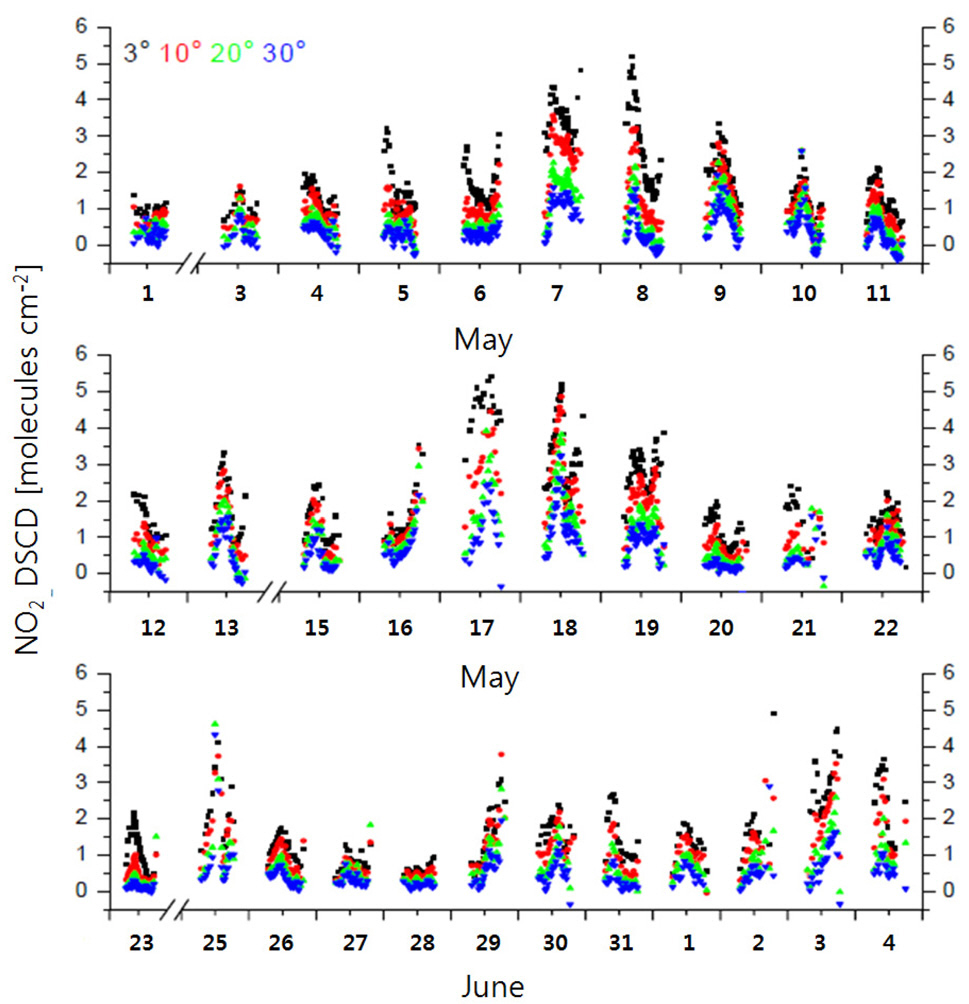
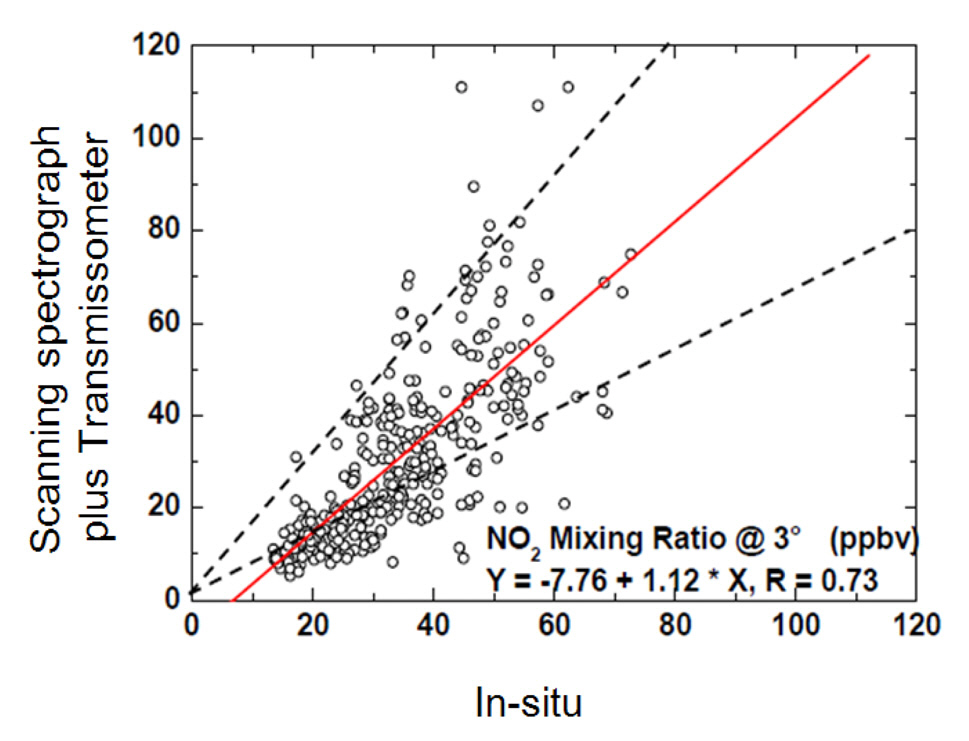
Fig. 6 shows temporal variations in the NO2 DSCDs retrieved at an EA of 3° during the measurement period. The maximum and minimum NO2 DSCD values were 5.70× 10¹⁷ and 4.83 × 10¹⁶ molec cm?2, respectively. Fig. 7 shows temporal variations in the NO2 volume mixing ratio measured by the scanning spectrograph and by the
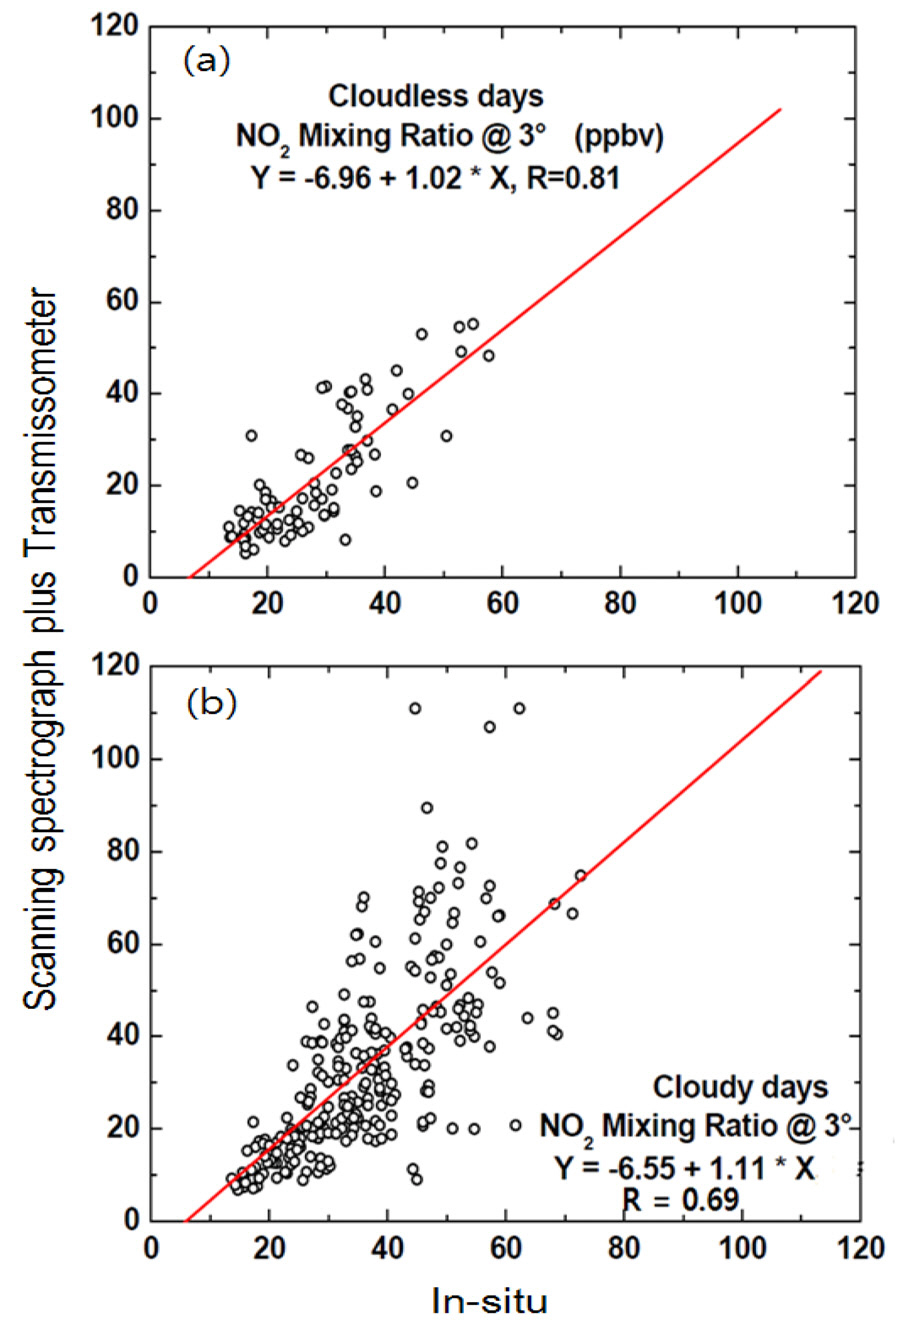
To assess the performance of the simultaneous measurement technique under cloudy conditions, we compared the NO2 volume mixing ratios obtained from the scanning spectrograph and the
Fig. 9(b) shows the NO2 volume mixing ratios obtained from the scanning spectrograph plotted against those measured
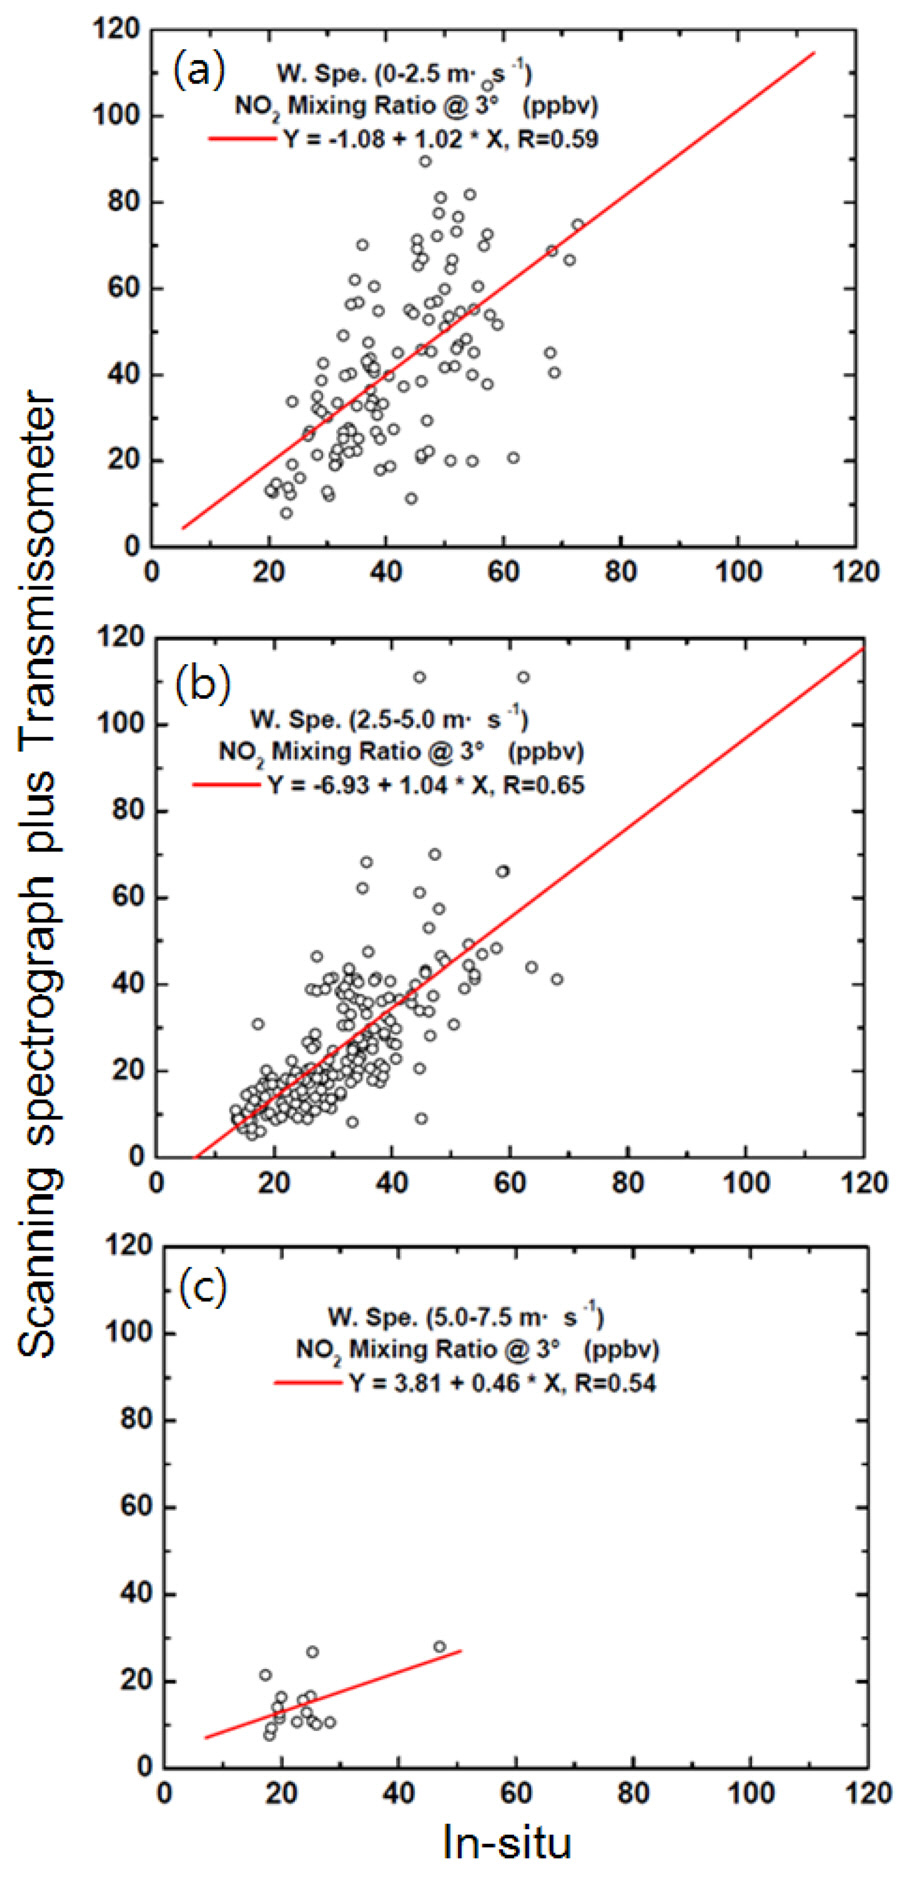
We also assessed the influence of wind speed on the discrepancy between the NO2 volume mixing ratios obtained from spectrograph measurements and in situ measurements, considering three ambient wind speeds (Fig. 10). The highest correlation coefficient of 0.65 was obtained under moderate wind speeds (> 2.5 and < 5.0 m s?1). The results indicate that NO2 is not homogeneously distributed under stable atmospheric conditions (< 2.5 m s?1; Fig. 10(a)) or during strong winds (5.0-7.5 m s?1). NO2 may be diluted by strong winds, resulting in reduced ambient NO2 concentrations, as shown in Fig. 10(c), and resulting in heterogeneous NO2 distributions over the measurement site.
Error sources consist of the spectrum fit error and transmissometer measurement error. In order to estimate the total errors which consist of those two error sources, error propagation analysis was employed as follows:
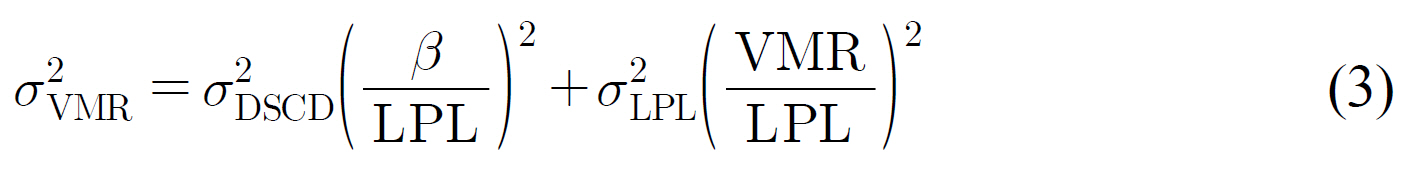
where σVMR, σDSCD, and σLPL indicate errors of the retrieved NO2 volume mixing ratio, spectrum fit error, and relative
error of 13% associated with transmissometer measurements[22], respectively. β, LPL, and VMR are the unit conversion constant, light path length, and volume mixing ratio, respectively. The NO2 DSCD error comes from residuals of spectrum fit procedures while the LPL error of 13% comes from the uncertainty in Angstrom exponent as well as systematic uncertainties. The errors during the entire measurement period were calculated to range from 12 to 17% of the derived NO2 volume mixing ratios which was estimated

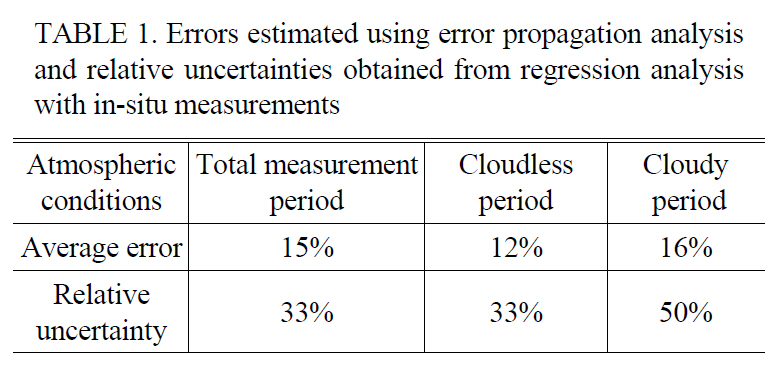
Errors estimated using error propagation analysis and relative uncertainties obtained from regression analysis with in-situ measurements
using Eq. (3). The average errors during the entire measurement, cloudless, and cloudy periods were estimated to be 15, 12 and 16%, respectively as shown in Table 1. The relative uncertainties during the entire measurement, cloudless, and cloudy periods were estimated to be 33, 33 and 50%, respectively as shown in Table 1.
Ambient NO2 volume mixing ratios were retrieved at an urban site in Gwangju, Korea, based on simultaneous measurements using a scanning spectrograph device and transmissometer. Although the retrieved NO2 volume mixing ratios may require additional validation, they are in good agreement with the ratios obtained from