Aerosols play a major role in weather, climate, and environmental issues. They have been considered to be the largest contribution to the total uncertainty of the radiative forcing due to direct and indirect effects. Obviously the present understanding of the aerosol properties and distribution is far from adequate, and a high spatial resolution measurement of the vertical distribution of aerosols is a very important input parameter for determining the aerosol radiative forcing (ARF) [1, 2].
CALIPSO with Cloud-Aerosol LIDAR with Orthogonal Polarization (CALIOP) has been sent into the A-Train constellation, for providing global distributions of aerosol and clouds with high resolution [3]. Ground-based LIDARs can be more sensitive than satellite LIDARs and so can be used to confirm the sensitivity limits of the satellite instruments and characterize the atmospheric feature missed by the satellite instrument [4]. Ground-based LIDAR providing stable, long-term measurements will be necessary to provide a benchmark against which to reference multiple satellite instruments [1]. Long-term observations of the aerosol vertical distribution also can suggest the long-term manmade trend in the concentration of aerosol, which is a main objective of GAW and GALION [1].
A Mie scattering LIDAR has been operated for profiling tropospheric aerosol since 1998 in Hefei (31.9°N, 117.2°E) [5, 6]. Hefei is in the region between the Huaihe River and the Yangtse River, in the vicinity of the Yangtse delta. The Shouxian National Climate Observatory is about 80 km north of the LIDAR site. LIDAR observations of tropospheric aerosol from 1998 to 2009 are presented in this paper. Characters of vertical distribution and temporal variation of tropospheric aerosol over Hefei are derived from long-term observations, and the impacts of natural source and human activities on the aerosol vertical distribution over Hefei could be seen clearly.
In this paper, the LIDAR and measurement methods are introduced in section 2, data processing is described in section 3, results are presented and discussed in section 4, and some conclusions are given in the last section.
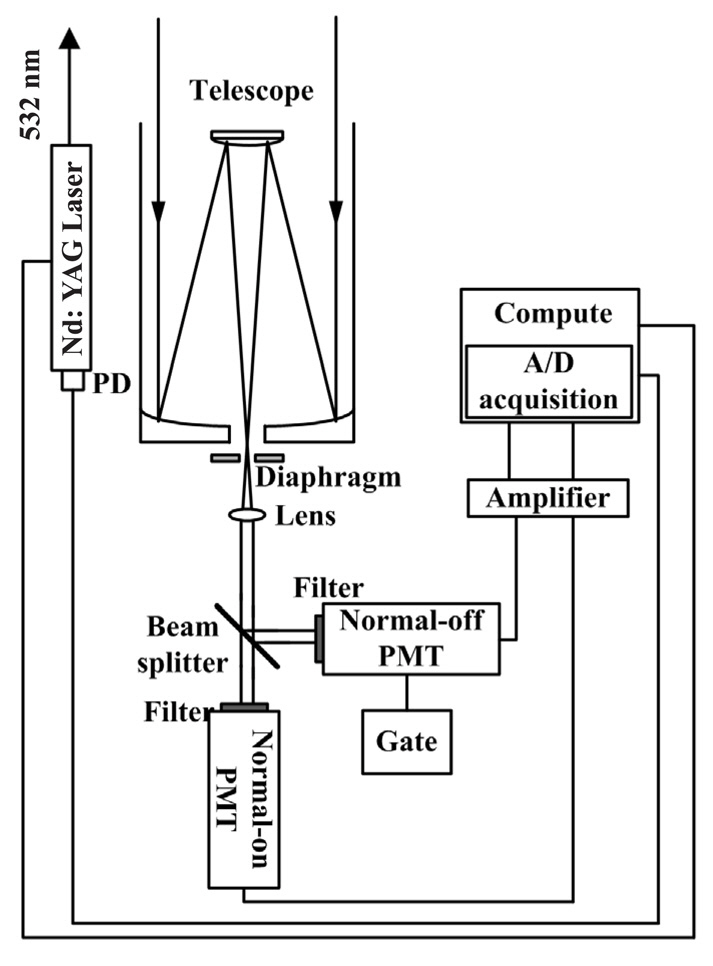
In order to study the vertical distributions of tropospheric aerosol, a Mie scattering LIDAR was developed in the Key Laboratory of Atmospheric Composition and Optical Radiation (LACOR) in Anhui Institute of Optics and Fine Mechanics (AIOFM), Chinese Academy of Sciences. The schematic diagram of the Mie scattering LIDAR is shown in Figure 1. The LIDAR is based on a Nd:YAG laser, with a second harmonic generator. The pulse energy at 532 nm is generally kept around 70 mJ with a repetition frequency of 10 Hz. The receiving telescope is a 0.3 m diameter Cassegrain, which can be rotated from horizontal pointing to vertical pointing. Received backscattering signal from telescope is divided into two beams using a beam splitter. The weaker beam is detected by a normal-on PMT, and the output is the return signal from near-field range. The other beam is detected by a normaloff PMT, which is controlled by an electric gate to reject echoes below about 2 km to prevent saturation, and the output is the return signal from far-field range. The output signals from two detectors are acquired in A/D mode. The LIDAR is controlled by an industrial computer.
The LIDAR was located on an island in Dongpu Lake, approximately 10 km northwest of the center of Hefei. The lake is surrounded by farmland and several villages, thus the atmosphere above the LIDAR site can be considered to be the background atmosphere of Hefei. The altitude of the LIDAR site is about 30 meters above sea level (ASL). In the spring months, northern and northwestern cold front activities often come in, and the dust particles can be taken from the north to Hefei along the cold air mass. In the summer months, southwest current or Pacific high pressure
bring warm and wet air masses into the Hefei area, both aerosol particles and moisture tend to be confined in the mixing layer. In autumn-winter months, north and northwesterly currents with cold, clean and dry air masses usually prevail over Hefei, and the atmosphere is very stable during these months.
LIDAR observations are scheduled depending on weather conditions. Routine LIDAR observations are taken in cloudless nights. When semitransparent clouds, which could be penetrated by laser, exist in the upper troposphere, the observations are also taken.
In order to reduce the noises in the signals received by the LIDAR , the data processing is generally based on an average of 10000 single-shot profiles with a vertical resolution of 30 m. Two signal profiles without background signals from the near-field range and far-field range are joined together to get a signal profile extending from ground level to 18 km above ground level (AGL). Sonde data indicate that the height of the tropopause over Hefei varies from about 10 km to 18 km.
The Fernald method is applied to the joined signal profile to retrieve the aerosol backscatter coefficient [7], and three assumptions have to be made [5]: (1) The extinctionto-backscatter ratio (i.e. LIDAR ratio) for tropospheric aerosol is assumed constant with altitude and equal to 50 sr at 532 nm wavelength; (2) Molecular backscatter coefficient and extinction are calculated from a standard atmosphere model using Rayleigh scattering theory; (3) The boundary value is determined by assuming the aerosol backscattering ratio to be 1.01 for 532 nm at calibration height, where the atmosphere is very clean, calibration height is often determined around the tropopause according to LIDAR received signal with range-square and molecular backscatter corrections. Bosenberg et al. indicate that the error of the retrieved aerosol backscatter coefficient using this method is about 15% [1].
As there is incomplete overlap between the laser beam and the receiver field of view in short range, echoes from short range will be received incompletely by LIDAR. The geometrical form factor (GFF) accounts for signal loss due to the poor receiver efficiency of the telescope and associated optics in this range. Aerosols in this range are so important that overlap correction has to be applied to the LIDAR received signal by dividing the LIDAR received signal by GFF. GFF is determined experimentally when the LIDAR is oriented horizontally [8-10]. After the overlap correction, the LIDAR can be used to measure the aerosol backscatter coefficients and extinctions (calculated by multiplying backscatter coefficients by assumed LIDAR ratio) from 30 m to 18 km AGL, and aerosol optical depth(AOD), which is defined to be the integration of aerosol extinction along the path ranging from ground level to 18
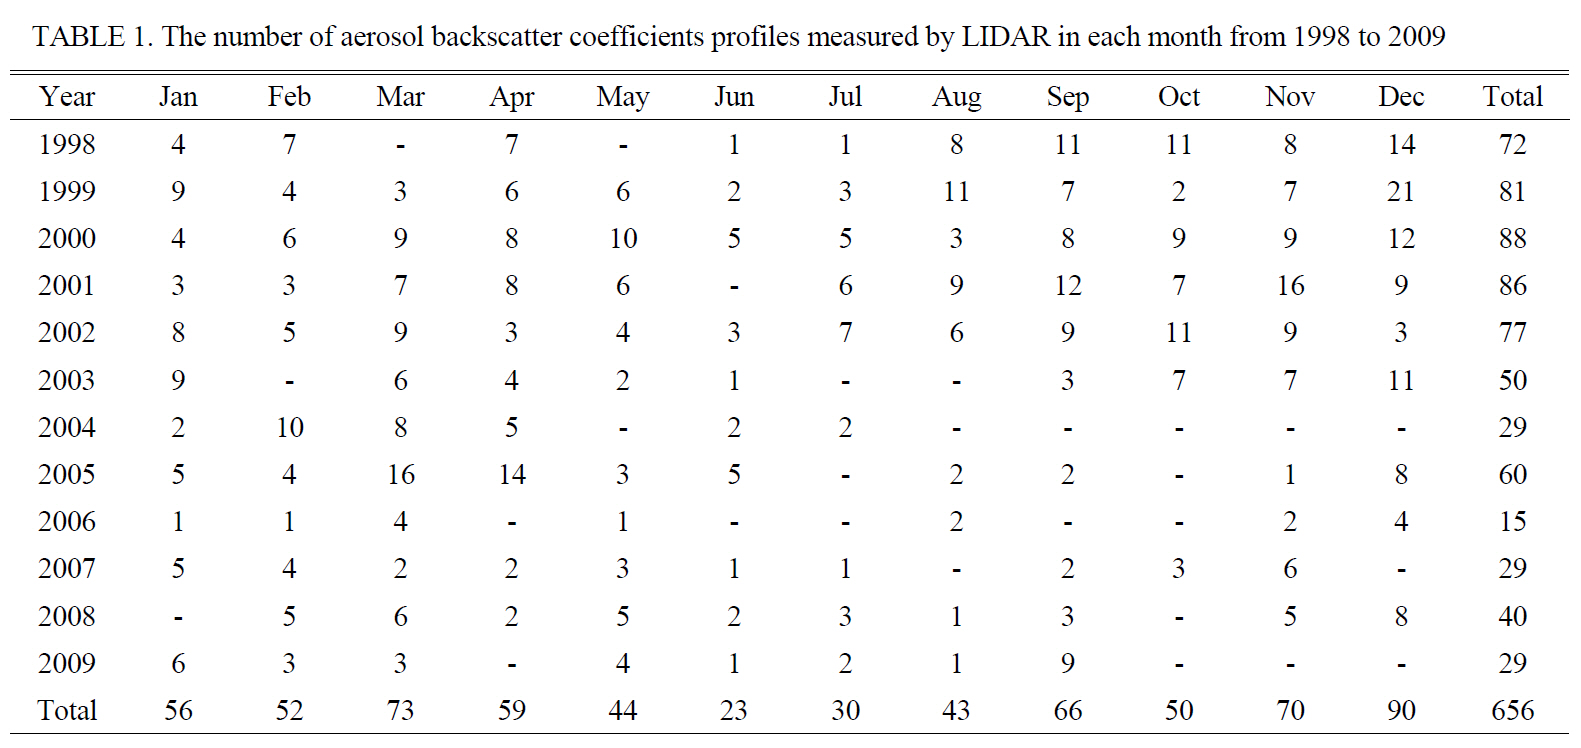
The number of aerosol backscatter coefficients profiles measured by LIDAR in each month from 1998 to 2009
km AGL in this paper, also can be measured by the LIDAR [5, 6].
In order to eliminate the overestimation of aerosol backscatter coefficients caused by clouds in the upper troposphere, only LIDAR observations taken in cloudless nights are selected to be analyzed in this paper, and only one profile is selected in one night. Finally, 656 profiles of aerosol backscatter coefficient are selected from LIDAR observations from 1998 to 2009. The number of selected profiles in each month from 1998 to 2009 is listed in Table 1.
As seen in Table 1, the numbers of the profiles in different months are quite different, in order to eliminate its effect on the statistical results, the profiles in each month are averaged first, and the following analyses are based on these averaged profiles.
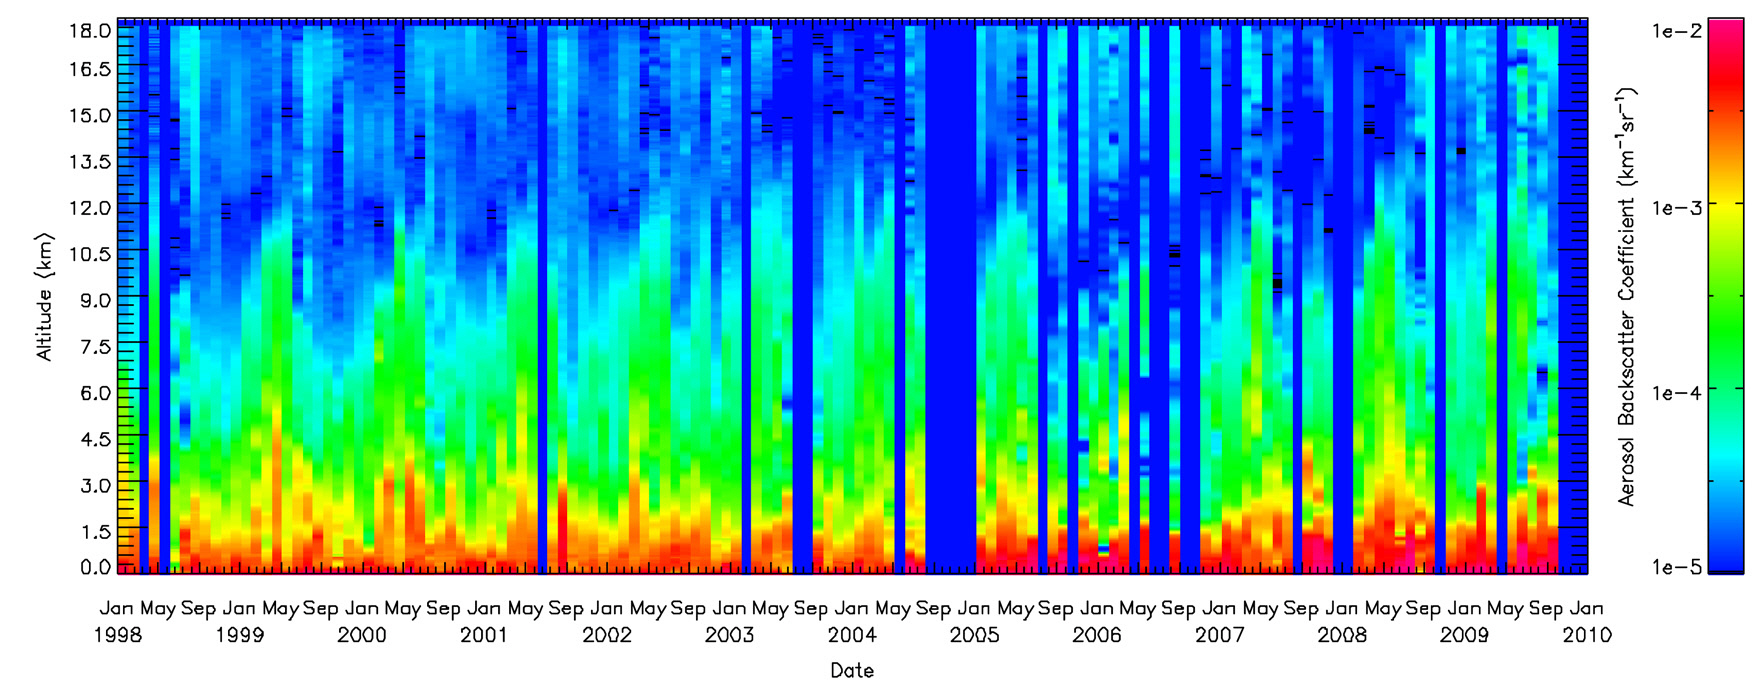
Figure 2 shows mean profiles of tropospheric aerosol backscatter coefficients at 532 nm for each month from January 1998 to September 2009. Although observations in several months are missed due to bad weather conditions and technical improvements of LIDAR, 117 monthly mean profiles obtained in the past 12 years are very valuable for studying temporal variation of tropospheric aerosol.
As seen in Figure 2, three conclusions could be summarized as below:
i. Tropospheric aerosols are mainly confined below about 3 km AGL;
ii. A seasonal movement of particles into the free troposphere from below is evident, indicating what appears to be a tongue of large aerosol backscatter coefficients that extends upwards from about 3 km AGL;
iii. Aerosol backscatter coefficients in the mixing layer after 2005 seem a little greater than the ones before 2005.
The aerosol incursions into the free troposphere show regular seasonal behavior with peaks in the spring, mainly due to the fact that dust particles are transported into the free troposphere in the north and taken to Hefei along the cold air mass in the spring, this phenomenon is also observed by Kent et al [11], Sasano [12], and Zhou et al [6].
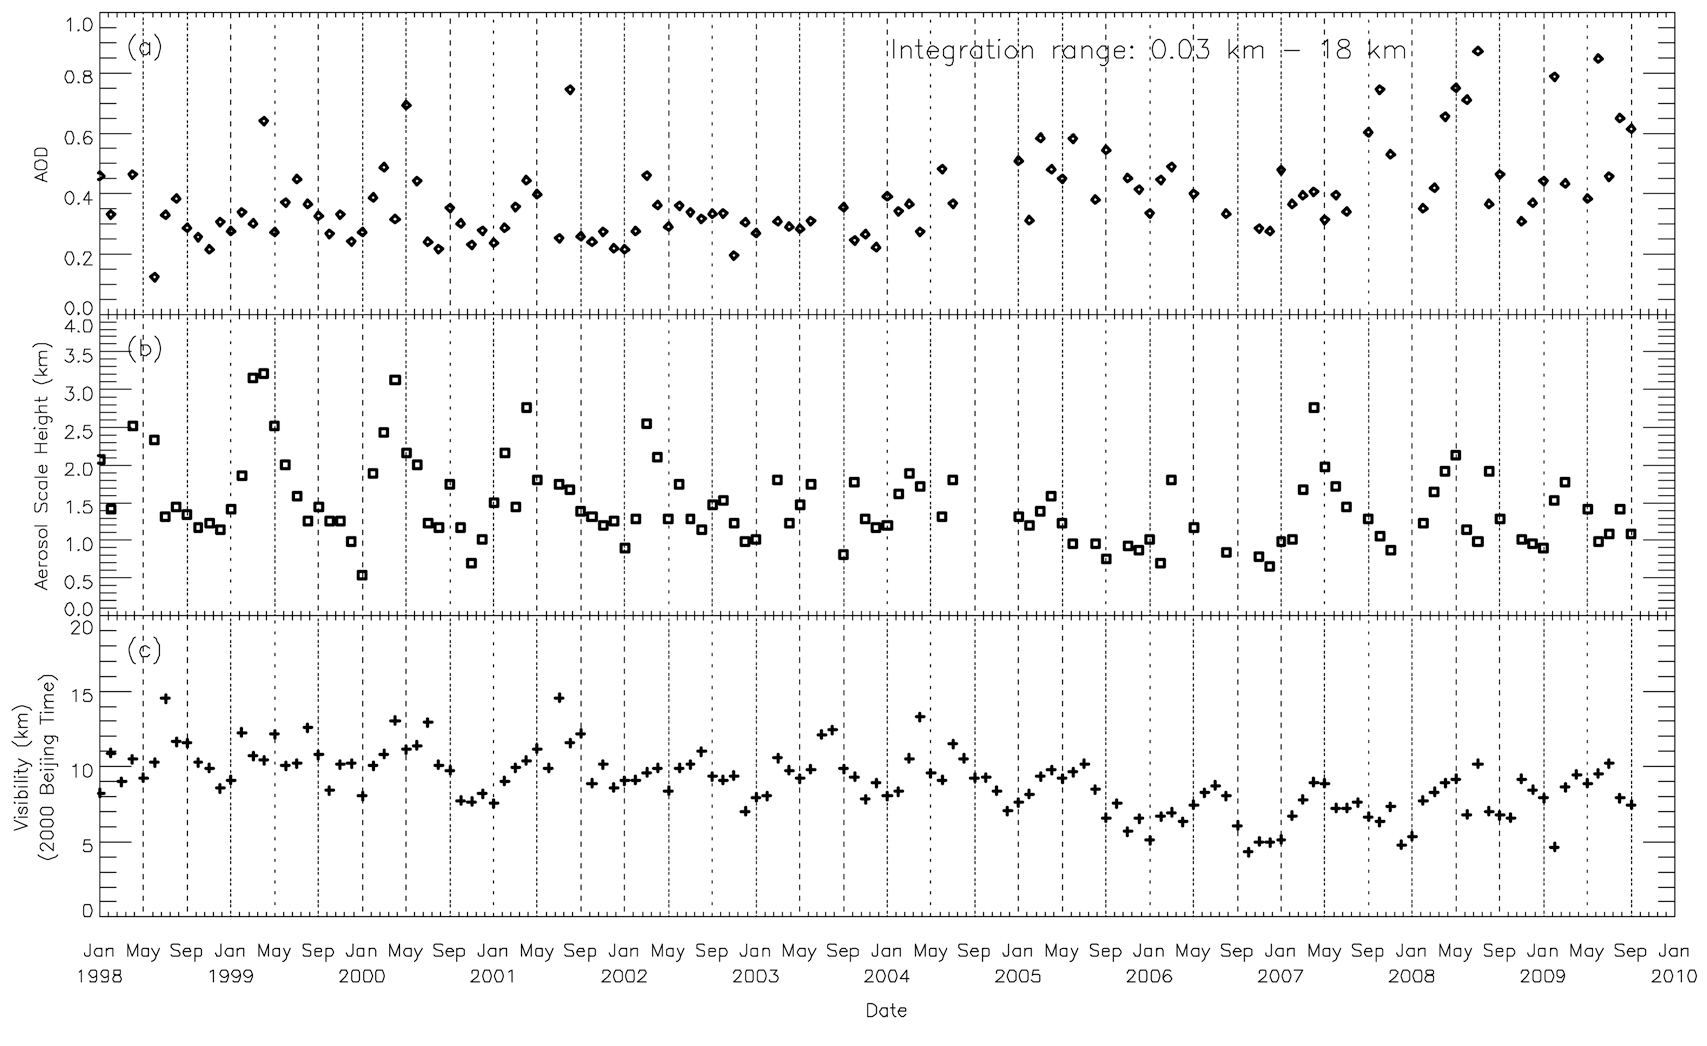
In order to explain the greater LIDAR measurements after about 2005, and to study the long-term variability of atmospheric turbidity in Hefei, monthly mean AOD at 532 nm and aerosol scale height (ASH) derived from LIDAR measurements from January 1998 to September 2009 are shown in Figure 3 (a) and (b), respectively. ASH is calculated by integrating LIDAR measured vertical profile of the extinction coefficient, αa(z), as a function of altitude z [13],
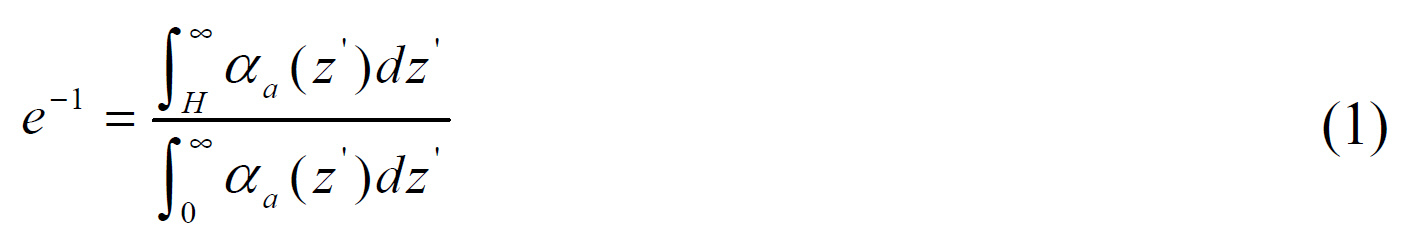
where H is ASH. Aerosol extinction coefficient can be calculated by multiplying aerosol backscatter coefficient by assumed extinction-to-backscatter ratio, which has been used in the LIDAR data processing with Fernald method. Aerosol particles above the tropopause are so few that it is reasonable to replace the integral upper limit by 18 km in
equation (1). ASH reflects the vertical distribution of the aerosol, and it is an important input parameter for determining the aerosol radiative forcing [2].
Time series of surface visibility provided by Anhui Meteorological Bureau (AMB) is also shown in Figure 3(c) for validation of LIDAR measurements. The observatory is in the Luogang airport in the south suburb of Hefei city, approximately 20 km southeast of the LIDAR site.
As seen in Figure 3, seasonal variations of AOD, ASH, and surface visibility is evident before about 2004, these periodic variations imply the influence of the aerosol natural source, and the effects of human activities on the aerosols could be ignored. However, from about 2005, AOD increases along time, ASH as well as surface visibility shows a decreasing trend, and the periodic variation disappeared. It seems that the aerosol concentration in the lower troposphere has increased since 2005. This change seems due to human activities, as Hefei in recent years developed very fast, and many new roads and buildings had been built or were being built.
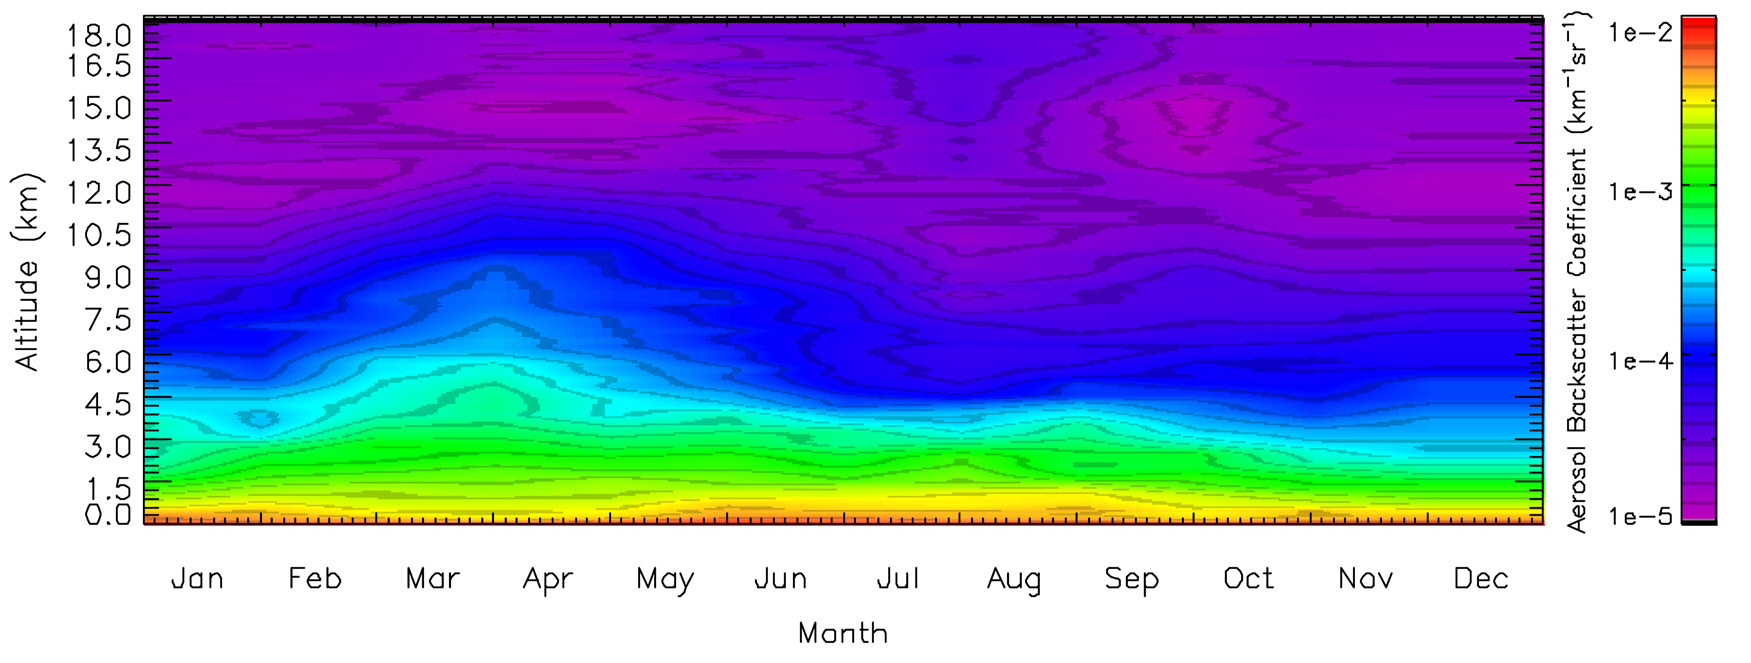
In order to study the characters of tropospheric aerosol vertical distribution, monthly averaged profiles of tropospheric aerosol backscatter coefficients were worked out from the LIDAR measurements shown in Figure 2, and the monthly averaged vertical distributions of tropospheric aerosol are shown in Figure 4. As seen in Figure 4, the following characters of tropospheric aerosol vertical distribution could be found.
i. Below 1.5km, the aerosol backscatter coefficients in the summer months (June, July, and August) are much greater than the ones in other months, and the aerosol could be transported to a higher height. The smallest aerosol backscatter coefficients appear in March and April.
ii. In the range from about 3 km to 9 km, the aerosol backscatter coefficients in February, March, April, and May are much greater than the ones in other months. It is consistent with the pectinations in Figure 2. The dust aerosols brought from the north could affect the aerosol distributions below about 12 km over Hefei. The smallest aerosol backscatter coefficients in this range appear from later July to early September, that is because Hefei area is controlle by Pacific high pressure, and downward flow is dominant at this height during this period.
iii. A clear region with very few aerosols appears in the range from about 9 km to 18 km. The maximum height of the clear region appears in spring, whereas the minimum height appears in summer. The aerosol backscatter coefficients in the range from 15 km to 18 km in summer are obviously greater than the ones in other seasons.
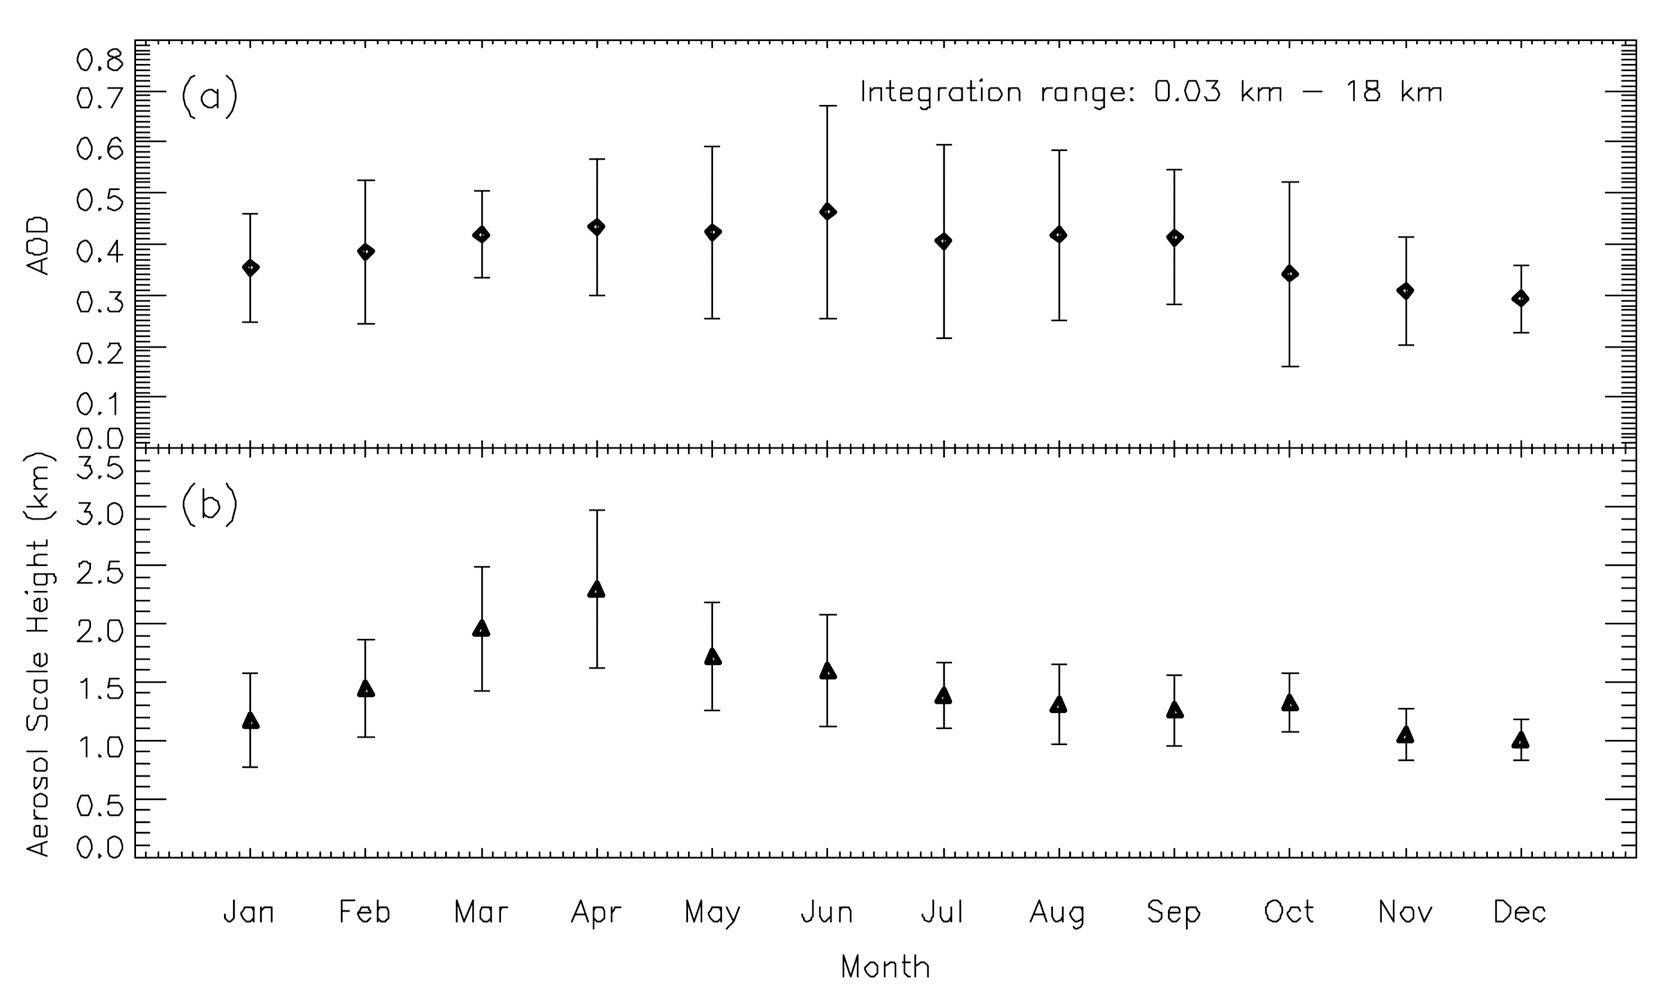
Figure 5 depicts the variations of monthly mean AOD at 532 nm and monthly mean ASH derived from LIDAR measurements taken from 1998 to 2009. As seen in Figure 5, AODs in the spring-summer months (from March to August) are greater than the ones in the autumn-winter months (from September to February in the next year).Greater AOD in the spring is probably caused by dust particles in the free troposphere transported from the north, which also can be seen clearly in Figure 2 and 4. And greater AOD in the summer seems to be caused by
hygroscopic aerosol and plentiful moisture in the mixing layer and intense turbulence near the ground. The largest AOD appears in June, and is about 0.46±0.21 at 532 nm, and the smallest AOD appears in December, and is about 0.29±0.06 at 532 nm.
The monthly fluctuation of ASH is evident in Figure 5. The maximum ASH appears in April, and is about 2.29±0.68 km, mainly due to dust particles in the free troposphere transported from the north. The minimum ASH appears in December, and is about 1.01±0.18 km.
Long-term LIDAR observations in fair cloudless nights in Hefei from 1998 to 2009 have been presented and analyzed, and characters of temporal variation and vertical distribution of tropospheric aerosol over Hefei are summarized.
Most of the aerosol particles are confined below about 3 km AGL. The dust particles from the north could influence the vertical distributions of aerosol below about 12 km over Hefei in spring. Since 2005, the aerosol backscatter coefficients in the lower troposphere and tropospheric aerosol optical depth increase, while ASH derived from LIDAR measurements as well as surface visibility decreases, it seems that this change would be caused by the human activities, as a lot of new roads and buildings have been built or are being built in Hefei in recent years.
Because of the dust particles transported from the north in spring over Hefei, ASH measured by LIDAR in spring is much greater than the ones in other seasons. The maximum ASH, which is 2.29±0.68 km, is measured in April and the minimum ASH, which is 1.01±0.18 km, is measured in December.
In the lower troposphere, aerosol backscatter coefficients in summer months are a bit greater, and the ones in spring months are a bit smaller. Aerosols could be transported to a higher altitude in summer near the ground, mainly due to the intense turbulence near the ground. In the free troposphere, aerosol backscatter coefficients in spring months are obvious greater, and the ones in July and August are a bit smaller. But, aerosol backscatter coefficients in July and August are greater in the tropopause. These phenomena would be determined by the climate character in Hefei.