The recent progress of optical imaging modalities has promoted the non-invasive visualization of various tissues. Among several optical techniques, the confocal laser scanning microscopy (CLSM) and two-photon microscopy have distinguished themselves with their superior spatial resolution and optical sectioning ability [1-6]. They are based on the scanned point laser source and can be used to image the sub-cellular structures with a resolution of a few hundred nanometers. The CLSM acquires images with two distinct image modes i.e., the reflectance mode and the fluorescence mode. The back-scattered light from the sample is used for constructing images in the reflectance mode. In the fluorescence mode, CLSM makes the image using the fluorescence light which can originate from the endogenous fluorophore (autofluorescence) or exogenous fluorophore (fluorescing dyes leveled to the tissue components). The intrinsic autofluorescence sources inside tissue include the Nicotinamide adenine dinucleotide (NADH), flavin adenine dinucleotide (FAD), tryptophan, retinol and elastin [7]. The contrast for the two-photon microscopy is provided by two distinct light emissions from the sample i.e., the Second Harmonic Generation (SHG) and the fluorescence [5, 7]. Both SHG and fluorescence are induced by the non-linear process called two-photon absorption which gives the name for “two-photon” microscopy. The SHG induced light has half the wavelength and twice the energy of the excitation light. The collagen fibers in the dermis are known to be the major SHG source in the skin. In the fluorescence mode, two-photon microscopy uses both the endogenous fluorophore and the exogenous fluorophore as in the CLSM. It should be mentioned that the back-scattered light, the autofluorescence, and the SHG are generated by the intrinsic contrast source in the tissue which do not require the addition of exogenous dyeing molecules.
In spite of their superior spatial resolution, the image depth of the CLSM and two-photon microscopy is limited due to the strong light scattering inside the turbid tissues. The typical image depth of the CLSM and two-photon microscopy is about a few hundred micrometers in typical turbid tissue such as skin.
Among various tissues, the skin has been known as one of the most successful imaging targets of the CLSM and the two-photon microscopy. Following the early demonstration of human skin observation with the CLSM and two-photon microscopy in the 1990s, numerous studies have been performed to visualize the normal and diseased skin morphologies [8-13]. The CLSM and two-photon microscopy for
In this study, we imaged the
Since the laser wavelength (710 nm) is close to the excitation peak of the NADH and FAD (the major fluorophore of the skin), the epidermal structure is more clearly visualized with our system compared to Chen’s porcine skin study. We also demonstrated that the combined imaging with the confocal/ two-photon microscopy can be applied for the study of dermal cells for their population, distribution and metabolism in the dermatology and cosmetic fields.
2.1. Confocal Laser Scanning Microscopy (CLSM) and Two-photon Microscopy
We have imaged the upper layer of the
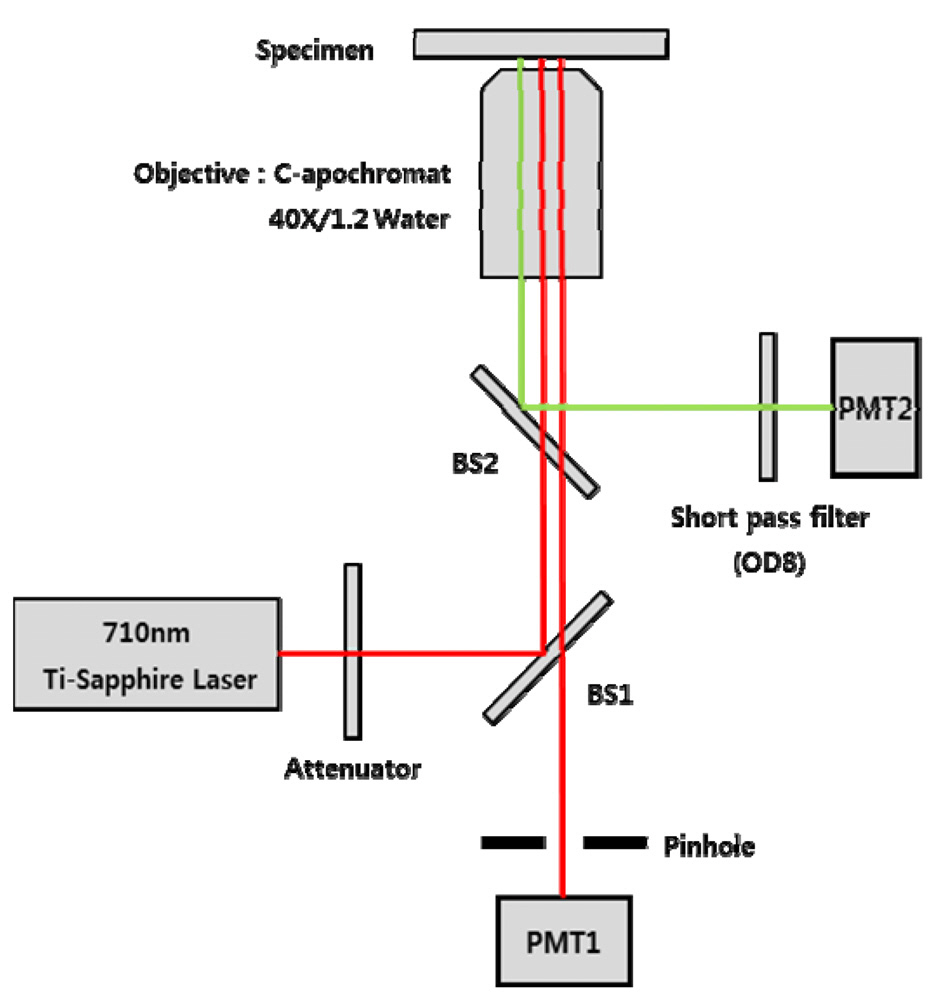
wavelength of the Ti:Sapphire laser was tuned at 710 nm with a spectral bandwidth of ± 5 nm. The wavelength was selected based on the autofluorescence excitation peak of NADH and FAD. The CLSM used the CW lasing mode, and the two-photon microscopy used the mode-locking mode that produces 150fs pulses with the repetition of 80MHz. The laser power on the sample was adjusted by putting a series of optical attenuators between the laser and BS1. A water-immersing objective lens (C Apochromat 40X, Zeiss, Germany) with numerical aperture of 1.2 and working distance of 170 ㎛ was used.
The CLSM was implemented based on the confocal detection scheme which employs a single pinhole. The 75㎛ diameter pinhole was placed in front of the photodetector (PMT1: Hamamatsu, R3896, Japan). The pinhole allowed PMT1 to collect the light exclusively from the focal point of the imaging laser. The laser light was delivered to the 2D mechanical scanner which consists of a 36-facet polygon mirror and galvanometer mirror. The 2D scanner allowed us to achieve the video rate imaging speed i.e., 30 frames per second. Upon irradiation, the backscattered light or fluorescence light from the sample was collected by the objective lens and delivered to the two independent PMTs. In the retracing path, the beam was split with a beam splitter (BS2) that reflects the florescence light to the PMT2. A short-pass filter with OD 8 was placed in front of the PMT2 to remove the leakage of excitation light. The wavelength of BS2 and the short-pass filter was selected to deliver both autofluorescence and SHG signal to PMT2. The transmitted light (back-scattered light) through the BS2 was delivered back to the BS1. The BS1 transmits a portion of the light to PMT1 for the reflection imaging. The z-axis scanning of the tissue was performed using a motorized scanner.
The microscope was built as an inversion type, and the field of view was set to 300 ㎛ by 300 ㎛. The optical sectioning thickness of the CLSM was measured to be approximately 4 ㎛. The signals from both PMTs were fed into an A/D convertor, and the digitally converted signals were used to produce a snapshot image and a movie clip using a C-language based custom software.
2.2. Tissue Sample Preparation
Fresh human skin from the affiliated Kyungpook National University Hospital was used for imaging of the upper layer of the skin. The specimen was extracted from a patient’s eye lid during a plastic surgery. Informed consent forms were obtained from the patient. The imaging was performed within 12 hours after the extraction of the tissue. The epidermal side of the skin was placed on a 100 ㎛ thick cover slide, and the methylcellulose was placed between the slide and the epidermis in order to match the refractive index. In order to minimize the dehydration of the sample, the other side of the skin was covered with the ultrasonic transmission gel.
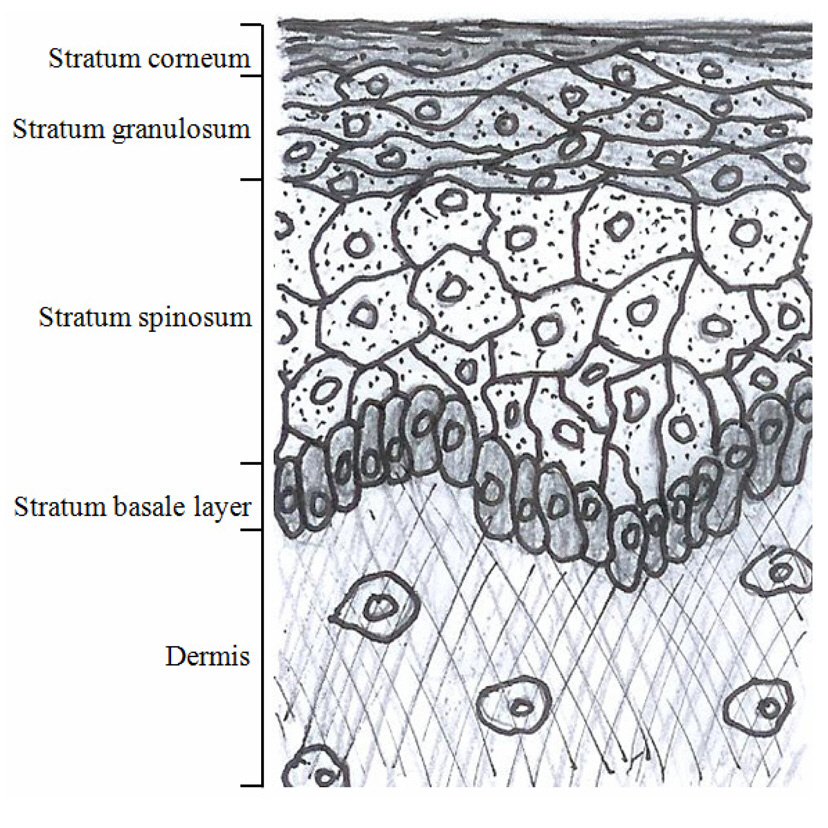
A simple sketch of the epidermis and the upper dermis is shown in the FIG. 2. based on the literature surveys. The epidermis consists of multiple cell layers including the stratum corneum, the stratum granulosum, the stratum spinosum and the basal layers. The non-viable cells with no nucleus form the outermost stratum corneum layer which is mainly responsible for the epidermal barrier function. Three layers with viable cells exist below the stratum corneum. The stratum granulosum and the stratum spinosum are differentiated by their depth and shapes of the cells. The stratum granulosum is just below the stratum corneum, and the cells in the stratum granulosum are flatter than those in the spinosum.The stratum spinosum is located between the granulosum and the basal cells. The stratum spinosum is characterized by the spine-like surface projections. The border between the epidermis and the dermis is formed by the basal layer (the deepest layer of the epidermis), and the cells in the basal layer are smaller than those from the granulosum and the spinosum.
The papillary dermis is the upper dermal layer adjacent to the epidermis along the basal layer, and it is named for the papillary shape of the epidermal and the dermal junction. The papillary dermis is formed based on the fibrous connective tissue such as the collagen and elastic fibers. The various cells and interfibrillar gel occupy the empty space inside the mesh of the fibrous connective tissue. The cell types include the fibroblasts, mast cells and leucocytes. When we observe the skin from the top, the epidermis is separated by a larger region called a “cluster” which consists of multiple coenocytes columns. The clusters are separated by the intercluster region called “canyon”
We imaged the upper layer of
We successfully acquired the images from the same sample spot using both imaging modalities.
3.1. Two-photon Images of Epidermis
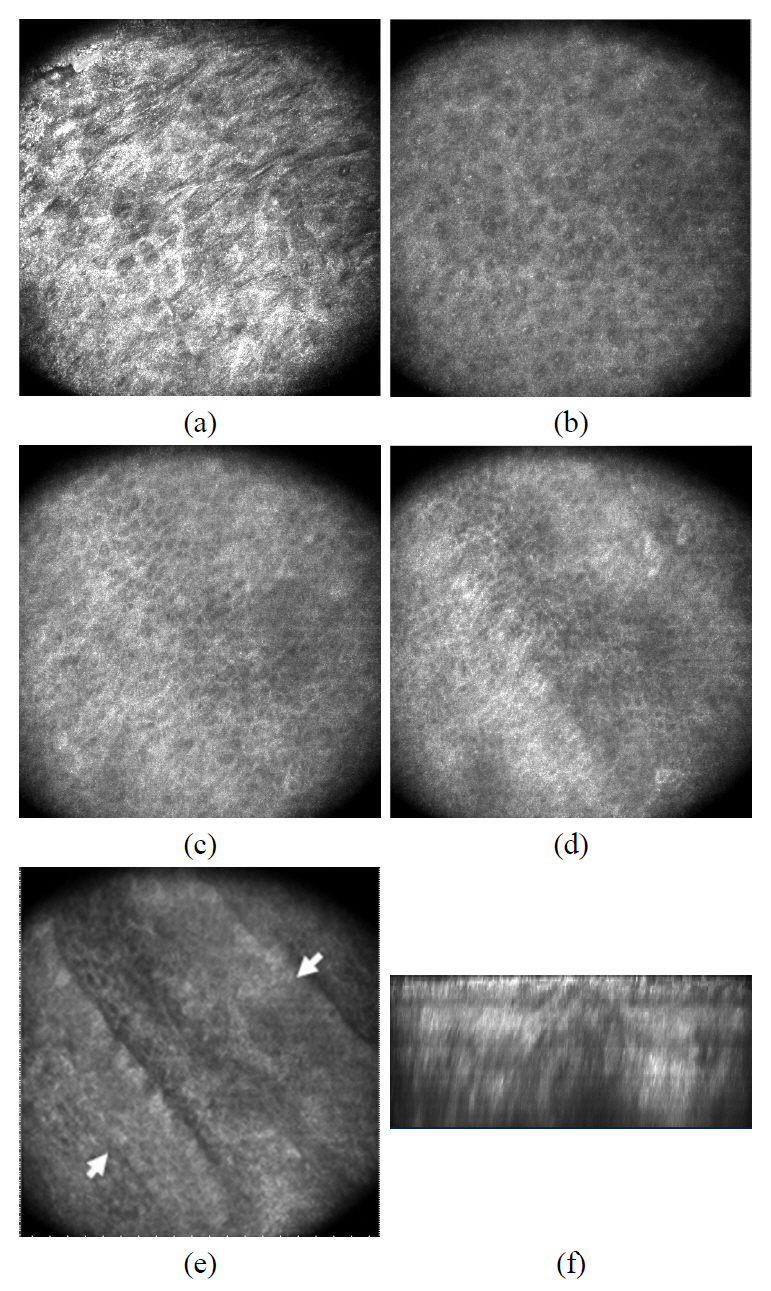
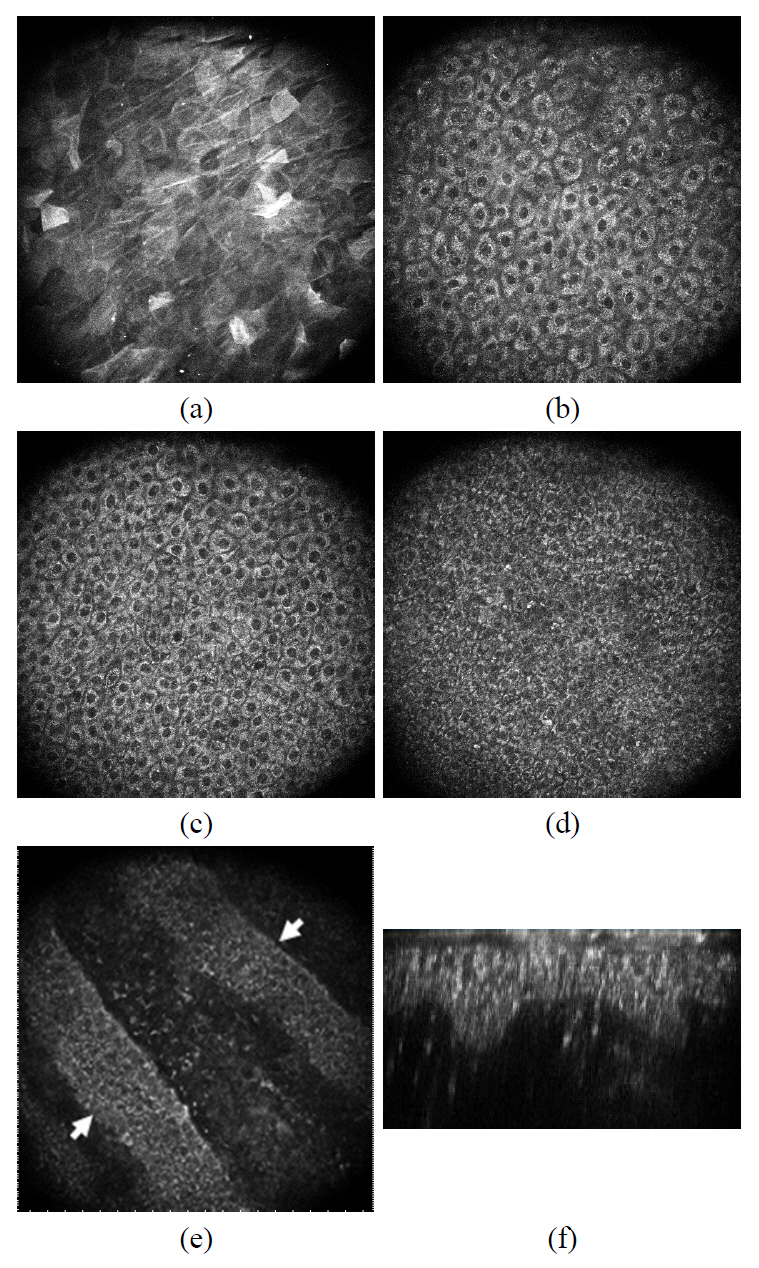
Typical skin images of two-photon microscopy are presented in FIG. 3. The optically-sectioned images were taken at the surface, 10 ㎛ deep, 20 ㎛ deep, 30 ㎛ and 40 ㎛ from the surface. The optically sectioned images of two-photon microscopy clearly differentiated four distinct cell layers in the epidermis. The polygonal shaped cells in the stratum corneum (outermost non-viable cell layer) were observed at depths ranging from 0 to a few ㎛ (FIG. 3. (a)). They produce unevenly distributed autofluorescence light, and the boundary of the cells could be distinguished with brighter signal. Following the stratum corneum, stratum granulosum with diameter of 15~20 ㎛ were observed in
the depth range from a few to 15 ㎛ depth (Figure 3. (b)).The extracellular boundary and the nucleus of the cells appeared dark while the cytoplasm produced brighter autofluorescence signals. Adjacent to the granulosum, stratum spinosum was observed in the depth ranging from 20 ㎛ to 40 ㎛(FIG. 3. (c)). The average diameter of the cells is approximately 10~15 ㎛, and the oval-shaped nuclei appear darker while the extra-nucleus regions appear bright. The diameter of cells in the spinosum diminishes as we deeper toward the basal layer; however the number of cells increases with increasing depth. The deepest viable cell layer of the epidermis is the basal layer which forms the boundary between the epidermis and the dermis. The basal cells with diameters of 5~10 ㎛ were clearly observed in the depth ranging from 40 ㎛ to 60 ㎛(FIG. 3. (d) and (e)). FIG. 3. (e) presents the cross-sectional image of the epidermal and dermal junction where the basal layer and the papillary dermis layer coexist. Two basal cell layers formed diagonally in the image (indicated as the arrow), and the upper dermal layer can be observed between them. The basal cell layer and the upper dermis can coexist at the same depth since the thickness of the epidermis varies from spot to spot as depicted in the illustration. The B-scanned image (the cross-sectioned image in the plane perpendicular to the skin surface) of a spot was reconstructed from the stack of
3.2. Confocal Images of Epidermis
The optically-sectioned confocal images of
3.3. Two-photon and Confocal Images of Dermal Structures
The structure of dermis is formed based on the fibrous matrix, which consists of the collagen fiber bundle and the elastic fiber. The dermal cells including the fibroblasts, leukocytes, and mast cells are located inside the mesh of the fibrous matrix. The CLMS and two-photon microscopy were used to image the various components of the papillary dermal layer.
The back-scattered light from the dermal components provides the contrast for the CLMS as in the epidermis of the skin. Autofluorescence from coenzyme such as NADH and FAD provides the contrast mechanism and the second harmonic generation from the collagen fiber also provides the contrast in the dermis.
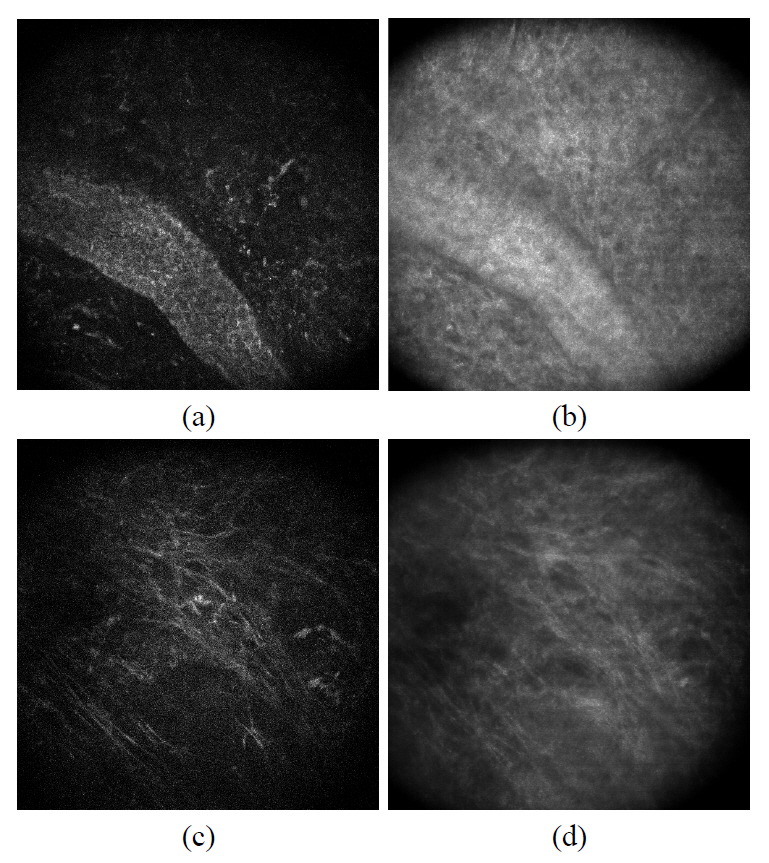
FIG. 5. (a) and (b) shows the confocal and two-photon images of collagen fibers located right below the epidermal and dermal junction. Since the images were taken at the depth where the dermal papillary is located, we recognized the basal cell layer on the lower right corner. Other than that region, we observed the top most area of the dermis where the extracellular fiber matrix locates. The images of the elastic fiber were highlighted in FIG. 5. (c) and (d). Compared to the confocal image, two-photon microscopy provides a higher contrast for the elastic fiber which appears thinner
than the collagen fiber bundle.
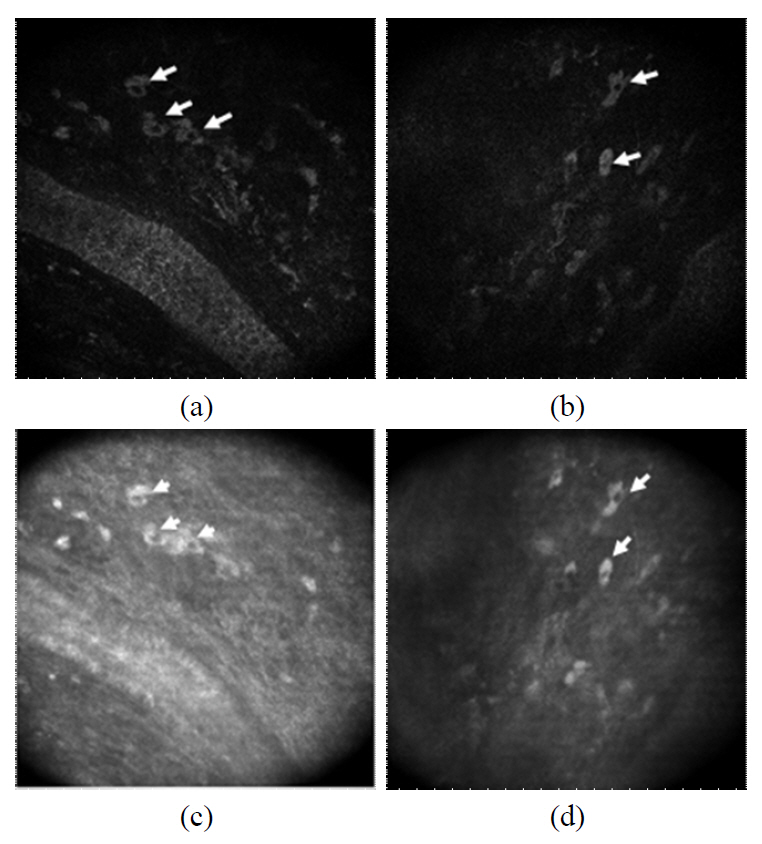
We were able to observe numerous dermal cells along with the extracellular matrix using both CLSM and the two-photon microscopy. The cells in the dermis (arrows) are clearly visualized as the bright cytoplasm and dark nucleus in both imaging modalities (FIG. 6). It should be noted that typically cells appear brighter than the extracelluar matrix in the reflectance image. We could image numerous cells in the depth ranging from 40 ㎛ to 100 ㎛ and the dermal cells showed various shapes.
IV. DISCUSSION AND CONCLUSIONS
The
Four distinct cell layers in the epidermis were clearly observed with both CLSM and two photon microscopy. The cell types were differentiated by the residing depth and the size of the cells. The diameter of the epidermal cell and size of the nucleus decrease as we go deeper into the basal layer. The intercellular region and the nucleus of the cell are more clearly presented with the two-photon microscopy. The bright spot inside the nucleus is observed in the epidermal image of CLSM and this suggests a heterogeneous distribution of the refractive index inside the nucleus. B-scan image of the two photon image clearly outlined the epidermis and dermis junction while the boundary of the epidermis and dermis is not clearly distinguished with the CLSM. The thickness of the epidermis (from stratum corneum to the basal cell layer) measures 40~50㎛ from the two-photon B-scan image. The high concentration of coenzyme NADH and FAD in the cytoplasm is believed to contribute to the superior contrast of the two-photon microscopy over the CLSM. In the dermal image of CLSM, the fibrous structures appear brighter than extrafibrillar matrix and they were observed over the entire cross-section of the dermal tissue. The fibrous structures present a bright emission for the two-photon microscopy, however they are not as clearly resolved as those in the CLSM. The B-scan image of the CLSM demonstrates a brighter emission from the fibers compared to the two-photon microscopy.
It should be noted that numerous cells in the papillary dermal layer were clearly observed in both CLSM and two-photon microscopy. The strong back-scattered signal from the cytoplasm was detected so that the dark nucleus is clearly outlined. As in the CLSM, the two-photon microscopy detected the bright luminescence in the cytoplasm, and the nucleus region appears dark. Some dermal cells are located right below the basal cells, and cells as deep as 100 ㎛ were imaged as well. The dermal cells have various sizes (15~25 ㎛) and shapes including circular, elliptical and diamond shapes. Regardless of the size and shape, both imaging modalities produced very similar dermal cell images. This indicates that the cytoplasm of an imaged cell provides a strong signal for both CLSM and two-photon microscopy. There exist various different cell types in the papillary dermal region including the fibroblasts, mast cells, and immune cells which play important role in the collagen fiber production and immune response. Since the observed dermal cells in this study have diverse shapes and sizes, it is difficult to identify the cell types. However, it is clearly demonstrated that the combined imaging with the CLSM and two-photon microscopy can be applied for the non-invasive study of dermal cells for their population, distribution and metabolism, including the immune response of immune cells.