Dense
Researchers have performed extensive studies on
Many factors affect growth rates, including frond size, competition, the algal canopy (Eckersley and Garbary 2007), nutrient concentrations, temperature, sunlight (Mathieson et al. 1976, Keser et al. 2005), wave exposure (Vadas and Wright 1986), position on the shoreline and substratum (David 1943), and harvesting (Ugarte and Sharp 2001, Ugarte et al. 2006). These factors may also cause morphological differences in
In areas where nutrients are either limiting or in excess, growth can slow, and individual species may become noncompetitive or reduce their reproductive rates. When excessive nutrient levels occur, eutrophication may change the community composition significantly. Nitrogen is usually the most limiting nutrient in temperate marine ecosystems (Pavia et al. 1999). One experimental nitrogen enrichment of
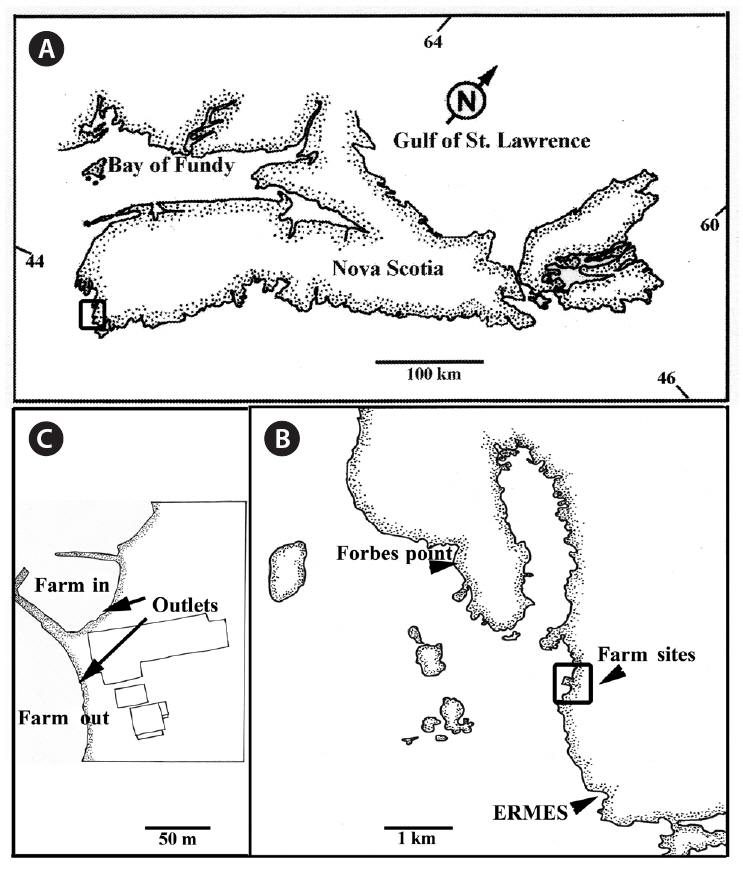
We collected fronds from two intertidal elevations, at two test and two control sites (Fig. 1). The test sites were at the outflow of a land-based finfish farm raising Atlantic Halibut,
For the two control sites, we selected locations approximately 2 km from the test sites, one north, one south, with no associated industrial or domestic effluent sources that could affect water quality. The first site was adjacent to Evelyn Richardson Memorial Elementary School (ERMES) in Shag Harbour (43°29′50˝ N, 65°43′45˝ W). A shallow inlet provided some shelter. The site had a rocky substratum dominated by
>
Sampling and measurement methods
At each of the four sites, the elevation gradient occupied by
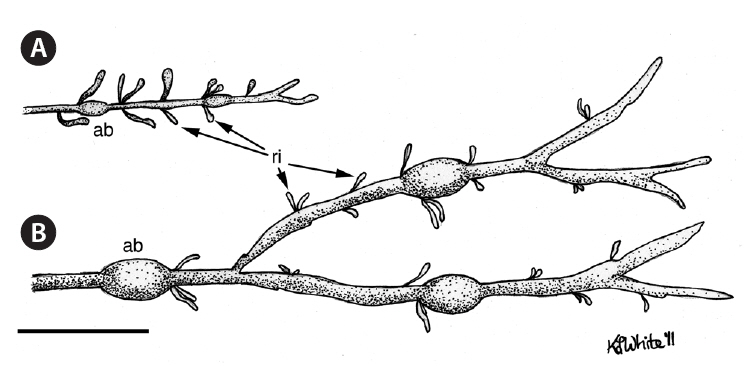
For each thallus, we determined biomass, along with vegetative biomass (after removing the receptacle initials), and counted the number of receptacle initials. For the longest frond from each thallus, we measured frond length, number of dichotomies and air bladders on the longest axis, maximum frond width not associated with an air bladder, and greatest air bladder length. To measure frond width and air bladder length, we used vernier calipers, measuring to the nearest 0.1 mm. The other measurements used a meter ruler and measured to the nearest millimeter. Since air bladder size can vary significantly along a given axis (Brackenbury et al. 2006, Garbary et al. 2006), we measured only the largest air bladder on each frond.
Using these same fronds, we also measured the length of the current year’s growth (i.e., from the frond tip to the base of the first bladder) and the distance between the bases of the first and second bladders (similar to Vadas et al. 2004). We thus determined the length of the 2009 growth increment, which allowed us to calculate the percentage of the previous year’s growth completed by September 2010, when we harvested the thalli.
To determine tissue N and C content, we first collected samples of frond apices monthly, from June through September, at all sites. The 30 frond apices from each tidal height were randomly divided into four samples, dried at 60°C, and then ground in a bead mill (Model MM200 Grinder; Retsch, Haan, Germany). Finally, 1.5-2.5 mg of powder were removed from each sample to determine N and C composition using a Perkin Elmer 2400 series II CHNS/O elemental analyzer (Waltham, MA, USA).
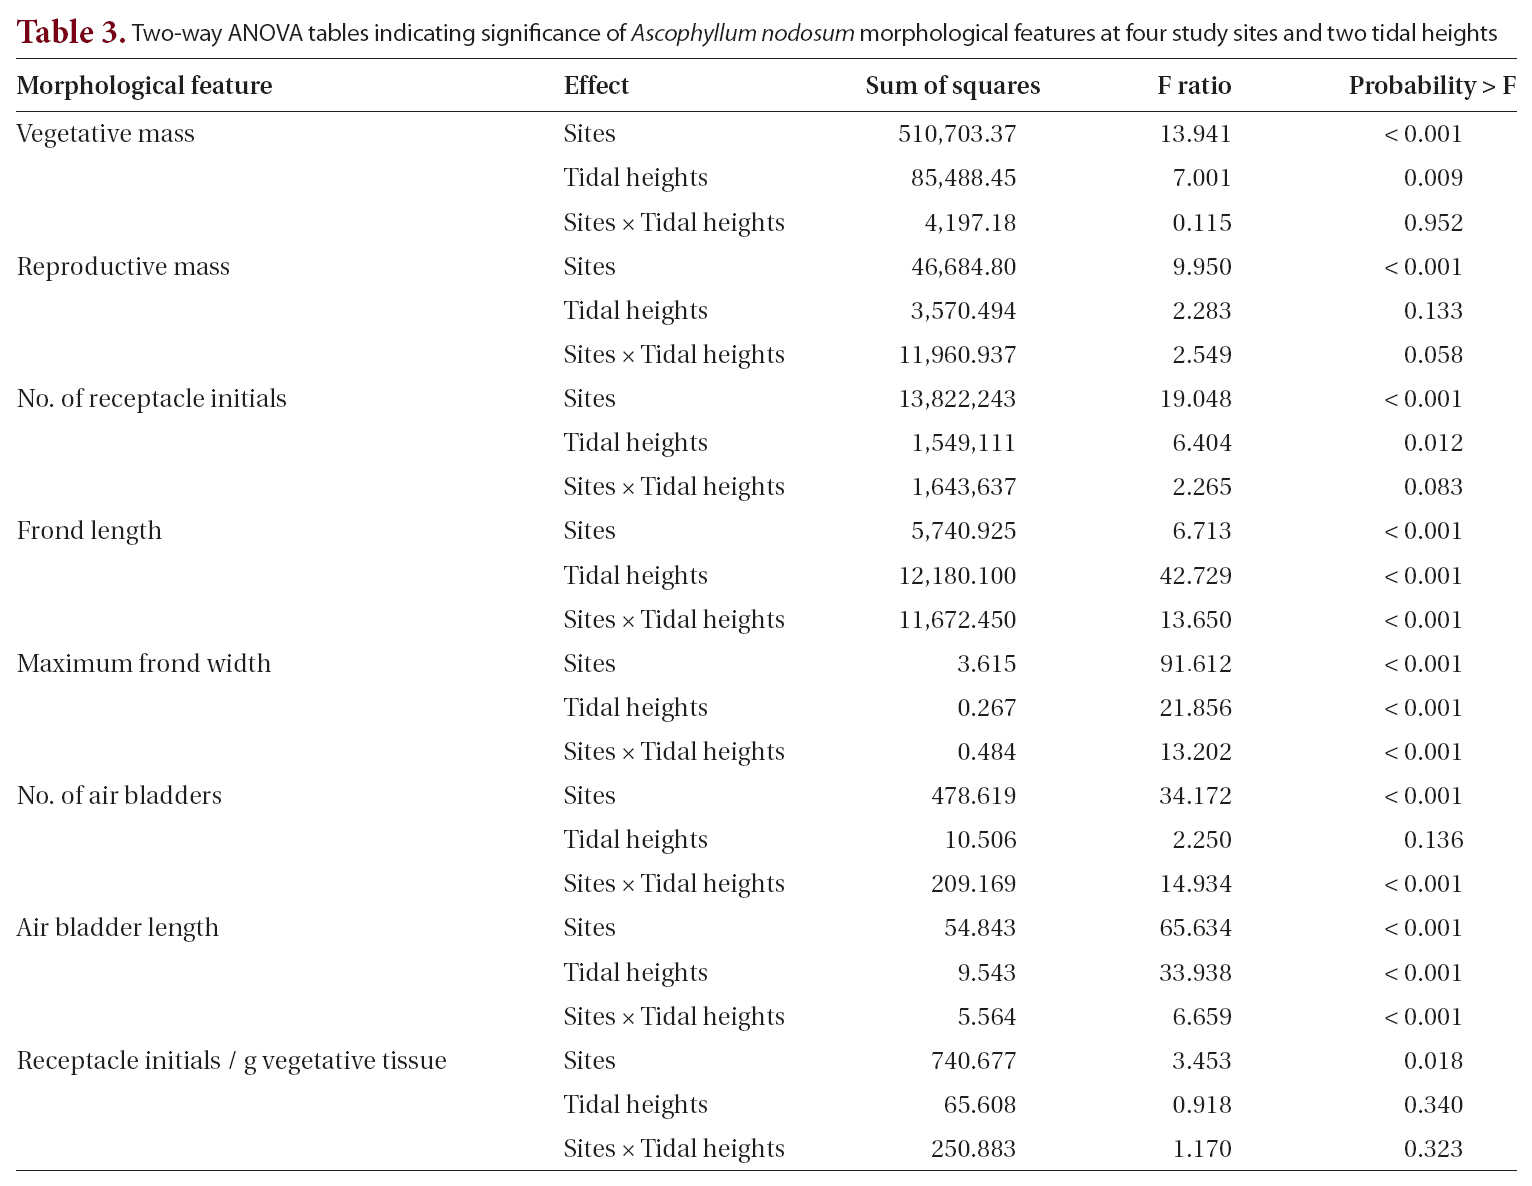
One- and two-way analyses of variance (ANOVAs) were conducted for each of the analyzed morphometric features, with sites and tidal heights as the dependent variables using JMP statistical software (SAS Inc., Cary, NC,USA). Subsequently, we used Tukey’s post hoc test (Zar 1999) to determine which sites and intertidal heights differed and how these factors interacted with thallus and frond morphologies. A one-way ANOVA of tissue nutrient data determined any significant differences among months or between farm and control conditions, followed by a Tukey’s post-hoc analysis to discern any patterns in tissue nutrient changes between June and September.
>
Comparisons within control and farm sites
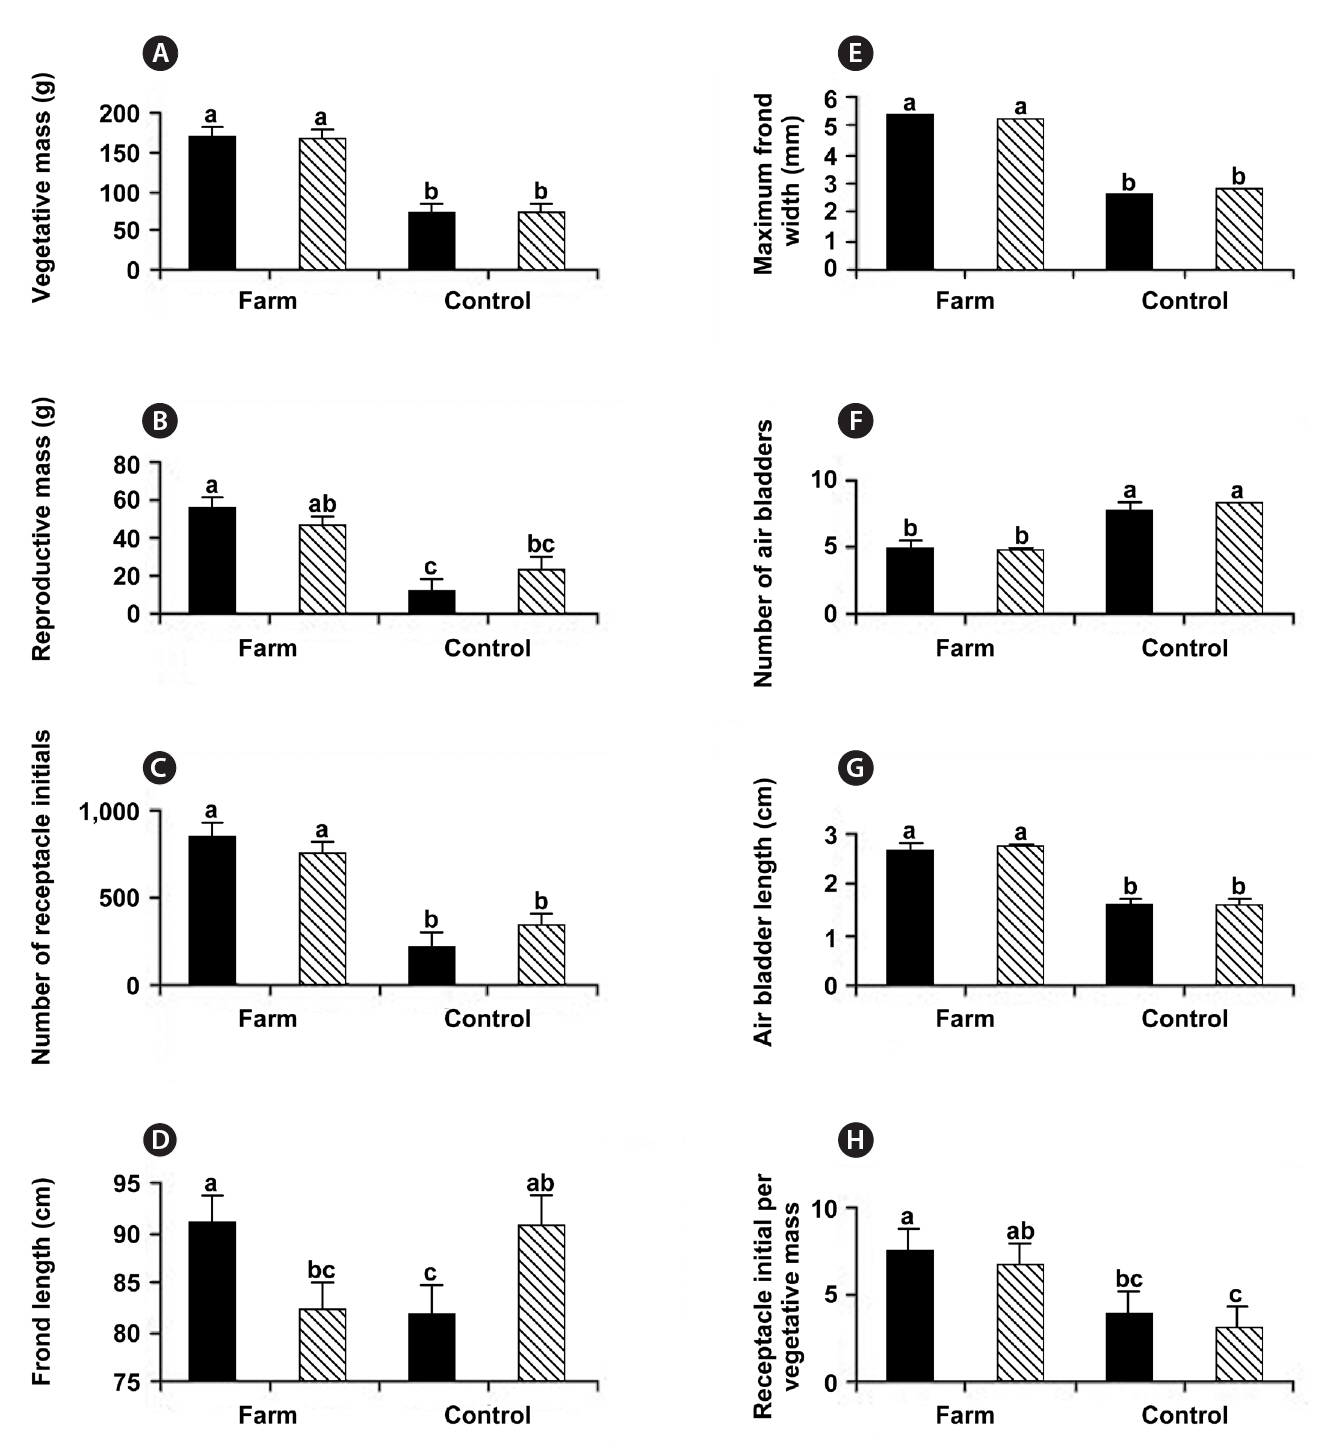
When the four sites were considered independently for the 12 morphological and growth features of whole thalli and fronds (Table 1), the sites fell into two groups: the farm sites and control sites. All features showed some significant differences among the sites. The two farm sites did not differ significantly from each other on eight of the characters, while control sites did not differ significantly on seven characters (Table 1). Of the four features that differed significantly different between the farm sites, three had means outside the ranges of control sites (greater thallus mass, greater vegetative mass, and greater number of receptacle initials). Of the five features that differed significantly between control sites (maximum frond width, number of air bladders, length of air blad-
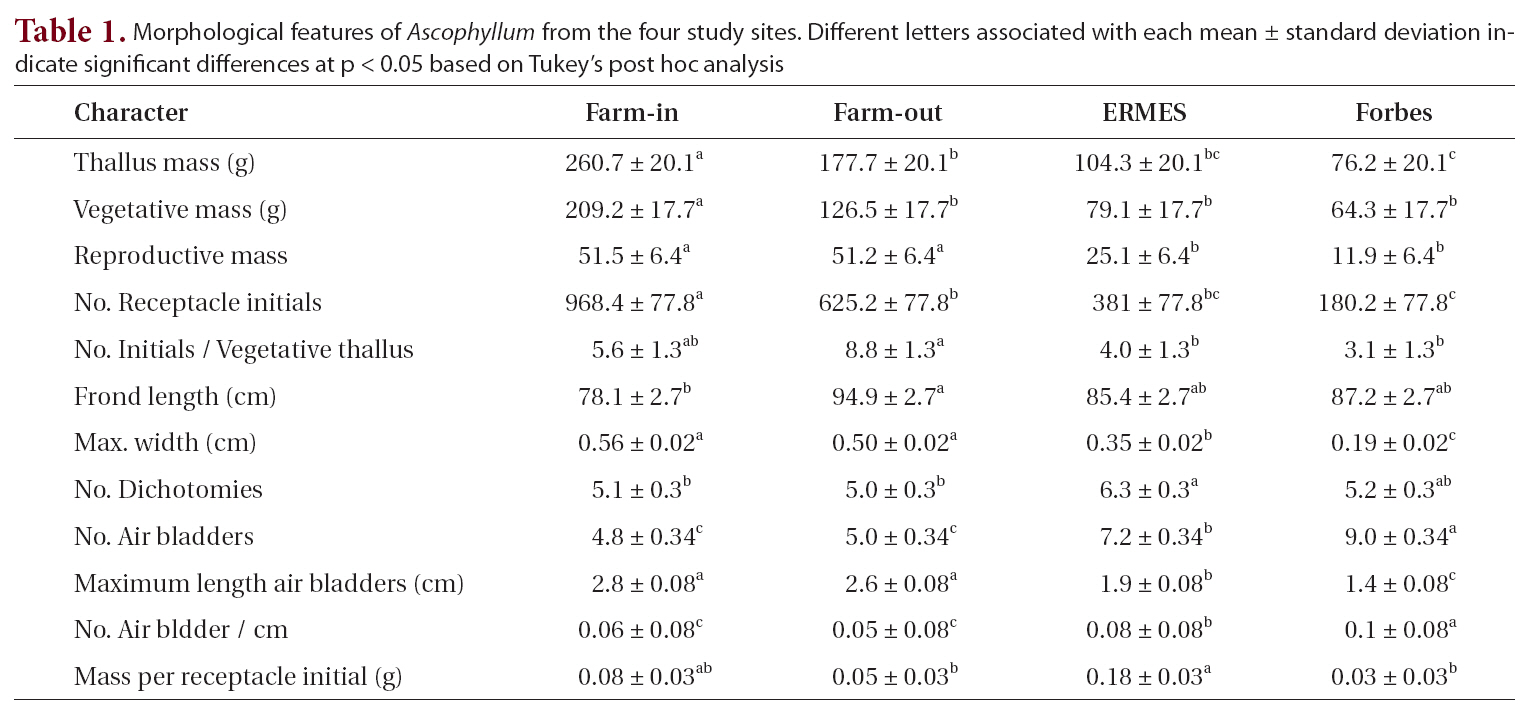
Morphological features of Ascophyllum from the four study sites. Different letters associated with each mean ± standard deviation indicate significant differences at p < 0.05 based on Tukey’s post hoc analysis
ders, number of air bladders, and mass per receptacle initial), four of these (all but mass per receptacle initial) had more extreme means than those of farm sites.
>
Comparisons between control and farm sites
The primary objective in this study was to characterize the potential morphological differences of
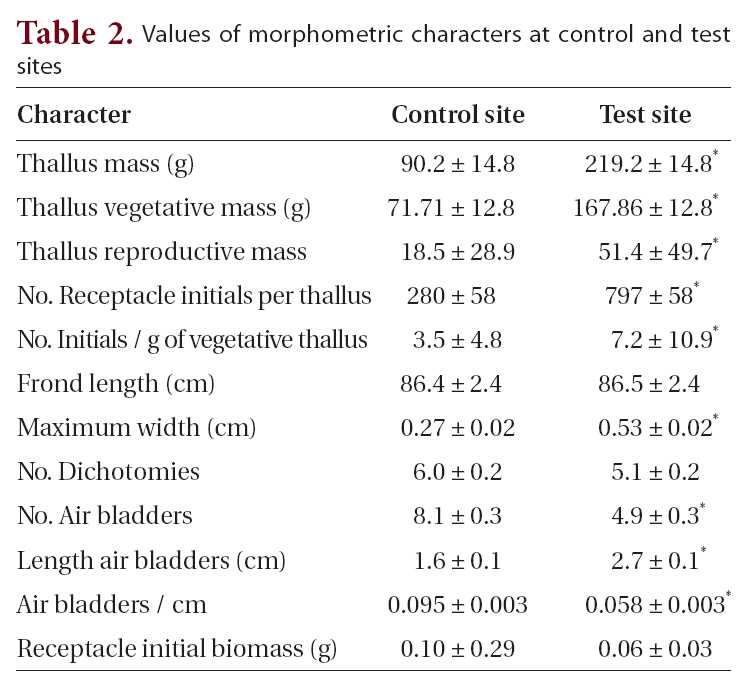
at control sites (Table 1, Fig. 2). These field observations were extended with more comprehensive morphometric evaluations (Table 2). Whereas frond lengths at control and experimental sites were similar, thallus biomass was over twice as great at farm sites, and this biomass showed a similar distribution between vegetative and reproductive tissues (79 and 77% vegetative for control and farm sites, respectively). This difference in biomass resulted from farm sites having much wider thalli (5.3 mm vs. 2.7 mm; significant at p < 0.05), which were also thicker (not measured). At farm sites, the longest frond on each thallus had fewer air bladders on its primary axis, and these farm site air bladders were longer (2.7 cm long vs. 1.6 cm long; significant at p < 0.05). The difference in air bladder numbers reflects differences in frond age, with the large fronds at control sites being three years older than those at farm sites (8.1 y vs. 4.9 y, respectively; significant at p < 0.05).
With respect to reproductive features, thalli from farm sites had more receptacle initials per thallus (797 vs. 280), and this corresponded to more initials per unit mass of vegetative thallus (7.2 receptacles g-1 vs. 3.5 receptacles g-1 for farm and control sites, respectively, significant at p < 0.05). Average receptacle biomass was significantly lower at farm sites (0.06 g vs. 0.10 g; significant at p < 0.05). The 21 and 23% of thallus biomasses comprising receptacle tissue suggests a standard reproductive : vegetative biomass ratio for these populations at this stage in development (Fig. 2).
[Table 2.] Values of morphometric characters at control and test sites
Values of morphometric characters at control and test sites
>
Impact of tidal height on farm vs. control features
At each study site, we collected
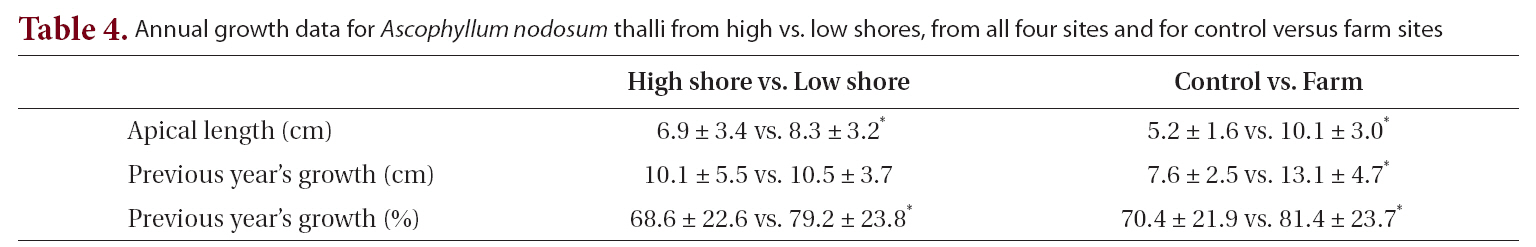
To evaluate annual growth among sites and tidal heights, the current year’s growth was measured and compared to the length of the previous year’s growth segment (see Fig. 2). Using the entire data set, we compared differences between high and low shore thalli and between control and farm sites (Table 4). While all populations initiated growth simultaneously in March (Kim unpublished observations), by the September data collection, the current year’s growth was 20% greater in thalli from the lower shores. This difference resulted from the slower summer growth of upper shore thalli, which had completed only 69% of their growth by the September collection, whereas lower shore thalli had completed almost 80% of their annual growth during the six months prior to collection. Given the absence of a significant difference in the previous year’s growth (i.e., means of 10.1 and 10.5 cm for high and low shores, respectively), high shore plants must grow faster during the second six months of their annual growth cycle.
The differences in annual growth increments between control and farm sites were much greater than between high and low shores. Thus, apical segments at control sites had grown only 5.2 cm, whereas those at farm sites had grown 10.1 cm (Table 4). This corresponded to a major difference in size for the previous year’s segments,i.e., 7.6 and 13.1 cm, respectively (significant at p < 0.05). There was also a significant difference in the percentage of the previous year’s growth, 70.4 and 81.4% (p < 0.05) at control and farm sites, respectively. Thus, control sites must undergo a greater percentage of their growth during the final six months of their annual cycle relative to farm sites (i.e., 30% vs. 20%).
>
Tissue carbon-nitrogen analysis
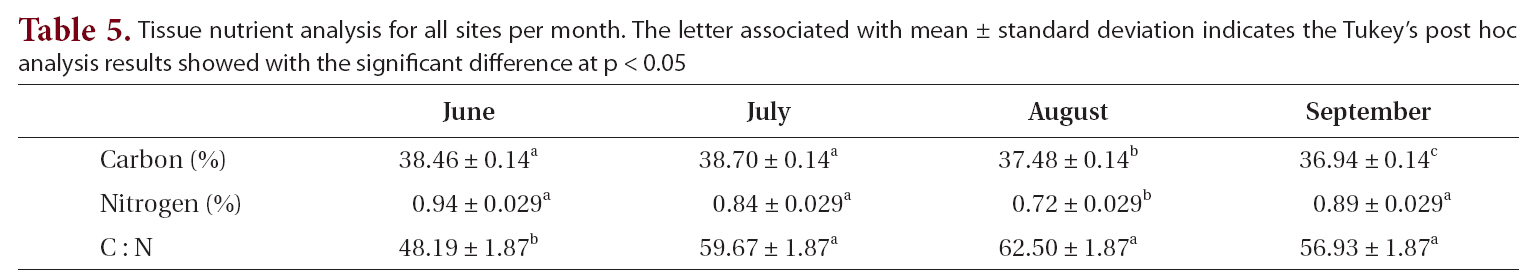
Tissue carbon and nitrogen content and C : N ratios varied from June to September (Table 5). Carbon showed a significant decline over the summer, from 38.5 to 36.9%. Nitrogen content varied from a high of 0.9% in June to a low of 0.7% in August. This difference in nitrogen content between August and all the other months was significant. The resulting C : N ratios varied from 48.2 in June to a high of 62.5 in August, with the August ratio differing significantly from those of the other months.

Two-way ANOVA tables indicating significance of Ascophyllum nodosum morphological features at four study sites and two tidal heights

Annual growth data for Ascophyllum nodosum thalli from high vs. low shores from all four sites and for control versus farm sites
Tissue nutrient analysis for all sites per month. The letter associated with mean ± standard deviation indicates the Tukey’s post hoc analysis results showed with the significant difference at p < 0.05
Position on the shore did not yield significant differences in elemental composition with respect to C and N. Carbon composition values were the same for high and low shore fronds: 38.2 ± 0.4%. Nitrogen content showed greater variation between high and low shore fronds, with 0.82 ± 0.44 and 0.79 ± 0.44% for high and low, respectively; however, these did not differ significantly (p > 0.05).
The biggest differences in elemental composition were between farm and control sites (Table 6). While the values for percent carbon showed statistically significant differences (37.3 and 38.3% for farm and control sites respectively, p < 0.001), the values were markedly similar. This was not the case for percent nitrogen, where the nitrogen content at farm sites was over twice that of the control sites: 1.2 and 0.5%, respectively (significant at p < 0.001). The difference in nitrogen content was responsible for the sharply differing C : N ratios of 32.9 and 81.4 for farm and control sites, respectively (significant at p < 0.001).
As in other marine algae,
The significant differences we found in the morphol-
[Table 6.] Tissue nutrient contents for combined data from control and farm sites
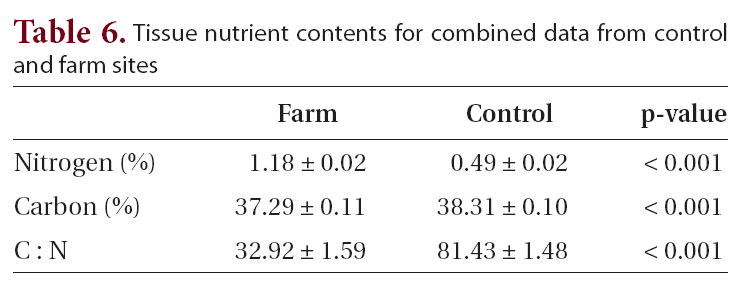
Tissue nutrient contents for combined data from control and farm sites
ogy of
The
The control site samples had more air bladders. To see if this was a true finding, and not simply a data artifact, we calculated the number of airbladders per unit length. This result shows the control site samples also had more air bladders per unit length of the longest frond. This is significant, as the number of air bladders on the longest frond provides an age estimate for
Previous accounts of phenotypic variation emphasize the role of shore elevation in determining growth and morphology. In his extensive review, Chapman (1995) suggests longer fucoid thalli occur lower on the shore because their greater immersion times allow greater growth (e.g., Vadas and Wright 1986, Stengel and Dring 1997). Other data from Nova Scotia (Garbary unpublished) confirm this for the northeastern mainland of the province. Thus, it is curious that we find little support for this in our data when we partition it based on tidal elevation (Table 4, Fig. 3). Neither vegetative nor reproductive biomasses, at farm or control sites, show differences attributable to tidal height (Fig. 3A & B). Moreover, at the farm sites, fronds from the lower elevation are significantly shorter in length (Fig. 3D). We confirmed this general observation by measuring the segments’ annual growth from the previous year (2009), finding no difference between shore elevations. The apparently contradictory significant difference in apical lengths that we measured in September may simply represent a shift in growth towards later in the season, for upper shore fronds. This anomaly might result from the extensive fogs during summer in southwestern Nova Scotia. These limit desiccation stress, particularly on thalli that have lower surface to volume ratios, such as those at the farm sites.
Our results show that land-based aquaculture facilities, and nutrient enrichment in general, affect the morphology of
Researchers have used tissue N content in seaweeds as an indicator of the local N status (Fong et al. 1994), and studies on tissue N content of macroalgae in coastal environments show strong correlations to N availability (Chopin et al. 2001, Neori et al. 2004). Studies have also employed the C : N ratio as a nitrogen depletion indicator, since tissue N varies depending on the N status in the environment, while tissue C content is rather consistent (Kim et al. 2007). In the present study, the high C : N ratio at the control sites clearly indicates nitrogen depletion in the region. This result is unsurprising, because few significant point or non-point nutrient sources exist in southwest Nova Scotia. At the farm site, the
Another, potentially more significant impact of the finfish effluent is coastal eutrophication, which often results in blooms of